Monthly Market Synopsis - COVERING THE PERIOD END TO MARCH 2021 - Ark Consultancy
←
→
Page content transcription
If your browser does not render page correctly, please read the page content below
ARK CONSULTANCY | MARKET SYNOPSIS

Monthly Market
Synopsis
COVERING THE PERIOD END TO MARCH 2021
ARK CONSULTANCY | MARKET SYNOPSIS

01         COMMENTARY
      Welcome to the latest edition of ARK’s market synopsis report
      covering market outcomes to the end of March and with
      Rightmove picking up reporting for April .

1.1   The four themes from our recent reporting continue to be evident:

      a)   No immediate cooling in the market
      b)   Caution regarding the outlook
      c)   The continued drive to the countryside
      d)   The race for space.

1.2   The reports point to ongoing increases in house prices, Halifax up 1.1% since February,
      Nationwide 5.7% month on month annual growth and Hometrack at 4% annual growth.

1.3   Halifax report that the average property is now worth £254,606, a new record high.
      Others report different averages but all show record highs.

1.4   So far so buoyant; but, readers must be concerned about the affordability of new
      homes. According to Halifax “March’s data shows that house prices rose by 6.5%
      annually, or £15,430 in cash terms”. The only real beneficiaries of such growth are
      downsizers! First Time Buyers are far worse off with homes consuming more of their
      income and affordability falling as salary inflation fails to keep up with house price
      inflation. Savings from stamp duty are being consumed in house price rises.

1.5   The next theme relates to caution with the Halifax saying “with the economy yet to feel
      the full effect of its biggest recession in more than 300 years, we remain cautious about
      the longer-term outlook. Given current levels of uncertainty and the potential for
      higher unemployment, we still expect house price growth to slow somewhat by the end
      of this year”

1.6   Nationwide are similarly cautious reporting - ”if the labour market weakens towards the
      end of the year as policy support is withdrawn, as most analysts expect, then activity is
      likely to slow nearer the end of 2021, perhaps sharply.”

1.7   The continued drive to the countryside is supported by figures from Nationwide;
      “Northern Ireland saw the highest growth of the home nations, with a 7.4% increase.
      Meanwhile, Wales and Scotland both saw an acceleration in annual price growth to
      7.2% and 6.9% respectively”.

1.8   Nationwide go on to say “The North West was the strongest performing region, with
      prices up 8.2% year-on-year. This is the strongest price growth seen in the region since
      2005 and average prices reached a record high of £181,999. There was also a further
      pick up in price growth in the neighbouring North, which saw a 7.2% annual increase.

1.9   What we term the Race for Space Hometrack call the “continued search for space”
      among homeowners and refer to that as an ongoing market driver. Halifax say “buyer
      demand is still fueled by a desire for larger properties and more outdoor space.”

PAGE 2
ARK CONSULTANCY | MARKET SYNOPSIS
02 HIGHLIGHTS
2.1 On a monthly basis, Halifax recorded an increase in house prices of 1.1% when
compared to February. The rise in market activity comes from the Government’s
announcement to extend the stamp duty holiday and the introduction of the mortgage
guarantee scheme.
2.2 In upcoming months Halifax is expected to see higher levels of market activity to be
maintained as customer confidence is gained due to the vaccine roll out and the search
for space continues for buyers.
2.3 Halifax goes on to mentions “However, with the economy yet to feel the full effect of
its biggest recession in more than 300 years, we remain cautious about the longer-term
outlook. Given current levels of uncertainty and the potential for higher
unemployment, we still expect house price growth to slow somewhat by the end of this
year.”
2.4 In the Nationwide reporting annual house price slowed down to 5.7% and month-on-
month house prices saw a fall by 0.2% from February’s readings after taking into
account seasonal effects. UK annual houses remain similar to Q4 last year, however
when broken down into regions the picture looks a little different. North West saw the
strongest growth, with an 8.2% increase. Conversely, London was the weakest
performing region with annual price growth at 4.8%.
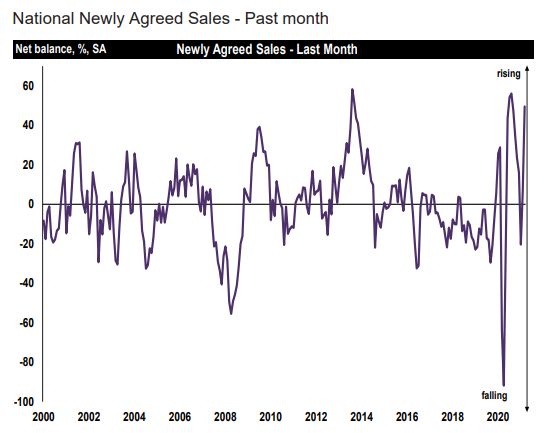
2.5 RICS reports a net balance of +59% respondent stated an increase in house prices.
With the increase in demand over supply it is expected for house prices to continue
towards an upward slope. Agreed sales and new buyer enquires also rose during
March with contributors citing a net balance of +50% and +42% respectively.
2.6 Hometrack marks in annual house price growth at 4.0%. At city level, Manchester
(6.5%) and Liverpool (6.3%) saw strongest annual house price growth. The weakest
performing city is Aberdeen where prices are down -1.7%. Cities that indicate the
largest demand levels in Q1 were Birmingham, Swansea, Glasgow, Liverpool and
Leicester, where average house prices are under £200k.
2.7 Like RICS, Hometrack also mentions the demand/supply mismatch: “The number of
homes being listed for sale has not kept pace with buyer demand foremost of the last
12 months, eroding the total number of homes for sale in most markets, with a
particular drop in the availability of family houses.”
2.8 In upcoming months Hometrack is expected to see price growth slowing down
especially in Q3 where government support initiatives will be reduced.
2.9 Moving to Rightmove, the average price of property coming in is at a new record high
of £327,797 – monthly increase of +2.1%. 30% of 2- & 3-bed semi-detached houses
are being marked as sold by agents having been on the market for less than a week.
This boost in market activity is driven by the mass market where few buyers will be
achieving the maximum stamp duty savings. However, this momentum is likely to slow
down later in the year.
PAGE 3ARK CONSULTANCY | MARKET SYNOPSIS
03 HALIFAX (MARCH)
3.1 Following a relatively subdued start to the year, the housing market enjoyed something
of a resurgence during March, with prices up by just over 1% compared to February.
This rise – the first since November last year – means the average property is now
worth £254,606, a new record high.
3.2 A year on from the early days of the first national lockdown, March’s data shows that
house prices rose by 6.5% annually, or £15,430 in cash terms. Casting our minds back
12 months, few could have predicted quite how well the housing market would ride out
the impact of the pandemic so far, let alone post growth of more than £1,000 per
month on average.
3.3 The continuation of government support measures has been key in boosting
confidence in the housing market. The extended stamp duty holiday has put another
spring in the step of home movers, whilst for those saving hard to buy their first home,
the new mortgage guarantee scheme provides an alternative route onto the property
ladder.
3.4 Overall we expect elevated levels of activity to be maintained in the coming months,
with consumer confidence spurred on by the successful vaccine rollout, and buyer
demand still fuelled by a desire for larger properties and more outdoor space, as work-
life priorities have shifted during the pandemic. A shortage of homes for sale will also
support prices in the short term, as lower availability always favours sellers.
3.5 However, with the economy yet to feel the full effect of its biggest recession in more
than 300 years, we remain cautious about the longer-term outlook. Given current
levels of uncertainty and the potential for higher unemployment, we still expect house
price growth to slow somewhat by the end of this year.
Halifax House Price Change %
9
% Change seasonally adjusted HPI
8
7
6
5
4
3
2
1
0
-1
Jul-20
Jun-20
Apr-20
May-20
Nov-20
Mar-20
Jan-21
Aug-20
Sep-20
Dec-20
Feb-21
Mar-21
Oct-20
Monthly Quarterly Annual
Change Change Change
% % %
Source: Halifax, IHS Markit
3.6 Click here to read more.
PAGE 4ARK CONSULTANCY | MARKET SYNOPSIS
04 NATIONWIDE (MARCH)
HEADLINES MAR-21 FEB-21
Monthly Index* 463.3 464.3
Monthly Change* -0.2% 0.7%
Annual Change 5.7% 6.9%
Average Price (not seasonally adjusted) £232,134 £231,068
* Seasonally adjusted figure (note that monthly % changes are revised when seasonal adjustment factors
are re-estimated)
Source: Nationwide
4.1 Annual house price growth slowed to 5.7% in March, from 6.9% in February. Prices fell
by 0.2% month-on-month, after taking account of seasonal effects, following a 0.7%
rise in February.
4.2 Recent signs of economic resilience and the stimulus measures announced in the
Budget, including the extension of the furlough scheme and the stamp duty holiday, as
well as the introduction of a mortgage guarantee scheme, suggest that housing market
activity is likely to remain buoyant over the next six months.
4.3 The longer-term outlook remains highly uncertain. It may be that the recovery
continues to gather momentum and that shifts in housing demand resulting from the
pandemic continue to lift the market. However, if the labour market weakens towards
the end of the year as policy support is withdrawn, as most analysts expect, then
activity is likely to slow nearer the end of 2021, perhaps sharply. Mixed picture across
regions in Q1
4.4 Overall UK annual house price growth in Q1 was similar to Q4, although there was a
mixed picture across the regions, with around half seeing a slowdown in growth.
Source: Nationwide
PAGE 5ARK CONSULTANCY | MARKET SYNOPSIS
4.5 Northern Ireland saw the highest growth of the home nations, with a 7.4% increase.
Meanwhile, Wales and Scotland both saw an acceleration in annual price growth to
7.2% and 6.9% respectively.
4.6 England was the weakest performing home nation in the three months to March 2021,
with annual house price growth of 6.4% - a slight slowing compared with last quarter
(Q4 2020), when prices rose at an annual rate of 6.9%.
4.7 The North West was the strongest performing region, with prices up 8.2% year-on-
year. This is the strongest price growth seen in the region since 2005 and average
prices reached a record high of £181,999. There was also a further pick up in price
growth in the neighbouring North, which saw a 7.2% annual increase.
4.8 London was the weakest performing region, with annual price growth softening to
4.8%, from 6.2% in Q4 last year.
4.9 Click here to read more.
PAGE 6ARK CONSULTANCY | MARKET SYNOPSIS
05 RICS: UK RESIDENTIAL MARKET SURVEY
(MARCH)
5.1 At the national level, a net balance of +42% of respondents cited an increase in new
buyer enquiries during March. This is up from a reading of zero previously and marks
the strongest return since September last year. Alongside this, new instructions coming
onto the market also improved, albeit the pace of growth (in net balance terms) was not
enough to match the pick-up in demand reported.
5.2 A common theme running through the comments left by contributors is that demand is
running ahead of supply, and more new instructions will be needed to balance the
market going forward. On that front, a net balance of +29% of respondents noted that
appraisals were up on the same period last year (a turnaround on a reading of -19% in
February), suggesting more new instructions should be in the pipeline over the next
few months.
5.3 Agreed sales rose firmly during March, evidenced by a net balance of +50% of
contributors reporting an increase. This marks a sharp acceleration compared to last
month (net balance +7%) and is in fact the strongest reading since August last year.
Source: RICS UK Residential Market Survey
5.4 Looking ahead, near term sales expectations rose noticeably to post a net balance of
+35%, up from a figure of +9% in February. The near-term sales outlook is now the
most upbeat since January 2020, with sales expectations positive across all parts of the
UK. That said, this rise in sales looks set to be concentrated over the next few months,
with the twelve-month expectations series consistent with more modest growth in
sales further ahead.
PAGE 7ARK CONSULTANCY | MARKET SYNOPSIS
5.5 With regards to house prices, a net balance of +59% of respondents cited an increase
at the national level over the latest survey period. This indicator has now risen slightly
in each of the last two months, although the latest reading is still slightly below the
recent high of +66% posted back in October last year. In terms of the regional
breakdown, prices are reportedly rising across all regions/countries of the UK, with the
strongest momentum signalled by respondents in the North West, Yorkshire & the
Humber, as well as Northern Ireland.
5.6 Given the recent excess of demand over supply, prices are expected to continue on a
firmly upward trajectory over the coming three months. At the headline level, a net
balance of +42% of survey participants expect prices to rise further in the near term, up
from a reading of +16% previously.
5.7 At the twelve-month horizon, a net balance of +60% of contributors nationally
anticipate higher prices in a year’s time (an increase on +46% returned last month).
Twelve-month price expectations are now pointing to significant growth across all
parts of the UK, led by particularly elevated readings in Wales, Scotland, and Northern
Ireland.
5.8 Click here to read more.
PAGE 8ARK CONSULTANCY | MARKET SYNOPSIS
06 HOMETRACK (MARCH)
6.1 House prices have been rising at an annual rate of 4% or more for five months,
although March marks the slowest rate of growth October 2020. Price growth is down
from 4.5% in January. High levels of demand which are not being matched by supply
will continue to support pricing, but the annual rate of price growth will continue to
ease as these extreme imbalances start to unwind.
6.2 Zoopla’s house price index is stock-weighted, rather than transaction-based, so, in
effect, it ‘looks through’ the increased sales of more expensive homes which has
characterised the market since last summer.
6.3 Annual price growth in the year to March continues to outperform in regions where
homes are more affordable, with values growing at an annual pace of 5.9% in Wales,
5.3% in Yorkshire and the Humber and 5.2% in the North West of England. London,
which has the highest average prices for homes of any region is lagging, with 2%
growth over the year, as shown on the map on page 6.
6.4 At a city level, Manchester and Liverpool retain their spots at the top of the price
charts, with 6.5% and 6.3% annual growth respectively. At the other end of the scale
for major cities, Aberdeen prices are down -1.7% on the year, although this is a more
modest decline than the -3.1% seen in March last year. Oxford and Cambridge, two of
the markets with highest value housing, are registering relatively muted growth of 1.6%
and 2%.
6.5 There has been strong buyer demand from the start of 2021, leading to one of the
busiest sales markets in years – with the value of homes sold subject to contract in the
first 15 months of the year almost double that in 2019 and 2020.
6.6 The combination of children returning to school and the stamp duty holiday extension
announcement in early March, as well as the return of first-time buyers and the
continued ‘search for space’ among homeowners came together to create a demand
boost, especially for family houses.
PAGE 9ARK CONSULTANCY | MARKET SYNOPSIS
6.7 The cities seeing the highest levels of demand in Q1 were Birmingham, Swansea,
Glasgow, Liverpool and Leicester, where average house prices are all under £200,000.
6.8 Demand peaked in the week following Easter, hitting levels more than double those
seen during the same period in 2017-2019.
6.9 After the first major easing of lockdown on April 12th in England, demand levels began
to fall back as households in England started to focus on catching up with friends and
family, and taking advantage of leisure activities and amenities which haven’t been
available since at least the turn of the year.
6.10 Buyer demand is likely to continue to ease as more parts of the country emerge from
lockdown, but given the myriad factors boosting the appeal of moving listed above,
buyer appetite will remain above average levels for this time of year through Q2.
6.11 The number of homes being listed for sale has not kept pace with buyer demand
foremost of the last 12 months, eroding the total number of homes for sale in most
markets, with a particular drop in the availability of family houses.
6.12 There was a near 30% rise in new listings after children returned to school in early/mid
March and home-schooling was at an end. This took the flow of new supply to levels
typical for this time of year in 2017-2019. But it is not enough to fully replenish stocks
of family houses, which remain the most in-demand type of housing.
6.13 The share of family houses listed for sale has fallen to the lowest level in years, with 3-
bed homes accounting for a quarter of homes available to buy, down from more than a
third in 2017. In total, houses make up 59% of listings, this year, down from 76% in
2017.
6.14 The tight market for family homes will limit further growth in sales volumes in the
short-term. However supply will start to build as homeowners become increasingly
comfortable opening their homes to viewings.
PAGE 10ARK CONSULTANCY | MARKET SYNOPSIS
6.15 The scale of buyer demand will also moderate from the peaks seen after Easter as
lockdowns end across the UK and households are able to return to some level of pre-
pandemic ‘normality’, enjoying amenities with family and friends.
6.16 However, the supply/demand imbalance will remain. The ‘search for space’ among
homeowners has further to run, especially as some office-based businesses are now
confirming how their working practices will change in the longer-term. More flexible
working arrangements open up new opportunities for homeowners to move to a
different location. At the same time, the roll-out of the 95% mortgage guarantee will
mean more demand from first-time buyers.
6.17 UK annual house price growth was at 2.1% at the start of the first lockdown, and is
now at 4% after peaking at 4.5% in January. Prices will be continue to underpinned by
the ongoing demand/supply imbalance, with the strongest growth in the more
affordable markets in the North and Midlands. The scale of price growth will slow in
the coming months however, especially as we move towards Q3 when the stamp duty
holiday extension comes to an end and government support for the economy starts to
be pared back.
6.18 Click here to read more.
PAGE 11ARK CONSULTANCY | MARKET SYNOPSIS
07 RIGHTMOVE (APRIL)
7.1 A monthly price surge of 2.1% (+£6,733) has propelled new seller asking prices to a
new record high, with the national average now standing at £327,797. This figure
shatters the previous record, set in October last year, by over £4,000. The big jump
comes as buyer demand sets another new record, chasing the lowest ever proportion
of property available to buy. This is now the fastest-selling market that Rightmove has
measured since our records began.
Source: Rightmove
7.2 Two- and three-bedroom semi-detached houses are being snapped up quickest, with
30% of those that are being marked as sold by agents having been on the market for
less than a week. This suggests that the surge in activity is now being driven by the
mass market where few buyers will be achieving the maximum stamp duty savings.
Momentum is being partly driven by the lack of property coming to market over the
last few months, which has reduced available stock levels as we move into the spring
home-moving season.
7.3 We can’t compare with the same period a year ago in 2020 when the housing market
was effectively suspended, but the number of properties coming to market in the last
month is up by a modest 3% on the same period in 2019. This means it has now
recovered to normal levels, but it is still massively outpaced by buyer demand. In
contrast the number of sales agreed is up by 55% on the same period two years ago,
and so the proportion of available property is at its lowest ever recorded by Rightmove.
7.4 However some of the froth is likely to come off this spring surge later in the year as the
challenging economic conditions come to the fore, some of the Government support to
individuals and businesses unwinds, and the stamp duty holidays finally end in England
and Wales. Nevertheless we expect activity to remain robust for the rest of 2021.
7.5 Click here to read more.
ARK Consultancy Limited
April 2021
PAGE 12ARK CONSULTANCY | MARKET SYNOPSIS
If you need help or advice on any aspect of this
report, please contact:
Chris Seeley – Director
Email: cseeley@arkconsultancy.co.uk
Telephone: 07770532571
PAGE 13You can also read