ACCORDING TO COINMARKETCAP REPORT - CRYPTO MARKET & USER TRENDS Q1 2020
←
→
Page content transcription
If your browser does not render page correctly, please read the page content below

According to
CoinMarketCap
Report
Crypto Market & User Trends Q1 2020

Crypto Market & User Trends Report | Q1 2020

About
CoinMarketCap
CoinMarketCap was founded May 2013 � when the price of Bitcoin
was about $100. As the industry’s #1 cryptoasset information site,
CoinMarketCap is the most-referenced and trusted source used by
individuals, institutions, governments and the media for comparing
thousands of crypto entities across hundreds of exchanges.

CoinMarketCap’s mission is to showcase the cryptocurrency revolution,
and firmly stands for accurate, timely and unbiased information, which
enables each user to draw their own informed conclusions using
CoinMarketCap data.

02

Crypto Market User Trends Report | Q1 2020

Executive Summary

Unique Lens                                               Q1 at a Glance
As the world’s #1 price-tracking, rankings                As many of you may know, Q1 was a turbulent period for
and market data website for cryptoassets,                 participants in the crypto industry. The start of the year
CoinMarketCap is known for many of its contributions      saw a strong demand for crypto, with Bitcoin reaching a
to the ever-growing crypto industry.                      high of $10,500 and total market cap hitting $305 billion
                                                          in February.
CoinMarketCap pioneered definitive metrics
that are used to characterize cryptoasset and             However, as the number of COVID�19 cases
cryptocurrency data. We were the first to apply           skyrocketed and spread around the world, leading the
the use of the “market capitalization” model to           World Health Organization to categorize the virus as a
cryptoassets to quickly value one cryptoasset against     global pandemic, all markets — including traditional
another. We pioneered the “supply” metrics, with          safe havens like gold — plummeted before going on to
circulating supply used to derive the market              recover in the following days.
capitalization of a cryptoasset, providing a truer
approximation of value. CoinMarketCap also                • The price of Bitcoin fell a whopping 43% on March 12,
popularized “Bitcoin dominance,” which is used to           touching a low of $3,900.
measure how much of the crypto market is captured
                                                          • On the same day, the total crypto market cap hit a low
by bitcoin.
                                                            of $150 billion, 57% lower than the previous month.

We are also the top-ranking crypto data aggregator in
                                                          While Bitcoin is oft-touted as “digital-gold,” it sold off
terms of user base and web traffic. Our data,
                                                          the hardest, which caused people to question its
commonly cited by CNBC, Bloomberg and other major
                                                          status as a purported safe-haven asset. That said, in
news outlets globally, is deemed as an authoritative
                                                          Q1, both Bitcoin and the crypto market in general
source for crypto rankings and metrics.
                                                          have outperformed global benchmarks for equities,
                                                          like the MSCI World Index and S&P 500.
In this report, we present you with our unique insights
on how the crypto market has performed and what the
                                                          Today, crypto markets have regained a good portion of
notable trends are for Quarter 1 �Q1� 2020 � all
                                                          their March losses, but they still have some ways to go
through the lens of our proprietary market
                                                          before they recover to the price levels we saw early in
capitalization data and user insights from our massive
                                                          the quarter.
user base!

                                                                                                                   03
Crypto Market & User Trends Report | Q1 2020

                                                            Amid the mixed landscape in crypto, two other trends
Within the Crypto Market,                                   seemed promising. Growth from the female user
It Was a Mixed Bag                                          segment and youth user segment (i.e. 18�24 year olds)
                                                            were strong in Q1 at 43.24% and 46.04% respectively.

In Q1, Bitcoin suffered greater relative losses in market
                                                            • Within the female user segment, the Americas and
cap (-9.78%� compared to most of the top 10 other
                                                              European regions grew more than 50% in users. An
cryptoassets as well as the rest of the other
                                                              exceptional growth of more than 80% in female users
cryptoassets as a whole.
                                                              was led by countries including Colombia, Venezuela,
                                                              Romania, Greece and several others. (see Section 5
However, there were several cryptoassets that gained
                                                              for the full list).
significant momentum in this grim quarter. By market
capitalization, BCH ��10.48%�, BSV ��76.0%�, XTZ            • In relation to the youth user segment, the continent of
��20%�, LINK ��25.4%� and LEO ��26.83%� were able to          Oceania saw the biggest percentage jump of 151.95%,
come out of Q1 better than they started. Notably, BSV         followed by Africa with 91.47%. Section 6 lists the
and BCH received a sudden surge in attention; the             countries that saw exceptional growth of more than
former shot up 29 spots to become the seventh most            80% in young users; these include India, the UK, Spain
viewed cryptoasset on CoinMarketCap, and the latter           and Mexico among others.
rose 14 spots to become the 10th.
                                                            It is telling that our data shows how the crypto
Something interesting we noted was a drastic drop in        industry is still nascent and continuing to evolve.
user traffic from China (see Section 3� that coincided      While Bitcoin dominance holds strong, other
with the beginning of the COVID�19 global pandemic,         cryptoassets such as BSV and BCH have displayed
also timed with speculations around the Great Firewall      abilities to outperform Bitcoin and global asset
and China’s suppression of online citizen reports           benchmarks like the S&P 500 Index. At the same time,
concerning the pandemic that might have affected            crypto continues to garner more attention from
access to internet services.                                different corners of the world.

04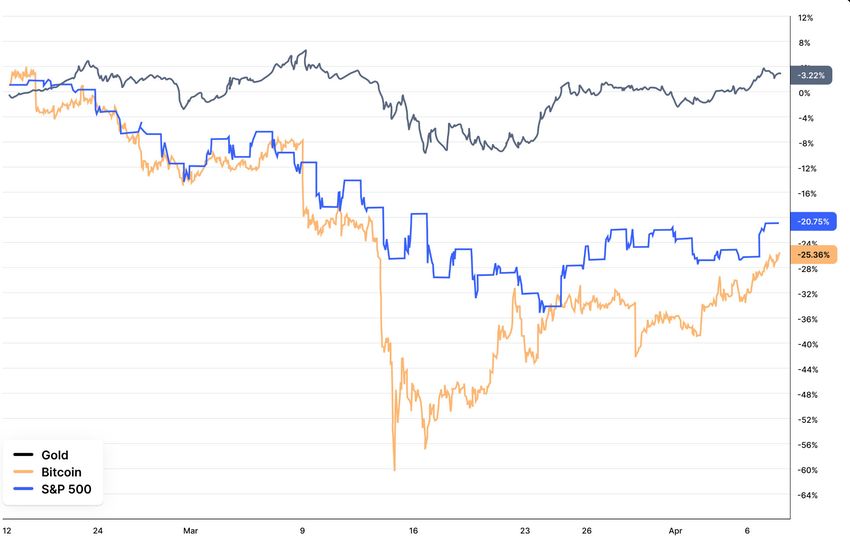
Crypto Market & User Trends Report | Q1 2020

Table of Contents

     INTRO

06   2020 - A Strong Start, Followed by
     Massive Selling of Assets for Cash

     SECTION 2

07   Focusing on the Recovery

     SECTION 3

08   Bitcoin Suffered, But Six Other
     Cryptoassets Gained

     SECTION 4

11   How China’s Drop in CMC User
     Geography Relates to COVID-19

     SECTION 5

12   Strong Female User Growth by Geography

     SECTION 6

13   Strong Youth User Growth by Geography

14   Report Conclusion

15   Upcoming From CoinMarketCap

                                                                       05
Crypto Market & User Trends Report | Q1 2020

INTRO

2020 — A Strong Start
Followed by Massive
Selling of Assets for Cash

We started 2020 on a relatively muted note,          Crypto was not spared, and on March 12, Bitcoin’s price drastically
carrying over a bearish sentiment from the           dropped 43% and touched a low of $3,900 � the last time Bitcoin
end of 2019. As previously highlighted in our        had seen $3,900 was back in December 2018. Additionally,
yearly report, “According to CoinMarketCap           derivatives exchanges saw massive liquidations of leveraged longs
2019,” 2019 was a year divided into two              and the crypto market cap hit a low of $150 billion the same day.
distinct periods: bullish in the first half of the
year as Bitcoin touched highs near $14,000,          The crypto markets have since retraced a good portion of this
with a corresponding crypto market cap of            downward trend, but we are still some ways from recovering to the
$366 billion, and bearish in the second half of      prices before the massive flight to liquidity.
the year as Bitcoin reached a low of $6,500,
with the crypto market cap in decline to $190
billion in late December 2019.

The start of Q1 2020 saw a strong push in
demand for cryptoassets, where Bitcoin reached
$10,500, and total market cap soared to $305
billion in the middle of February.

However, all prices went south shortly after
due to the global outbreak of COVID�19, which
triggered investors to sell their risk assets for
cash in a hurry. All liquid assets were sold off
in a worldwide flight to liquidity (USD�,
including traditional safe havens like gold.

             Table 1� Performance Comparison
            Among Bitcoin, Crypto Market and
              Global Benchmarks of Traditional
                                 Financial Assets

06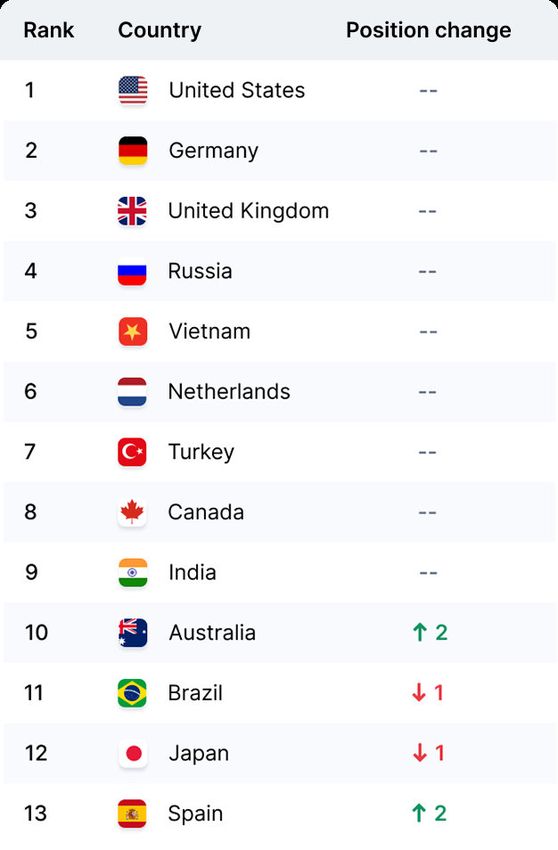
Crypto Market & User Trends Report | Q1 2020

SECTION 2

Focusing on
the Recovery
The following chart shows the price movement in                While Bitcoin is oft-touted as “digital-gold,” it was sold off
Bitcoin, gold and the S&P 500 since Feb. 20, which was         the most, which caused many to question its status as a
the start of the risk-off sentiment when we saw the            purported safe-haven asset. However, we should not ignore
beginning of the sell-off of equities and Bitcoin. The         the macro factors surrounding the sell-off, where every
correlation of the S&P 500 and Bitcoin reached a high of       single liquid asset was unanimously sold off in a flight to
0.87 during this period (Feb. 20 to March 12� before           liquidity — to the world’s global reserve currency, the USD.
starting to decouple as prices recovered.                      This liquidity crunch was similar to what we saw in the early
                                                               stages of the financial crisis of 2007. As the Federal Reserve
Gold was spared from most of the risk-off sentiment in         continues on its path of “unlimited quantitative easing” to
the early stages, but eventually sold off hard on March        support the functioning of the US economy, only time will
12 as investors liquidated assets in a bid to raise capital.   tell if Bitcoin will be recognized as a form of hard money
It has since fully recovered and is now trading in the         that hedges against the potential inflation that might arise
positive as compared to Feb. 20.                               from the actions of the Federal Reserve.

Chart 2� Price Movement of Bitcoin, Gold and S&P 500

                                                                                                                                07
Crypto Market & User Trends Report | Q1 2020
Bitcoin Suffered, But Six
Other Cryptoassets Gained
held steady in a narrow range of 60�70% for the entirety bitcoin) were similar to the rest of the cryptoassets for
of Q1 2020. Even though markets were volatile, there was the entirety of Q1 2020. This highlights the distribution
very little transfer of value among the various of value in the crypto markets, with Bitcoin taking about
cryptoassets. As expected, all cryptoassets saw a very 60�70% of market share, the next five cryptoassets
similar drop in prices on March 12. taking approximately 20% of market share, and the rest
The market cap of the top five cryptoassets (excluding distributed among the remaining assets.
Chart 3� Market Capitalization Performance of BTC Against Other Cryptoassets
08Crypto Market & User Trends Report | Q1 2020
Table 4� Crypto Market
Capitalization Breakdown
The market map analysis for Q1 2020
paints a mixed picture of the crypto
landscape. Bitcoin suffered greater
relative losses in market cap (-9.78%�
than most of the top 10 other crypto
assets and the rest of the other
crypto assets as a whole. BCH
��10.48%�, BSV ��76.0%�, XTZ
��20%�, LINK ��25.4%� and LEO
��26.83%� were able to come out of
Q1 better than they started, bucking
the trend of investors selling off risk
assets for cash globally.
Table 5� Price Performance of
BTC and Top 10 Cryptoassets
Several assets in the top 10 cryptoassets
have outperformed the general markets
in terms of price performance — notably
BSV, LINK, LEO and XTZ. It is interesting
to note that the top cryptoassets, in
general, have outperformed global
benchmarks for equities, like the MSCI
World Index (-20.65%� and the S&P 500
��19.42%�.
09Crypto Market & User Trends Report | Q1 2020
Bonus Insight
BSV and BCH shot up sharply to become ranked
among the top 10 most-viewed cryptoassets in
CoinMarketCap for Q1! BSV gained 29 spots to
become the seventh most viewed cryptoasset, and
BCH rose 14 spots to become the 10th most viewed
cryptoasset on CoinMarketCap.
Table 6� Ranking of Cryptoassets by Page Views
As the Bitcoin halving event nears, and
central banks across the world embark on
unprecedented quantitative easing, the
next few quarters will offer valuable
insights into the role that cryptoassets will
play in the broader financial universe.
10Crypto Market & User Trends Report | Q1 2020
SECTION 4
How China’s Drop in CMC User
Geography Relates to COVID-19
In terms of user geographies, there was a drastic drop in was reported that the virus had spreaded to major cities
page views from China in Q1 2020. with over 500 confirmed cases, and on Jan. 23, Wuhan,
the capital of Hubei, went into a lockdown. During this
Previously ranked #13 in terms of page views, China period, speculations around China’s Great Firewall and
fell to #24, making it the only country within the top 25 the suppression of online reports emerged.
that shifted down by more than 10 spots.
Also, our users probably had bigger worries than
This occurrence took place during the period of Jan. checking CoinMarketCap at the time!
14�25, when the situation with COVID�19 began to
escalate. To provide some context, the first COVID�19 The other CoinMarketCap user geographies in the top
death was reported in China on Jan. 10. By Jan. 22, it 25 saw few movements otherwise.
Table 7� Ranking of User Geographies by Page Views
11Crypto Market & User Trends Report | Q1 2020
SECTION 5
Strong Female User
Growth by Geography
While we have consistently seen an increasing number Exceptional growth of more than 80% quarter-on-
of female users, this segment saw a particularly strong quarter in female users was seen from these countries:
growth of 43.24% compared to the previous quarter.
The strong growth was especially prevalent in the • Venezuela (+80.23%�
following categories: • Colombia (+82.03%�
• Czechia (+85.6%�
• The age range of 18�24 year olds, where we saw an • Ukraine (+86.68%�
increase of 65%. • Indonesia (+88.92%�
• The continents of the Americas and Europe, where • Portugal (+89.95%�
there was more than 50% growth. • Argentina (+98.23%�
• Romania (+145.09%�
• Greece (+163.67%�
Chart 8� Growth in Female Users By Regions
12Crypto Market & User Trends Report | Q1 2020
SECTION 6
Strong Youth User
Growth by Geography
Compared to the previous quarter, the 18�24 age group Countries that saw more than 80% quarter-on-quarter
saw a 46.04% increase in site visits. This is closely growth in users aged 18�24 included:
followed by the 65� age bracket, which saw a 41%
increase. �Whoever said that baby boomers are out of • Pakistan (+81.79%�
touch with newer trends like crypto ought to reconsider. • India (+83.07%�
There may be more that the youths and their • Colombia (+85.07%�
grandparents have in common than the youth meme • UK ��91.48%�
“ok boomer” culture would have us think!� • Mexico (+97.33%�
• Canada (+112.45%�
The continent of Oceania saw the largest percentage • Spain (+120.71%�
growth of 151.95%, mostly attributable to Australia. • Australia (+158.07%�
Africa saw the second-largest percentage growth of • Nigeria (+210.6%�
91.47%, thanks to Nigeria, which saw a 210.6% surge
in user numbers.
Chart 9� Growth in Users Aged 18�24
13Crypto Market & User Trends Report | Q1 2020
Report
Conclusion
The role that crypto plays in the world remains open to The hype surrounding crypto as a fund raising
many possibilities. mechanism has also arguably tapered off. From the
boom of initial coin offerings (ICOs) in 2017 to the
We saw how Bitcoin’s long-running narrative as the evolution of exchange-led fundraising in initial exchange
“digital gold” for hedging against global economic offerings (IEOs), the viability of raising capital via the
turmoil was questioned in February during the stock issuance of tokens is now at a trough. That said, the
market crash, behaving more like a risk asset than a blockchain revolution has just begun and we eagerly
safe haven. Yet, how far should one read into this await the launch of new, innovative solutions that the
incident? The market turmoil triggered by COVID�19 industry will offer.
would be considered an anomaly to the whole financial
system as all assets uniformly sold off, a testament to It is still too early to foretell the role and fate of crypto,
the panic seen in markets. as it could hold different meaning to different groups
of people, depending on the economic and social
Q1 also showed us that the opportunities for crypto climates in which they live. As our user data has
market growth do not rest solely on BTC. In the midst shown, crypto continues to see a growing interest from
of the financial market crunch, certain cryptoassets like young (and baby boomer) demographics across the
BCH, BSV, XTZ, LINK and LEO have emerged to world. It is with caution and excitement that we
outperform BTC and general markets such as global encourage everyone to continue to keep an active
benchmarks for equities like the MSCI World Index and pulse on the evolution of crypto.
the S&P 500.
14Crypto Market & User Trends Report | Q1 2020
Upcoming From
CoinMarketCap
To aid in crypto adoption, we at CoinMarketCap plan to • Expanding existing data categories such as the
increase the amount of crypto know-how, starting with perpetual swap data recently added on
the dissemination of valuable data and analyses through CoinMarketCap, the interest rate products and block
reports like this one, as well as developing new and explorer data launched late last year;
improved tools such as:
• Crowdsourcing data by empowering users to
contribute tags and upvotes/downvotes on our site
• Launching our Liquidity Metric, with an improved
directly.
version to be rolled out by June, to help users find the
best markets to buy and sell their cryptoassets as
To make this exhaustive experience a seamless one for
efficiently as possible;
our millions of users, we will soon be rolling out the
ability for you to register for a CoinMarketCap account.
That way, you can sync your watchlists, portfolios and
content across the site and app.
Meanwhile, during this unprecedented global pandemic,
please stay safe wherever you are and keep an eye out
for our next report and upcoming launches!
15coinmarketcap.com
You can also read