Integrated assessment modelling for aviation - Lynnette Dray Air Transportation Systems Laboratory, Air ...
←
→
Page content transcription
If your browser does not render page correctly, please read the page content below
Integrated assessment modelling for aviation

                       Lynnette Dray

            Air Transportation Systems Laboratory,
       UCL Energy Institute, University College London &
               Air Transportation Analytics (ATA)

                   NATS CTC, 16 January 2020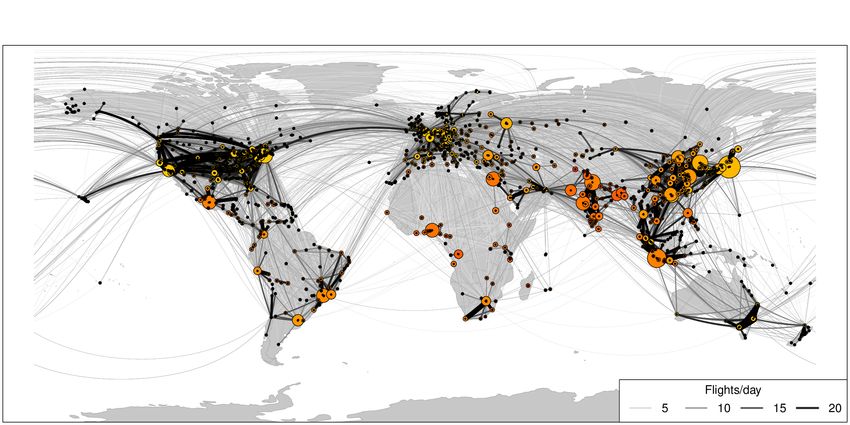
Background
• Aviation policy outcomes depend on the interaction of multiple stakeholders across
  different geographic scopes
   • Airlines, airports, ATC, passengers, regulators, manufacturers...
   • Complex relationships between capacity, scheduling, fleet, passenger demand, technology,
     networks etc.
• Answers to many questions affected by these interactions, e.g.
   • How does the system respond to emissions-mitigation policy?
       •   CCC’s Net Zero report projects aviation as single highest-emitting UK sector in 2050 (CCC, 2019)
   • What are the wider impacts of capacity expansion?
       •   Current total value of airport construction/expansion projects globally is > $600 billion (CIC, 2016)
   • Should we invest in battery electric aircraft as a feasible alternative to current technology?
• Airport Capacity Consequences Leveraging Aviation Integrated Modelling (ACCLAIM)
   • Three year EPSRC-funded project between UCL, the University of Southampton and Imperial
     College
   • Builds on the existing AIM model (University of Cambridge)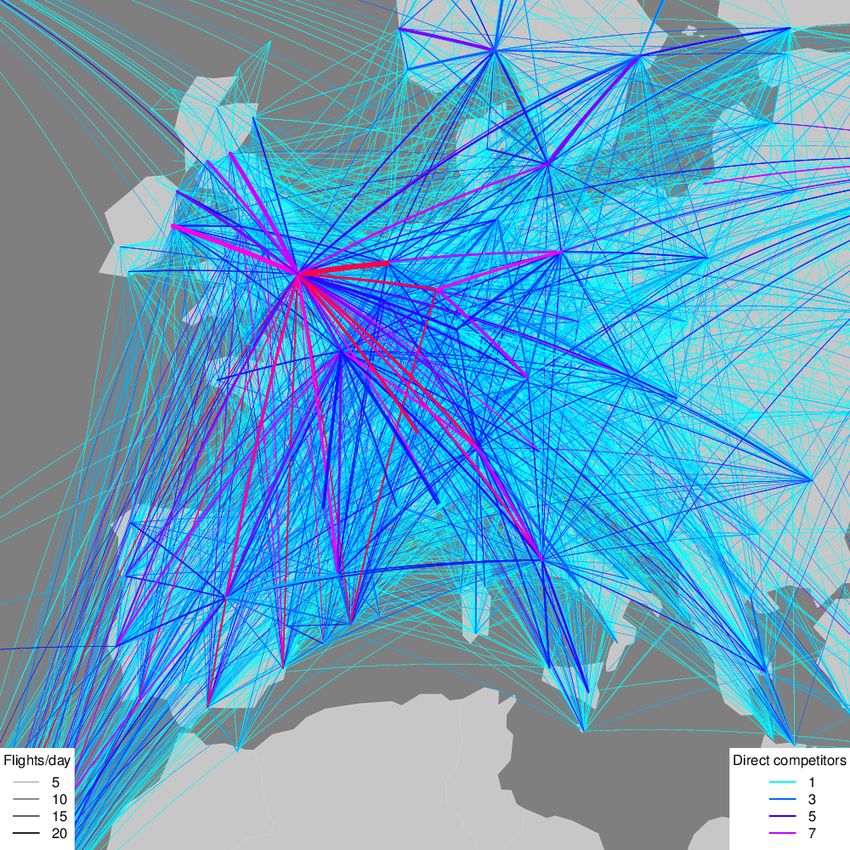
[Data: Sabre, 2017; ICAO, 2018]
How do we model the global aviation system?

 Solve iteratively
    (AIM2015)
         OR
 Optimise profit
per airline (Airline
Behaviour Model)

               Open source – see www.atslab.org for more information/papers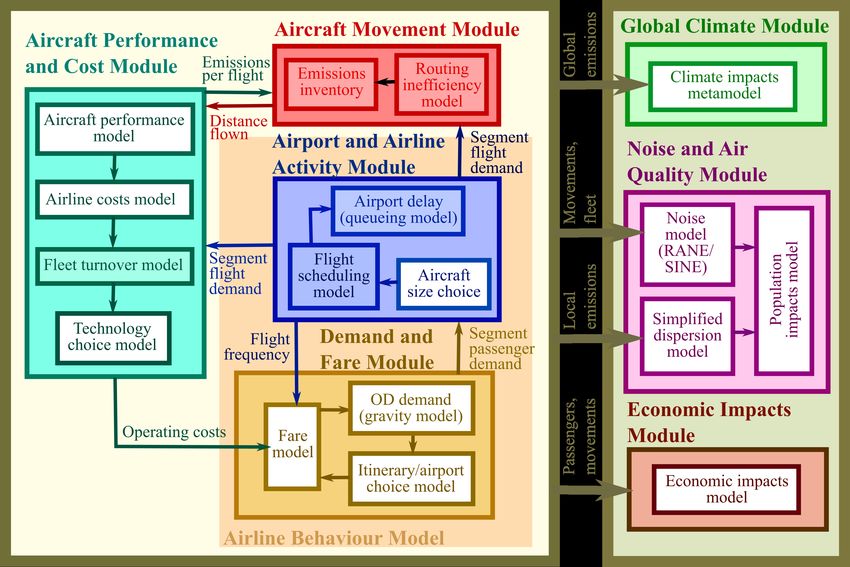
Methodology – demand and fare module
• Total city-city passenger demand depends on population,
income, fare and other journey characteristics
• Gravity-type model estimated from Sabre (2016) data
• Fare depends on airline costs, competition, etc.
• Itinerary-level fare model Global, 2015 base year
estimated from global fare data
60
Actual
Million base year passenger departures
Modelled
(Wang et al. 2018)
50
40
• Itinerary choice depends on fare, 30
frequency, number of flight legs, 20
time etc. 10
• Estimated using a logit model 0
ATL
PEK
DXB
LAX
HND
LHR
ORD
CGK
HKG
DFW
PVG
DEN
FRA
CDG
IST
SIN
CAN
JFK
LAS
BKK
KUL
AMS
PHX
SFO
DEL
ICN
MCO
MAD
KMG
SEA
BOM
SZX
MUC
MIA
CTU
CLT
IAH
SYD
GRU
FCO
SHA
EWR
YYZ
BOS
MSP
MNL
MEX
TPE
NRT
XIY
Airport Code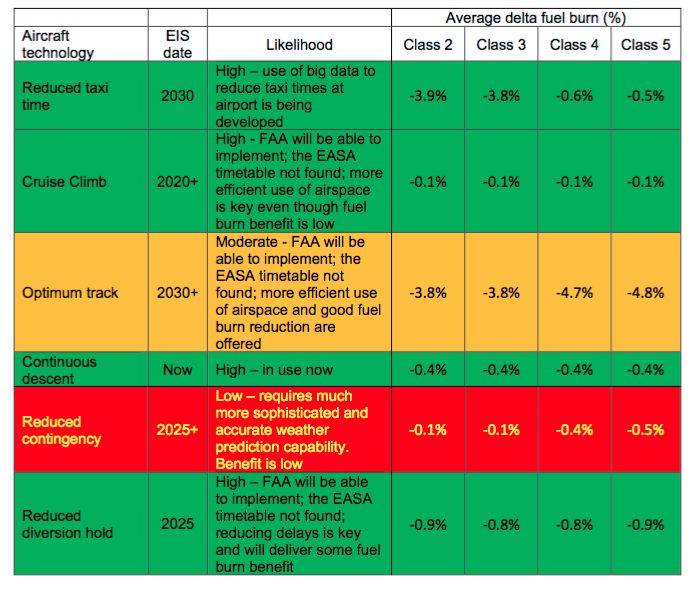
Methodology – airport and airline activity module
• Aircraft size choice model picks fleet to use based on demand,
airport characteristics, etc.
q Assuming typical segment load factors this gives flight frequency and fleet
requirement
• Scheduling throughout the day is based on existing
airport-level schedule structure
• Rapid queueing model for airport delay
• Depends on demand for flights vs. airport capacity
• Can also be used to project capacity required for delay to
remain at current levels
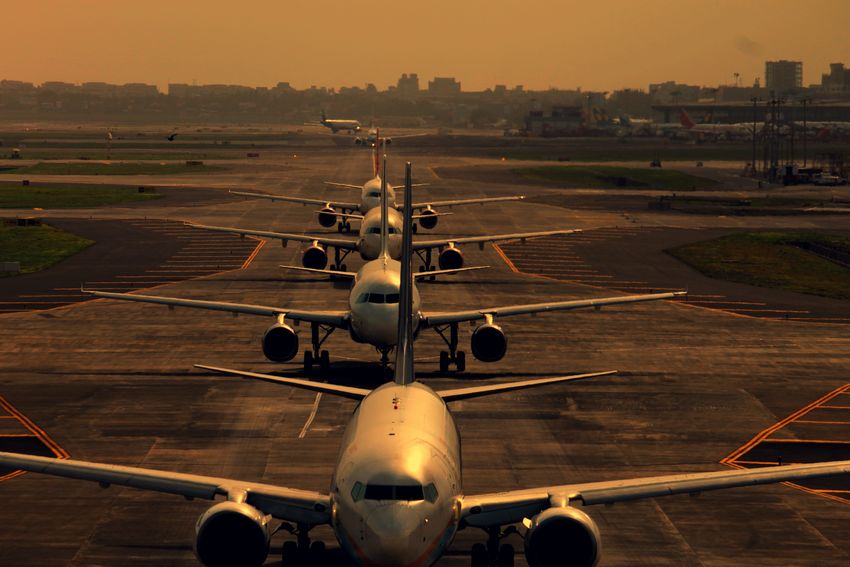
• See Evans (2008) [Image: Mumbai Airport, Wikimedia commons]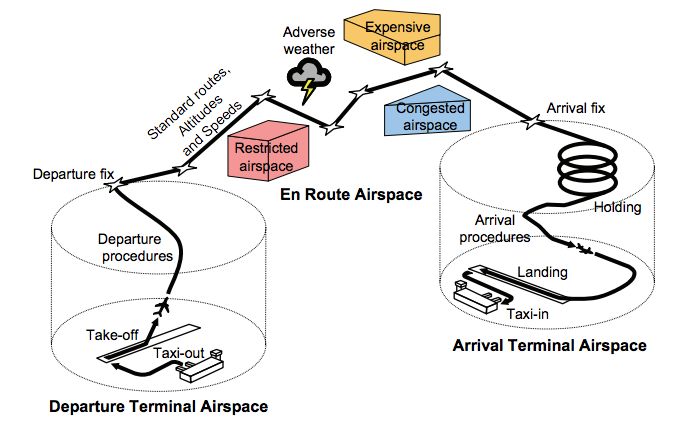
Methodology – aircraft movement module
                                     • Projects how fuel use/distance flown vary due to en-route
                                       inefficiencies (Reynolds 2008)
• Two components:
     q    Ground track extension (derived from radar track data)
     q    Impact of non-lateral inefficiencies (e.g. non-optimal speed or altitude) on fuel use
• Fuel use along great circle tracks is then adjusted to reflect
  this
 Region         Average route length Average     Average    Flight data source
                in data (nm)         TGTE (nm)   TGTE (%)
 Intra Europe   415                  57          14         FDR (n=4420)
 Intra US       635                  76          12         ETMS (n=2946)
 Intra Africa   489                  41          8          Mozaic (n=525)
 North Atlantic 3430                 176         5          Mozaic (n=3311)
 Europe – Asia 4705                  316         7          Mozaic (n=2448)
 (typical)
 Europe-Asia   4730                  1100        23         Mozaic (n=37)
 (Extreme)
                                                                                                  [Source: Reynolds, 2008]
Methodology – aircraft performance and cost module
• Al Zayat et al. (2017) - performance and cost model development
q Estimated performance model based on output from Piano-x for nine aircraft size
classes
q Operating costs by category based on ICAO and US Form 41 data
Size Category Approx. seat Reference aircraft Reference engine
• Fuel use adjusted to range
30-69 CRJ 700 GE CF34 8C5B1
reflect fleet Small regional jet
70-109 Embraer 190 GE CF34 10E6
composition and Large regional jet
110-129 Airbus A319 V.2522
turnover (Dray 2013) Small narrowbody
130-159 Airbus A320 CFM56-5B4
Medium narrowbody
160-199 Boeing 737-800 CFM56-7B27
• NPV model for choice of new technologies Large narrowbody
200-249 Boeing 787-800 GEnx-1B67
(e.g. Dray et al. 2018) Small twin aisle
259-299 Airbus A330-300 Trent 772B
q E.g. future generation ’conventional’ design + Medium twin aisle
300-399 Boeing 777-300ER PW4090
biofuel vs. battery electric narrowbody Large twin aisle
400+ Airbus A380-800 EA GP7270
Very large aircraftMethodology – impact assessment modules
• These are simplified models intended to capture broad impacts
on externalities
q Climate modelling uses a metamodel based on p-TOMCAT output
to get GWP/GTP
§ See e.g. Krammer et al. (2013)
q Single-metric noise model (SINE) developed by Southampton
University (Torija et al. 2016)
q NOx estimates are generated by the performance model
§ For NO2 we use Wood et al. (2008)
q PM2.5 estimates use the FOX method (Stettler et al. 2013)
§ Note that all pollutant estimates are aircraft engine primary emissions only
q Dispersion modelling uses RDC code (e.g. Barrett & Britter, 2009)
q Economic impacts metamodel for employment/GVA
§ still in validation processModelling scope
• Flights between
1169 airports in
878 cities
modelled
• 2015 base year
• Includes
uncertainty
• Lens approach
for
technologies
• Plus a range of
input scenarios
• Future projections to 2050 and beyond
• Given projections of population, GDP/capita, oil price, technology etc.Example – global potential for CO2 reduction from jet engine aircraft
• Dray et al. (2018) based on technology characteristics from Schäfer et al.
(2016)
• Examining what emissions reductions are possible/likely from:
• Retrofits to existing fleet
• Operational/maintenance changes
• New airframes/engines (excluding options which would require significant
infrastructure/network change)
• Supply curve-limited drop-in biofuel uptake from cellulosic biomass
• Not included: electric aircraft, hydrogen, electrofuels, …Example – global potential for CO2 reduction from jet engine aircraft
With biofuels
• Year-2050 fuel lifecycle CO2 60000
RPK over time 40000 2050 RPK by carbon price
varies between 620 and 1690 Mt 50000
RPK in 2050, billion
Without biofuels, 1630 – 3400 Mt 30000
RPK, billion
q 40000 SSP1
SSP2
• 1.9-3.0 %/year reduction in 30000
SSP4 20000
Past data
lifecycle fuel/RPK to 2050 20000
10000
10000
q Without biofuels, 0.8 – 1.6 %/year
0 0
q US domestic narrowbody similar to
Fuel lifecycle CO2 in 2050, Mt
4000 3000
Lifecycle CO2 over time 2050 CO2 by carbon price
Schäfer et al. (2016)
Fuel lifecycle CO2, Mt
2500
3000
• Carbon price primarily affects Optimistic
2000
emissions via RPK at levels 2000 Central 1500
Pessimistic
modelled 1000
1000
q Relatively small impact on 500
technologies used 0 0
0 50 100 150
1980
2000
2020
2040
2060
q Higher impact if no biofuel Carbon price in 2050, year 2015 USD
Year
[Past data: ICAO, 2016; IEA, 2017]Example – global potential for CO2 reduction from jet engine aircraft
Without biofuels
• Year-2050 fuel lifecycle CO2 60000
40000
varies between 620 and 1690 Mt 50000
RPK over time 2050 RPK by carbon price
RPK in 2050, billion
q Without biofuels, 1630 – 3400 Mt 30000
RPK, billion
40000 SSP1
• 1.9-3.0 %/year reduction in 30000
SSP2
SSP4 20000
lifecycle fuel/RPK to 2050 20000 Past data
10000
10000
q Without biofuels, 0.8 – 1.6 %/year
0 0
q US domestic narrowbody similar to
Fuel lifecycle CO2 in 2050, Mt
4000 3000
Schäfer et al. (2016) Lifecycle CO2 over time 2050 CO2 by carbon price
Fuel lifecycle CO2, Mt
2500
• Carbon price primarily affects 3000
2000
Optimistic
emissions via RPK at levels 2000 Central 1500
modelled
Pessimistic
1000
1000
q Relatively small impact on 500
technologies used 0 0
Higher impact if no biofuel 0 50 100 150
1980
2000
2020
2040
2060
q
Carbon price in 2050, year 2015 USD
Year
[Past data: ICAO, 2016; IEA, 2017]What else can we do with AIM2015?
• Some recent examples:
• Carbon leakage (Dray & Doyme 2019) – assessing leakage impacts of UK-specific
aviation policy for DfT
• Found leakage can be over +/- 100%, strongly dependent on policy type, evaluation scope
• Assessing uncertainty in future aviation sector emissions (Dray et al. 2019)
• To 2050 CO2 uncertainty can be ~ factor of 2, sensitivity to global/regional GDP
• This has implications for the success of policies based on meeting a given CO2 target
• Looking at different ways of combining the EU ETS and CORSIA
• Ongoing study for DG CLIMA
• Looking at aircraft scrappage policy and if this could
be supported by a carbon tax (Dray et al. 2014)
• Assessing electricity requirements for battery
electric aircraft networks (Schäfer et al. 2018)
• Location-based emissions inventories [Global aviation CO2 SSP2 scenario, no
radical new technologies, central technology lens]The next step – airline competition modelling
• Why model airline competition?
q Airlines set fare, frequency based on profit- (or market share-) maximization
q This affects how they respond to system changes
§ E.g. cost changes, new competitors, new technology availability, …
• One key area affected by competition is response to new capacity
q Airlines can respond by, e.g.:
§ Changing frequency on existing routes
§ Starting new routes
§ Changing aircraft types used to/from the airport
§ Changing fares
§ Changing operations, frequency, fleet and demand at other airports (potentially across the world)
q These changes are interlinked, and have economic and environmental impacts
• The idea of ACCLAIM is to make a first order assessment of these changes with
one integrated modelModelling airline competition - methodology
Each airline is a player in an n-player noncooperative game. They attempt to maximise profit by adjusting
the decision variables of airfares, flight frequency and choice of aircraft on routes within their network:
X X X X X
PA = farei .paxi + arevA .paxA opcosta,j .freqa,j paxcosta,j .paxa,j
i2ITNA j2SEGA a2CRFTj j2SEGA a2CRFTj
Revenue Flight related costs Passenger related costs
Passenger numbers are limited by each itinerary’s market share of overall air travel demand between
two locations:
paxi MSi .Di
Itinerary market share e Ui Overall city-pair air travel demand,
MSi = P
given by a (MNL) choice model: e Uj given by a gravity model.
j2ITNoi di
Constraints also include fleet, the number of seats available on each aircraft type, and airport capacity.Example – Australian domestic market
Market Share Domestic Departing Flights per Year
Whole Network Melbourne to Sydney
90000
Predicted Actual
Actual 70000
Actual
50000
Qantas Predicted 30000
Predicted 10000
Virgin
Jetstar -10000
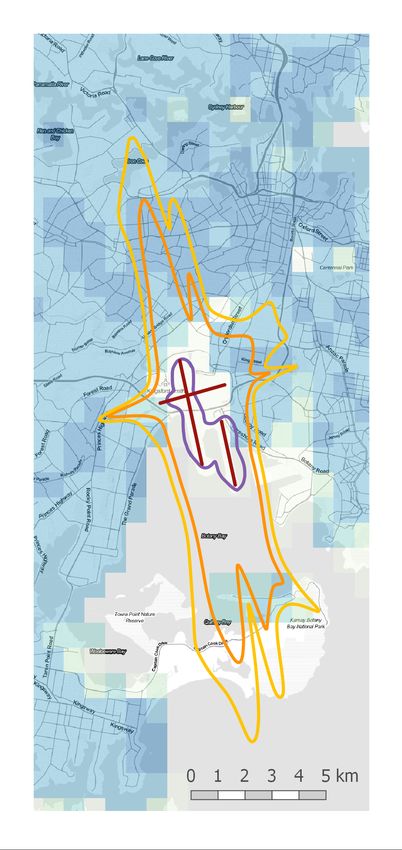
TigerairExample scenario – capacity expansion at Melbourne
Flights/d
DRW 5
1
CNS
1
2
TSV
MKY
• MEL is close to capacity with a new runway planned for 2025 ROK
c(0, 10)
BNE
OOL
e
• Good test case to examine airline behaviour under capacity constraints PER
ADL
SYD
NTL
| tr
CBR
• System projected to 2025:
MEL
AVV
LST
HBA
• Generate high/mid/low demand scenarios with SYD
MEL
different socioeconomic projections Scenario
passenger, year 2015 USD
BNE
30 (a) Whole system, LC PER
Airline gross profit per
ADL
OOL high mid low
Estimate fleet using existing orders
25
•
CNS
Others
20 Airline type
0.0
0.2
0.4
0.6
0.8
1.0
1.2
0.0e+00
5.0e−07
1.0e−06
1.5e−06
0
2
4
6
• Model a range of (domestic) capacity values,
Local primary
Departing flight Charged aircraft engine
15 CO2, Mt PM2.5, tonnes
Non−charged
Noise energy
from no expansion (35 flights/hour), to 50% of 10
MEL LC extra $/pax
index
new slots (55 flights/hour) 5 $2.5
$7.5
$12.5
$17.5
30 (c) Whole system, FC1
passenger, year 2015 USD
0
• Also examine how this interacts with costs 25
Airline gross profit per
passenger, year 2015 USD
30 (b) Whole system, FC
• Endogenously generated insights include:
Airline gross profit per
20
25
• Capacity limits reduce cost pass-through level 20 15
15
• Significant scarcity rents at constrained airports 10
10
Fuel extra $/kg Fuel extra $/kg
• Environmental/economic impact of airport 5 $0 $0.4
5
$0 $0.4
expansion significantly affects other airports
$0.2 $0.6 $0.2 $0.6
0 0
35 40 45 50 35 40 45 50
2025 MEL domestic capacity, flights/hour 2025 MEL domestic capacity, flights/hourAirline behaviour model – ongoing work (North America)
• Model is fully calibrated/tested for North America and Australia
• Larger world regions require more complex model
• Importance of multi-airport systems and surface transport - > nested logit route/airport/mode choice
• Need calibration factors to account for income distributions, ‘other’ historical links between cities
• Larger computational problem -> parallelisation
• Example for North America – (hypothetical) expansion at La Guardia
• Illustrates multi-airport system dynamics
Pre-Expansion Post-Expansion
Departures Passengers Airfares Departures Passengers Airfares
Airports (thousand) (million) ($) (thousand) (million) ($)
LGA 194 13.7 227 215 15.1 225
EWR 161 11.7 260 163 12.1 260
JFK 110 10.7 239 113 11.1 234
Other 17 1.2 240 17 1.3 239
NY Total 482 37.3 240 508 39.6 238Airline behaviour model – ongoing work (Europe)
• Intra-Europe and intra-Middle East/Africa at validation stage
• For Europe, model includes train alternatives, common language, visa requirements etc.
• Ongoing development for other global route groups, including transcontinental
• Once validated, world regions can be linked to examine issues that have global impact
• E.g. changes to major hub airports with intercontinental flights
Non-calibrated R2
= 0.72
Predicted passengers
Predicted air share
Actual passengers Distance, kmWhat else can we do with the Airline Behaviour Model?
Some examples:
• Technology uptake
• Can look at what routes airlines would deploy a new technology on given technology and network
characteristics
• E.g. what design range for a hybrid electric aircraft would be most successful in a given market?
• Response to new airline entering the market
• Testing how new routes or network structures would affect airline profit
• Can be combined with new aircraft with different capabilities
• Assessing how emissions respond to policies that are applied differently across
airlines (e.g. by nationality)
• Assessing ideal location for a new hub airport (in terms of CO2, airline profit, and/or
local emissions/noise)Any questions? More information: www.atslab.org
Appendix: how does/could this interact with ATM?
• Currently both models use a highly aggregate representation of the ATM
  system
   •   Track extension factors to account for distance flown beyond great circle
   •   Non-lateral inefficiency factor to account for vertical/speed-related extra fuel use
   •   Improvements in operational efficiency then reduce these factors
   •   Runway capacity (rather than airspace, terminal, etc.) is assumed to be the main
       capacity bottleneck
• Potential exists to add more detailed airspace modelling
   •   E.g. could look at/project demand by airspace sector and how this responds to
       different policies
   •   Would require time/data, however
Appendix: how does/could this interact with ATM?
• Also potential to look in more
detail at aggregate benefits from
ATM improvements
• Applying these to AIM allows
second-order impacts to be
estimated, e.g. :
• Reduced fuel use -> reduced
airline operating costs ->
lower ticket prices -> higher
demand
• Change in fuel, carbon and
enroute costs -> change in
technology choice
[Data: ATA and Ellondee report for CCC/DfT, 2018]You can also read


