A discrete choice model of voters' decision in the general election 2019 using LASSO regression
←
→
Page content transcription
If your browser does not render page correctly, please read the page content below

IOP Conference Series: Materials Science and Engineering

PAPER • OPEN ACCESS

A discrete choice model of voters’ decision in the general election 2019
using LASSO regression
To cite this article: D Irvani et al 2021 IOP Conf. Ser.: Mater. Sci. Eng. 1115 012061

View the article online for updates and enhancements.

                                This content was downloaded from IP address 46.4.80.155 on 15/09/2021 at 20:18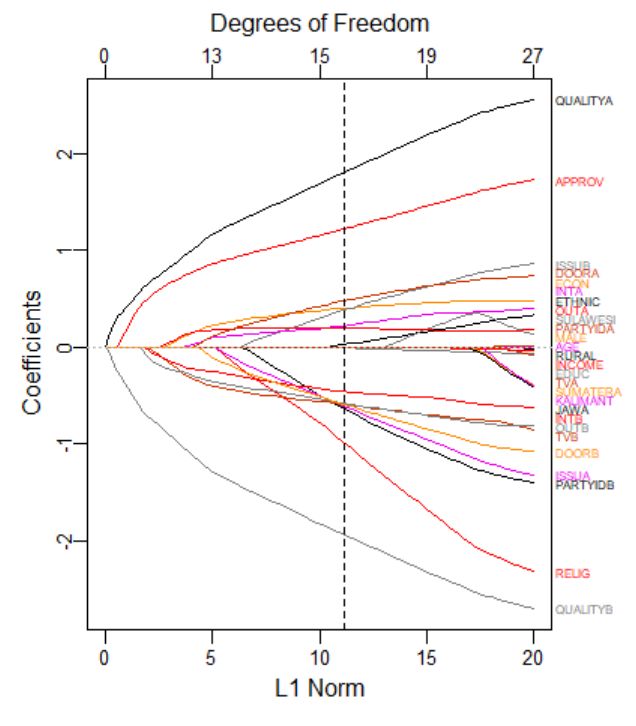
ICSTEIR 2020                                                                                                             IOP Publishing
IOP Conf. Series: Materials Science and Engineering               1115 (2021) 012061          doi:10.1088/1757-899X/1115/1/012061

A discrete choice model of voters' decision in the general
election 2019 using LASSO regression

                     D Irvani1,2, K A Notodiputro2, * and B Sartono2
                     1
                         Saiful Mujani Research and Consulting (SMRC), Jakarta, Indonesia
                     2
                         Departement of Statistics, Institut Pertanian Bogor (IPB), Bogor, Indonesia

                     *Email: khairil@apps.ipb.ac.id

                     Abstract. Statistical modelling faces problems when too many variables are involved in the
                     model. Using all variables in the model will result in overfitting which in turn produces
                     unstable predictions. LASSO (Least Absolute Shrinkage and Selection Operator) is a method
                     that can be used to overcome this problem. LASSO selects more important variables with the
                     goal of improving the prediction accuracy and interpretability. This paper identifies factors
                     those influenced voters in 2019 presidential election using LASSO penalized logistic
                     regression. This logistic model is also known as a discrete choice model. The data used in this
                     study is the result of an exit poll conducted during the election day with a total sample of 2,289
                     respondents. The response variable in this study is a vote choice. The independent variables
                     include sociological, psychological, political economy, and campaign variables. The results
                     showed that there were 17 of 27 variables having nonzero coefficients. These variables include
                     candidates’ personal qualities which show the largest effect, followed by the incumbent
                     performance variable. On the other hand, variables such as religion, education, and ethnicity
                     have much less effects. This implies that the psychological and political economy factors
                     played more important role than the sociological factor in determining voters’ decision. Based
                     on this finding the prospective candidate in the future election should focus their campaign
                     strategy on enhancing positive images (empathy, integrity and capability) as well as offering
                     better programs to convince voters.

1. Introduction
Statistical modeling faces problems when too many variables are involved in the model. Using all
variables in the model will result in overfitting which in turn produces unstable predictions. LASSO
(Least Absolute Shrinkage and Selection Operator) is a method that can be used to overcome this
problem.
    LASSO was introduced by Tibshirani [1] as a method for shrinking coefficients and selecting more
important variables with the goal of improving the prediction accuracy and interpretability. In least
squares method LASSO shrinks the coefficients                           (              ) toward zero according to a penalty
  ∑      | | in the objective function                  (     )        *    ∑      (                    )         ∑     | |+,            ,
which is equivalent to      (  )    * ∑ (                   ) + subject to ∑ | |      ,       .
While in logistic regression LASSO shrinks the coefficients toward zero based on the objective

              Content from this work may be used under the terms of the Creative Commons Attribution 3.0 licence. Any further distribution
              of this work must maintain attribution to the author(s) and the title of the work, journal citation and DOI.
Published under licence by IOP Publishing Ltd                          1
ICSTEIR 2020                                                                                                       IOP Publishing
IOP Conf. Series: Materials Science and Engineering                 1115 (2021) 012061        doi:10.1088/1757-899X/1115/1/012061

function                        *      ∑        , (             )          (             )-      ∑    | |+ [2]. The LASSO
               (       )
coefficients can be obtained using coordinate descent algorithm [3].
   LASSO has been applied in a number of previous studies. Kristensen et al. (2017) applied a
LASSO-penalized multinomial logit model to predict party choice [4]. Cantoni and Pons (2019) used
LASSO to select more important variables associated with voter turnout [5]. Meanwhile, Chen et al.
(2019) applied LASSO to identify factors associated with tuberculosis in West Java [6].
   This paper identifies factors that influence voters in 2019 presidential election using LASSO
penalized logistic regression. This logistic model is also known as a discrete choice model.

2. Research Method

2.1. Data

The data used in this study is the result of an exit poll conducted during the election day with a total
sample of 2,289 respondents. The response variable in this study is a vote choice (1 = Candidate A, 0
= Candidate B). The independent variables include sociological, psychological, political economy, and
campaign variables, those are 27 variables in total. Overall, the independent variables used in this
study are explained in Appendix.

2.2. Data Analysis

The data analysis in this study is divided into 3 parts:
   a. Descriptive analysis to describe the relationships between the response variable and each
        independent variable.
   b. 10-fold cross validation 10-folds cross-validation to determine the optimum hyperparameter
        (     ). This cross-validation is as follows. The dataset is divided at random into 10 groups
        (              ), where one group is fixed as the test set and the remaining 9 groups are
        designated as the training set. LASSO logistic regression with a value of λ is applied to the
        training set (9 groups beside the th group) then the model is used to calculate the deviance of
                                            ( )
        the testing set (the th group)               {∑      [       ̃ (         ) (       ̃ )]}, where
                                ( )
                           (̃          ̃ ( ))
           ̃                    ̃( )       ̃ ( ) )]
                                                      is the predicted probability for observation          in the testing set,
                   [        (
          ̃ ( ) and ̃ ( ) are the LASSO coefficients based on the training set, and      is the number of
         observations in the testing set. This procedure is repeated 10 times using different testing and
                                                                          ( )     ( )
         training sets to obtain deviances for each testing set (                     ), and the model
                                                               ( )
         performance is measured by CV-                ∑           . This cross validation is repeated for
         different         values. The                  is determined by a criterion

         {                                                          where                is the number of variables having
        nonzero coefficients based on a ,         is the value of which produces the minimum CV-
              (CV-          ), and      is the largest value of which produces CV-         within 1
        standard error of CV-        .
     c. Estimate the LASSO panelized logit regression model by using the full dataset and the      .
        This final model performance is assessed by the fraction of deviance explained
                    , where          is the deviance with a constant model (mean),
              ( ̃ ̃ ) is the deviance of the model using ( ̃ ̃ ), and ( ̃ ̃ ) are the LASSO

                                                                       2
ICSTEIR 2020 IOP Publishing
IOP Conf. Series: Materials Science and Engineering 1115 (2021) 012061 doi:10.1088/1757-899X/1115/1/012061
coefficients estimates. The standard error of each coefficient is estimated using bootstrap
method with 1000 replications [2], [7].
The LASSO coefficients estimates are calculated using glmnet package in R [3].
3. Results and Discussion
3.1. Descriptive Analysis
Support for a candidate appeared to vary according to values of the independent variables. In terms of
demographics, differences in support can be seen especially in terms of religion, ethnicity, education
and region. Candidate A tended to get a bigger support from the non-Muslim voters, Javanese, voters
with lower education, and voters who live in areas outside Sumatera. Candidate A also seemed to have
greater support from voters who assessed economic condition as better and voters who were satisfied
with the incumbent performance. Party identification and candidates’ personal qualities appeared to
have positive relationships with the electability of the candidates concerned, whereas belief in negative
issues had negative relationship with the electability. Voters who were more exposed to candidate's
campaign in various media appeared to be more supportive of the candidate (Figure 1).
Figure 1. Proportion of support for Candidate A (vertical axis) according to explanatory variables
(horizontal axis).
3ICSTEIR 2020 IOP Publishing
IOP Conf. Series: Materials Science and Engineering 1115 (2021) 012061 doi:10.1088/1757-899X/1115/1/012061
3.2. Cross-Validation and Optimum-
The cross-validation analysis showed that resulted in a CV- of 0.3184, while
resulted in CV- of 0.3362. The LASSO logistic regression with shrinks
the coefficients of 7 independent variables to zero, while shrinks the coefficients of 10
independent variables to zero (Figure 2a). Since using shrinks more coefficients to zero than
then is chosen as the optimum-λ.
(a) (b)
Figure 2. (a) 10-folds cross-validation, the vertical dash lines are the locations of and ;
(b) The coefficient path for LASSO penalized logistic regression with all data, plotted versus the
-norm of the coefficient vector relative to the -norm of the unrestricted estimate, the vertical
dash line is the location of -norm corresponding to
3.3. LASSO Penalized Logistic Regression Model
The LASSO logistic regression model by using the full dataset and the optimum-λ resulted in a
deviance ratio of , which means that the model has a fairly good performance. This model
shrinks 10 variable coefficients to zero: MALE, RURAL, AGE, INCOME, SUMATERA, JAVA,
KALIMANTAN, SULAWESI, PARTYIDA, and TVA. This shows that gender, rural-urban, income,
region, closeness to parties those supported Candidate A, and Candidate A’s TV commercial exposure
were not important factors in determining the vote choice. Then the explanation for voting behavior
can be focused more on the remaining 17 variables (Table 1).
The plot of coefficient paths visualizes the most to the least important variable (Figure 2b). By
observing each coefficient path from left to right, it can be seen how each variable appears as nonzero
(having nonzero coefficient) as the budget increases, or as the hyperparameter decreases (the value
of λ is getting smaller as it moves to the right).
If we use a very large penalty then all variables having zero coefficients. When the penalty is
reduced slightly, QUALITYA (Candidate A's personal quality) and QUALITYB (Candidate B's
personal quality) appear almost simultaneously as nonzero. If the penalty is reduced again then
APPROV variable (the incumbent performance) becomes nonzero. Furthermore, the gradual
decreasing of the value of hyperparameter until makes the following variables appear as
4ICSTEIR 2020 IOP Publishing
IOP Conf. Series: Materials Science and Engineering 1115 (2021) 012061 doi:10.1088/1757-899X/1115/1/012061
nonzero in sequence: OUTB, INTB, TVB, OUTA, ECON, INTA, DOORA, DOORB, RELIGION,
ISSUA, PARTYIDB, ISSUB, EDUC, ETHNIC.
Candidates’ personal qualities were the most important variables, followed by the incumbent
performance. Meanwhile, ethnicity had the lowest effect. In general, this study confirms the results of
previous studies that voting behavior can be explained through psychological, political economy, and
sociological approaches [8]. In addition, this study also confirms previous research that campaign and
disinformation are also factors that can influence voting behavior [9-10].
Table 1. LASSO-Penalized Logistic Regression Model
Standard
Coefficient Error Z P(>|Z|) Odds Ratio
(Intercept) 0.490 0.837 0.59 0.558 -
MALE - - - - -
RURAL - - - - -
AGE - - - - -
EDUC -0.002 0.011 -0.20 0.840 1.0
INCOME - - - - -
ETHNIC 0.009 0.086 0.10 0.921 1.0
RELIG -0.900 0.245 -3.68 0.000 0.4
SUMATERA - - - - -
JAWA - - - - -
KALIMANTAN - - - - -
SULAWESI - - - - -
ECON 0.393 0.149 2.63 0.008 1.5
APPROV 1.196 0.200 5.99 0.000 3.3
PARTYIDA - - - - -
PARTYIDB -0.582 0.279 -2.09 0.037 0.6
QUALITYA 1.766 0.135 13.08 0.000 5.8
QUALITYB -1.897 0.124 -15.36 0.000 0.2
ISSUA -0.563 0.170 -3.31 0.001 0.6
ISSUB 0.354 0.185 1.92 0.055 1.4
TVA - - - - -
TVB -0.579 0.180 -3.21 0.001 0.6
INTA 0.208 0.150 1.38 0.167 1.2
INTB -0.452 0.193 -2.34 0.019 0.6
OUTA 0.202 0.171 1.18 0.237 1.2
OUTB -0.568 0.220 -2.58 0.010 0.6
DOORA 0.456 0.185 2.47 0.013 1.6
DOORB -0.562 0.237 -2.37 0.018 0.6
3.3.1. Psychological Factor
Within the psychological variables, PARTYIDA having zero coefficient. The closeness of the voters
to parties those supported Candidate A (compared to not closed to any party) didn’t seem to have an
important role in the choice. However, this doesn’t mean that party identification is not important at
all. The model shows that the closeness of the voters to the parties those supported Candidate B
5ICSTEIR 2020 IOP Publishing
IOP Conf. Series: Materials Science and Engineering 1115 (2021) 012061 doi:10.1088/1757-899X/1115/1/012061
reduced the tendency to vote for Candidate A, and this effect is significant at 95% confidence level.
Party identification, however, remains important despite its limited influence.
The most important psychological variable is Candidates’ personal qualities. Every addition of 1
point of score on the assessment of Candidate A’s personal quality increased 5.8 times the odds for
choosing Candidate A. Conversely, every addition of 1 point of score on Candidate B’s personal
quality decreased the odds of choosing Candidate A by 0.2 times.
Negative issues regarding candidates contributed to voters’ decision. The more voters were
exposed to and believe in negative issues about a candidate, the lower the chance of the voters
choosing the candidate. Considering that some of the negative issues during the campaign period were
a form of disinformation or hoaxes, this finding needs to be of concern to various parties. Voters'
political decisions should be made based on correct information. The spread of fake news during
campaign period would ultimately reduce the quality of election.
3.3.2. Political Economy Factor
Evaluation on the economic condition and incumbent performance have positive coefficients. This
shows that voters are basically rational. Voters who were satisfied with the incumbent performance
and thought that the economic condition was better than the last year had a tendency to prefer
Candidate A (as the incumbent) over voters who had the opposite opinion. The relative tendency to
vote for Candidate A among voters who were satisfied with the incumbent performance was 3.3 times
greater than among those who were dissatisfied. Meanwhile, voters who considered the economic
condition was better than before tended to be more likely to vote for Candidate A 1.5 times greater
than voters who thought otherwise.
3.3.3. Sociological Factor
The sociological variables those having nonzero coefficients are religion, education, and ethnicity.
Religion and education have negative coefficients while ethnicity has a positive coefficient. However,
the effects of education and ethnicity less convincing, not significant at 95% confidence level. The
more convincing sociological variable is religion. The tendency of voting for Candidate A (versus
Candidate B) among Muslim voters is 0.4 times (lower) than that of non-Muslim voters. The influence
of religion on the choice is interesting, since Candidate A and Candidate B have the same religious
background (Islam). Muslim voters might think Candidate A was less representative of their interests,
whereas non-Muslim voters thought Candidate A was more representative of their aspirations.
3.3.4. Campaign Factor
Campaigns played important role in voting. Candidate B's campaign appeared to have stronger
influence than Candidate A's campaign. The effect of Candidate A's campaign through TV
commercials has even shrunk to zero. This might be related to the different position of the two
candidates: Candidate A as the incumbent and Candidate B as the challenger. Most voters probably
already knew and could evaluate Candidate A's programs during his 5 years in office. Therefore, the
campaign conducted by Candidate A during the campaign period had no significant effect. At 95%
confidence level, only campaigns through volunteers’ visits could increase Candidate A's electability.
Unlike Candidate A, voters generally only knew about Candidate B's program when they
entered the campaign period. Therefore, the campaign conducted by Candidate B played an
important role in providing information and encouraging voters to vote. All campaign forms
conducted by Candidate B had significant effects. Voters who were more exposed to any
forms of Candidate B's campaign lowered the tendency to vote for Candidate A to 0.6 times
compared to voters who had never been exposed to any candidate campaign.
6ICSTEIR 2020 IOP Publishing
IOP Conf. Series: Materials Science and Engineering 1115 (2021) 012061 doi:10.1088/1757-899X/1115/1/012061
4. Conclusion
The LASSO penalized logistic regression model with a λ-optimum in this study has a ratio of deviance
of . Based on this model, there were 17 of the 27 variables having nonzero coefficients.
These variables were candidate’s personal qualities (QUALITYA and QUALITYB), incumbent
performance (APPROV), campaigns through TV commercials (TVB), campaigns through
advertisements on the internet or social media (INTA and INTB), campaigns through outdoor media
(OUTA and OUTB), campaigns through volunteers’ visits (DOORA and DOORB), economic
condition (ECON), negative issues about candidates (ISSUA and ISSUB), religion (RELIG),
education (EDUC), and ethnicity (ETHNIC).
Candidates’ personal qualities show the largest effect, followed by the incumbent performance
variable. On the other hand, variables such as religion, education, and ethnicity have much less effects.
This implies that the psychological and political economy factors played more important role than the
sociological factor in determining voters’ decision. Based on this finding the prospective candidate in
the future election should focus their campaign strategy on enhancing positive images (empathy,
integrity and capability) as well as offering better programs to convince voters.
Acknowledgments
The authors would like to thank SMRC, IPB University, and all persons who contributed to the
improvement of this paper: Muhlis Ardiansyah, Etis Sunandi, Asep Rusyana, Alona Dwinata, Embay
Rohaeti.
References
[1] Tibshirani R 1996 Regression shrinkage and selection via the LASSO Journal of the Royal
Statistical Society, Series B (Methodological) 58 (1) 267-288
[2] Hastie T, Tibshirani R, Wainwright M 2016 Statistical Learning with Sparsity Florida: CRC Press
[3] Friedman J, Hastie T, Tibshirani R 2010 Regularization Paths for Generalized Linear Models via
Coordinate Descent Journal of Statistical Software 33 (1) 1-22
[4] Kristensen J B, Albrechtsen T, Dahl-Nielsen E, Jensen M, Skovrind M, Bornakke T 2017
Parsimonious data: How a single Facebook like predicts voting behavior in multiparty
systems PLoS ONE 12 (9) e0184562
[5] Cantoni E, Pons V 2019 Does Context Trump Individual Drivers of Voting Behavior? Evidence
from U.S. Movers Harvard Business School Working Paper 19-25
[6] Chen S, Notodiputro K A, Rahardiantoro S 2019 Penerapan Analisis LASSO dan Group LASSO
dalam Mengidentifikasi Faktor-faktor yang Berhubungan dengan Tuberkulosis di Jawa Barat
Indonesian Journal of Statistics and Its Applications 4 (1) 39-54
[7] Efron B, Tibshirani R 1993 An Introduction to the Bootstrap London: Chapman & Hall
[8] Mujani S, Liddle R W, Ambardi K 2018 Voting behavior in Indonesia since democratization:
critical democrats Cambrige: Cambridge University Press
[9] Peterson D A M 2009 Campaign Learning and Vote Determinant American Journal of Political
Science 53 (2) 445-460
[10] Zimmermann F, Kohring M 2019 Mistrust, Disinforming News, and Vote Choice: A Panel
Survey on the Origins and Consequences of Believing Disinformation in the 2017 German
Parliamentary Election Political Communication 37 (2) 215-237
7ICSTEIR 2020 IOP Publishing
IOP Conf. Series: Materials Science and Engineering 1115 (2021) 012061 doi:10.1088/1757-899X/1115/1/012061
Appendix. Independent Variables and The Explanation.
1. Gender (MALE): 1 = male, 0 = female.
2. Rural-Urban (RURAL): 1 = rural, 0 = urban.
3. Age in years (AGE).
4. Education: length of schooling in years (EDUC).
5. Income per month in million rupiahs (INCOME).
6. Ethnicity (ETHNIC): 1 = Javanese, 0 = others.
7. Religion (RELIG): 1 = Islam, 0 = others.
8. Region, represented by the four dummy variables:
Dummy Variables
Region
SUMATERA JAVA KALIMATAN SULAWESI
Sumatera 1 0 0 0
Java 0 1 0 0
Kalimantan 0 0 1 0
Sulawesi 0 0 0 1
Others 0 0 0 0
9. Evaluation of current national economic condition compared to last year (ECON): 1 = better,
0 = worse or no change.
10. Satisfaction with the incumbent’s performance (APPROV): 1 = satisfied, 0 = dissatisfied.
11. Identity of party A (PARTYIDA): 1 = feeling closer to the party that supports Candidate A, 0
= does not feel close to the party that supports Candidate A.
12. Identity of party B (PARTYIDB): 1 = feeling closer to the party that supports Candidate B, 0
= does not feel close to the party that supports Candidate B.
13. Assessment of the personal quality of candidate A (QUALITYA): a composite index of three
items on the quality of Candidate A, (1) attentive/care for the people, (2) able to lead in
overcoming national problems, (3) trustworthiness; where each item is measured on a 5-point
scale (1 = very inattentive/unable to lead/untrustworthy, 5 = very attentive/able to
lead/trustworthy). The three items are averaged to form a score on a scale of 1-5, where 1
means very bad and 5 means very good.
14. Assessment of the personal quality of Candidate B (QUALITYB): a composite index of three
items on the quality of Candidate B: (1) attentive/care for the people, (2) able to lead in
overcoming national problems, (3) trustworthiness; where each item is measured on a 5-point
scale (1 = very inattentive/unable to lead/untrustworthy, 5 = very attentive/able to
lead/trustworthy). The three items are averaged to form a score on a scale of 1-5, where 1
means very bad and 5 means very good.
15. Attitudes towards negative issues for Candidate A (ISSUA): a combined index of four
negative issue items for Candidate A: (1) related to PKI, (2) an accomplice to PRC, (3) anti-
Islam, (4) authoritarian; where each item is measured on a 3-point scale (1 = don't believe, 2 =
never heard of, 3 = believe). The four items are averaged to form a score on a scale of 1-3,
where 1 means do not believe in all issues and 3 means believe with all issues.
16. Attitudes towards negative issues for Candidate B (ISSUB: a composite index of four negative
issue items for Candidate B: (1) Christian/Catholic family, (2) involved in activist kidnapping
events, (3) fired from the army, (4) temperamental/has mental instability; where each item is
measured on a 3-point scale (1 = don't believe, 2 = never heard of, 3 = believe). The four items
are averaged to form a score on a scale of 1-3, where 1 means don't believe in all issues and 3
means believe in all issues.
17. Candidate advertisements that are seen more frequently on TV, which are represented by two
dummy variables with the reference category “balanced/never seen”:
Candidate ads that are seen more frequently on TV Dummy Variables
TVA TVB
Ads of Candidate A 1 0
8ICSTEIR 2020 IOP Publishing
IOP Conf. Series: Materials Science and Engineering 1115 (2021) 012061 doi:10.1088/1757-899X/1115/1/012061
Ads of Candidate B 0 1
Balanced/Never seen 0 0
18. Candidate advertisements that are seen more frequently on internet or social media, which are
represented by two dummy variables with the reference category “balanced/never seen”:
Candidate ads that are seen more frequently on internet Dummy Variables
INTA INTB
Ads of Candidate A 1 0
Ads of Candidate B 0 1
Balanced/Never seen 0 0
19. Candidate advertisements that are seen more frequently on outdoor media (banners, stickers,
flags, etc.), represented by two dummy variables with the reference category “balanced/never
seen”:
Candidate advertisements that are seen more frequently on Dummy Variables
outdoor media (banners, stickers, flags, etc.) OUTA OUTB
Outdoor Media of Candidate A 1 0
Outdoor Media of Candidate B 0 1
Balanced/Never seen 0 0
20. The candidate's campaign team that visited the most frequently, represented by two dummy
variables with the reference category “balanced/none”:
The candidate's campaign team that visited the most frequently Dummy Variables
DOORA DOORB
Campaign team of Candidate A 1 0
Campaign team of Candidate B 0 1
Balanced/None 0 0
9You can also read