Roadshow to Paris 24 April 2018 - The Navigator Company
←
→
Page content transcription
If your browser does not render page correctly, please read the page content below
Roadshow to Paris 24 April 2018
Disclaimer

    This presentation is intended to provide a general overview of The Navigator Company S.A.’s
    business and does not purport to deal with all aspects and details regarding The Navigator
    Company S.A.. Accordingly, no representation, undertaking or warranty, expressed or
    implied, is given by The Navigator Company S.A. or any of its subsidiaries’ undertakings,
    affiliates, directors, officers, employees or advisors or any other person as to the fairness,
    accuracy, completeness or correctness of the information or opinions contained in this
    presentation or of the views given or implied or any other material discussion in connection
    with this presentation.

    This presentation has been prepared by The Navigator Company S.A. for information
    purposes only. The Navigator Company S.A. or any of its affiliates, directors, officers,
    employees or advisers or any other person shall not have any liability whatsoever (including
    in case of omission, negligence or otherwise) for any losses, errors or omissions howsoever
    arising, directly or indirectly, from any use of this presentation or its contents or otherwise
    arising in connection therewith or with respect to their reliance upon the completeness and
    accuracy of any such information, as well as any damages resulting hereof.

                                                                                                      1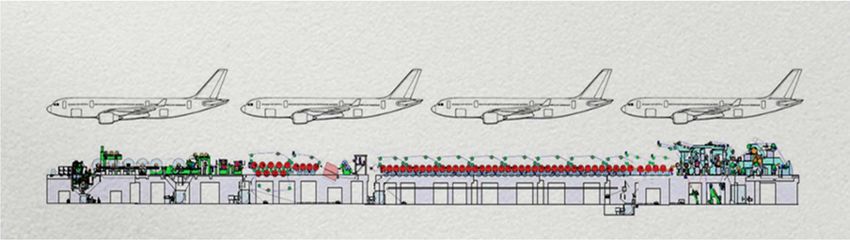
Table of contents

   1. Overview

   2. Market update

   3. Development

   4. Appendix – Key data

                            2
The Navigator Company – an integrated
  producer

       70,000 ton                             Leader in
        Reels +                              Eucalyptus
       65,000 ton        Tissue   R&D         globulus
       Converting                              cloning

                                                       112,000
   1.6 M ton                                             ha of
    of UWF       Paper                   Forest         forest
     paper                                              under
                                                      management

                                             1.5 M ton
          2.5 TWh                             of BEKP
             of          Energy   Pulp          pulp
         electricity                           (0.3 M
                                             market pulp)

                                                                   3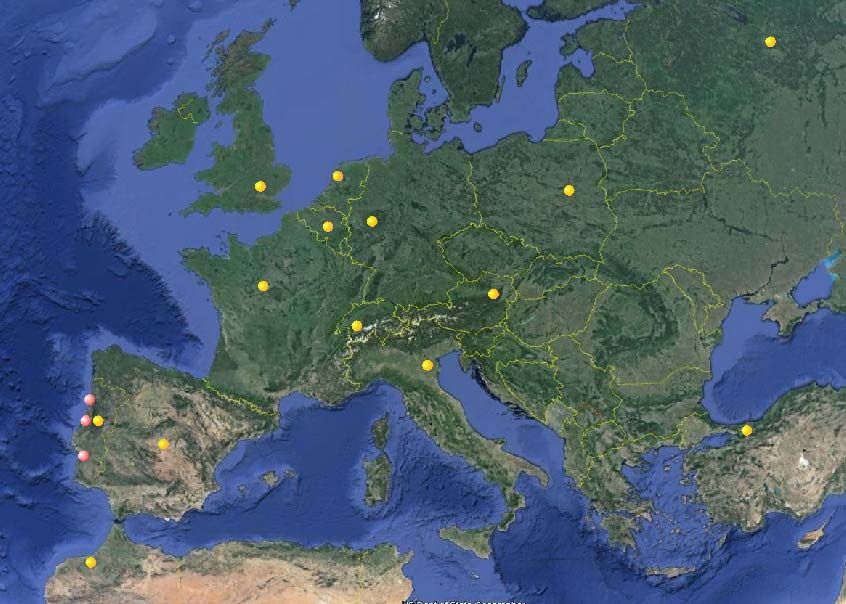
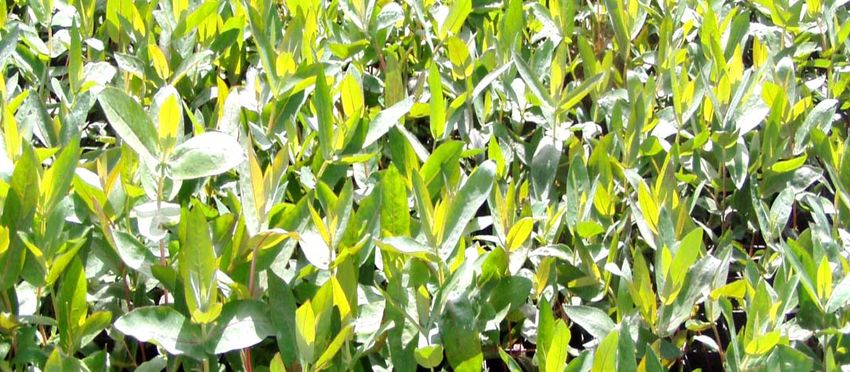
Starting with the forest, a natural and
  renewable resource

   Navigator has the largest certified forest nurseries in Europe
   with capacity to produce 12 million plants/year.

                                      RENOVATION

                    Around 3,000 ha are planted annually by Navigator

  BIODIVERSITY                                                           PROTECTION

       Forest                                                             € 3 million
   management                                                           invested/year in
     reconciles                                                          the prevention
  production with                                                        and support in
      species                                                           combating forest
  conservation                                                                fires

                                     CERTIFICATION

             Certified forest under:
             - Forest Stewardship Council (FSC)
             - Programme for the Endorsement of Forest Certification (PEFC)
                                                                                     4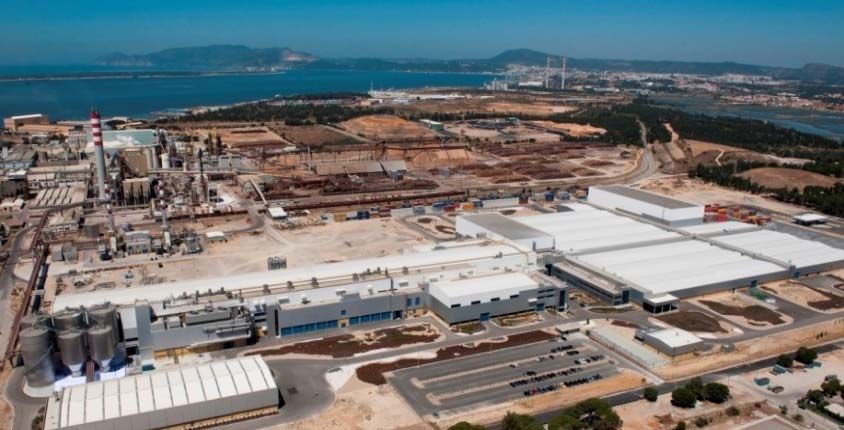
Aiming to become a carbon free company

  Under the Paris Protocol and the National Roadmap for Carbon Neutrality,
  The Navigator Company undertakes, until 2035, to implement changes
  in its production processes in order to minimize the use of fossil fuels.

                                 GOAL 1                   GOAL 2
                                 100% of electrical       Reduce fossil fuel
                                 energy production        CO2     emissions
                                 from    renewable        with replacement
                                 sources                  of technologies

                                 GOAL 3                   GOAL 4
                                 Reduce 15% of            Carbon offsetting
                                 specific   energy        for  unavoidable
                                 consumption until        carbon emissions
                                 2025, with 2015
                                 as reference year

                                                                               5
Based on large scale production mills,
  with state-of-the-art technology

                                     The Navigator
      CACIA                             Company                        FIGUEIRA DA FOZ
      Pulp (Market) – 350,000 tAD       operates 4        Pulp (Integrated) – 580,000 tAD
                                    industrial units on               Paper – 790,000 ton
                                     an international
                                       scale, using
                                      sophisticated
                                       technology

      VILA VELHA DE RÓDÃO                                                       SETÚBAL
      Tissue – 70,000 ton +                               Pulp (Integrated) – 550,000 tAD
      65,000 ton converting                                           Paper – 775,000 ton
                                                                                            6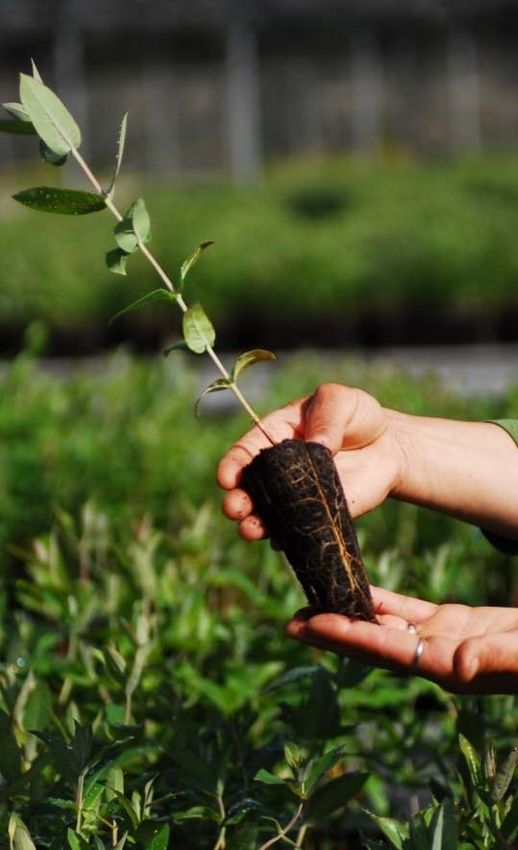
PM4 – largest UWF machine in the World

             Paper machine PM4 - Equal in size to 4 Airbus A330s

            A330                     A330                         A330                   A330

   Winder                                                                               Presses   Forming
             Reeler   Calender   After-Dryer   Surface Sizing     Pre-Dryer
                                                                                        OptiDry     Area

       Manufacturer: Metso (Finland)
                                                                The most recent Paper Machine
       Machine length: 200 m                                    produces sheets more than 515 m
       Sheet width at forming: 11.1 m                           long and 10.4 m wide, at a speed of
       Width at reeler: 10.4 m                                  30 m per second, and a thickness of
                                                                1/10 mm. It produces roughly 80
       Maximum speed: 1,800 m/min                               tons of paper/hour.
       Started up: August 2009

                                                                                                            7
And commercial subsidiaries, sales offices,
R&D units and nurseries all over the World

                                                                                                                                  Moscow

Capitola                     Norwalk
           Dallas

    Mexico City                                                                      Amsterdam
                                                                         London                                Warsaw

                                                                                            Cologne

                                                                            Paris                     Vienna

                                                                                  Geneva
                                                                                            Verona
                                                      Cacia                                                                    Istanbul
                                                   Figueira   Vila Velha do Rodão
                                   Subsidiaries
                                                   Setúbal      Madrid
                                 S.Sales
                                    Paulooffices
                       Dubai
                                  Mills
                                  R&D Units and
                                  Nurseries              Casablanca

                               Industrial Sites and European Subsidiaries: Amsterdam, Cacia, Cologne, Figueira da Foz, Geneva London,
           Luá-Gurué           Madrid, Moscow, Paris, Setúbal, Verona, Vila Velha do Rodão, Vienna, and Warsaw USA: Capitola, Dallas,
                               Mexico City and Norwalk Asia: Dubai and Istanbul Africa: Casablanca, Maputo and Luá-Gurué
                    Maputo     R&D Units and Nurseries: RAIZ, Caniceira Nurseries, Espirra Nurseries and Ferreiras Nurseries
                               Business Areas: Research & Development, Agro-Forestry, Pulp Production and Sales, Paper Production and
                               Sales, Tissue Production and Sales and Energy
                                                                                                                                  8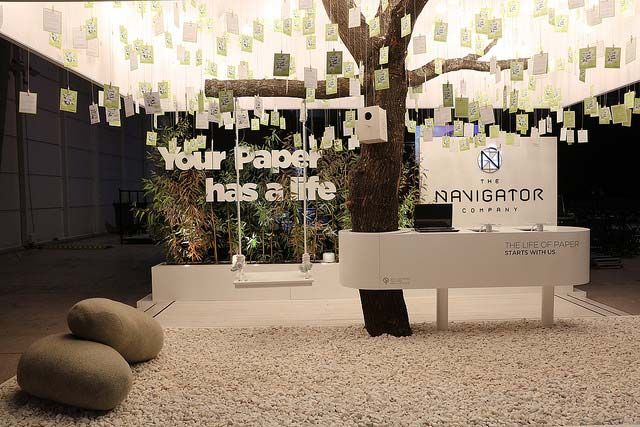
With global sales to 130 different countries

   Market pulp and paper sales accounted for over 83% of the Group’s
   revenues, which are distributed to a diversified customer base.

     Revenues by division – 2017*                                   Revenues by geography – 2017**
                                                                                             Rest of
                                                                                              the
                      Energy Other                                                    US     World
               Tissue  10%    2%                                                      9%       5%    Portugal
                 5%                                                      Middle                        5%
        Pulp                                                              East
       stand                                                              10%
       alone
                                                                      Africa                                Rest of
        10%
                                                                       12%                                  Europe
                                                                                                             59%
       Paper
        73%

               The Group exports around 95% of pulp and paper sales

                 *Other sales include Pellets, directed at Europe; all energy sales are in Portugal
                 **Revenues by geography of pulp and paper
                                                                                                                      9
Navigator is the leading manufacturer of
UWF paper in Europe
Nº1 in European UWF fine paper by capacity, with the largest and most
modern mills.
European uncoated fine paper* Uncoated woodfree (UWF) European mills
Main players
The
Navigator
Company
Other 19%
31%
Mondi
16%
UPM
10% IP
Stora Enso 12%
12%
*Excluding value-added products (ex.:
carbonless papers, termal papers, colorful
papers, engineering papers, specialty
papers, etc)
Source: RISI; The Navigator Company
10And a very efficient cost structure in paper
One of Europe’s most efficient paper producers, with cash cost per ton on the
left side of the industry cost curve. Approximately 25% of the industry capacity
is non-integrated.
Estimated cash production costs, delivered to Germany (€/ton)
€/ton (Q3 2017 with pulp prices adjusted to Jan. 2018)
Source: RISI; Fisher International; The Navigator Company information Q4 2017
11With a product differentiation strategy
base on quality and own brands
Product and brand differentiation strategy have skewed the Group’s product
mix to the high end market, allowing up to 7% price premium advantage.
The Navigator Company market share
in Western Europe – 2017
The Europe
Navigator industry
Company average* Premium ~50%
Premium
49% 14%
products
Cut-size 23%
Mill Brands 62% 20% Folio 21%
Reels 11%
Sheets 75% 69%
Operating Total
100% 92% 19%
rates
*Estimated industry average including Navigator
Source: The Navigator Company information FY 2017; Euro-Graph
12Comparing very favourably with its peers
EBITDA Margin - Paper Peers (2015-2017)
Average for 2015-2017*: 17%
24,7%
25,2%
24,0%
17,1% 16,3% 15,8% 16,5%
17,6%
11,0% 15,3% 15,9% 16,0%
14,7%
13,5% 13,3% 13,5%
13,5%
11,8%
The Navigator Competitor 1 Competitor 2 Competitor 3 Competitor 4 Competitor 5
Company
2015 2016 2017
*Average includes Navigator; average without Navigator is 15%
13Quarterly Financials 2015
And recording consistent strong key
financials
Sales (M€) EBITDA (M€)
1.628 1.637
1.577 385 390 397 404
1.531 1.542 351 328
1.502
2012 2013 2014 2015 2016 2017 2012 2013 2014 2015 2016 2017
EBITDA/Sales (%) ROCE (%)
26% 25% 25%
23% 24%
21%
15% 16%
13% 14%
12% 12%
2012 2013 2014 2015 2016 2017 2012 2013 2014 2015 2016 2017
14Table of contents
1. Overview
2. Market update
3. Development
4. Appendix – Key data
15UWF global stable demand in 2018
According to PPPC, in the first 2 months of the year, worldwide demand for UWF remained
stable, while the overall praphical papers contracted -0.8% YoY (exc. Newsprint).
Feb. 2018 14.0 6.8 3.6 1.8 1.9
M ton
200
YoY
kton 150
100
50
+0.0% +0.1%
0
‐50 ‐1.7%
‐100 ‐2.5%
‐0.8%
‐150
‐200
Total Uncoated Coated Uncoated Coated
49 %
Woodfree Woodfree Mechanical
Inc. SuperCalendered
Mechanical
Share UWF
On world P&W paper
demand (exc. Newsprint)
Source: PPPC; The Navigator Company 16Evolution of UWF European apparent
consumption
CAGR for UWF consumption from 2012-2017: -1.0%
CAGR for UWF capacity from 2012-2017: -2.0%
7.0 7.0 7.0 6.9
6.6 6.7
M ton
8.3 8.2 8.2 8.1 7.7 7.5
2012 2013 2014 2015 2016 2017
Capacity Apparent Consumption
Source: Euro-Graph; EMGE; RISI
17Upward trend in paper prices in 2017 and
2018
Paper Benchmark has been gradually improving: 4 price increases during
2017 and 2 price increases already in 2018.
Price
increases:
European Market Paper Price – A4 B-copy January
€/ton and March
900 A4 B-copy
Av. YTw 15:
847 €/ton
850 (+4.1%)
Last PIX (W15):
864 €/ton
800
Av. 2016: Av. 2017:
822 €/ton 819 €/ton
(Var. W1-52: -3.5%) (Var. W1-52: +4.1%)
750
700
650
600 Week
1 5 9 13172125293337414549 1 5 9 1317212529333741454953 4 8 1216202428323640444852 4 8 1216202428323640444852 4 8 1216202428323640444852
2014 2015 2016 2017 2018
Source: FOEX
18Very positive pulp market in 2017
Source: Fibria; OKI; Brian McClay; Hawkins Wright
19Upward trend in pulp prices seems to
continue in 2018
Pulp producers have announced new price increases for April 2018.
USD/ton PIX Europe €/ton
1100 USD/ton BHKP EUR/ton BHKP 1100
Av. YTw 15:
1016 USD/ton
(+4.4%)
Av. 2017:
1000 817 USD/ton Last PIX (W15):
1000
(Var. W1-52: +51%) 1037 USD/ton
900 900
Av. YTw 15:
827 €/ton
Av. 2016: (+2.0%)
717 USD/ton
800 (Var. W1-52: -16%) Last PIX (W15): 800
841 €/ton
700 700
Av. 2017:
723 €/ton
(Var. W1-52: +33%)
600 600
Av. 2016:
673 €/ton
(Var. W1-52: -13%)
500 500
400 400
1 11 21 31 41 51 9 19 29 39 49 7 17 27 37 47 4 14 24 34 44 2 12 22 32 42 52 10 20 30 40 50
2013 2014 2015 2016 2017 Week
2018
20Pulp outlook remains positive for 2018
Pulp market should remain balanced throughout the year with supply
issues and positive impacts from substitution effects in China.
2018 Estimates
Source: Fibria; OKI; Brian McClay; Hawkins Wright 21Tissue market continues to grow
Global tissue consumption per capita (Kg)
But extra capacity in Iberia expected in the short term: around
350,000 tons extra from new paper machines like Sofidel, ICT,
Renova and Goma Camps.
Source: RISI 2016
22Global positive outlook for 2018
Tissue
+ high competition and pressure on margins due to rise in pulp price
expected to continue
Paper
+ positive outlook for UWF prices in 2018:
• PIX – A4-BCopy (EUR/ton) has increased 4.1% since the
beginning of the year
• Navigator has led 2 price increases
Exchange rate and some increase in production costs (namely
chemicals) remain the main cause for concern
23Table of contents
1. Overview
2. Market update
3. Development
4. Appendix – Key data
24Navigator corporate development –
organic growth and diversification
Group plans to invest around € 500 million in 2018-2022
Expansion capex includes:
+ tissue expansion plan (total € 120 million; € 90 million in 2018)
+ pulp expansion capacity (total € 85 million; € 45 million in 2018)
+ forest plantation in Mozambique (max. of € 10 million/year)
Annual maintenance capex kept under 3% of sales
Net Debt/EBITDA is estimated to remainTissue – strong strategic rationale to
double-down the business
Diversification of The
Navigator Company’s Synergies with our
portfolio core business
(potential to grow up to 15-20% of (raw material Eucalyptus
the Navigator’s sales in 2020- globulus)
2025)
Ability to develop a State-of-the-art
competitive advantage technology solution
with pulp integration
(The Navigator Company’s DNA)
(cost and quality advantage)
26Tissue – major steps
• Start-up of Cacia mill in Q3
2018
• Doubling of reels production • The Navigator Company total
capacity (reaching max. 60 capacity to reach 130
kton/year) and increase kton/year (reels and
converting capacity to 63 kton, converting)
improving contribution margin
2015 2016 2017 2018
• Decision to invest in Cacia
• Acquisition of AMS mill (70 kton/year of reels and
(30 kton/year reels converting): € 120 million
and 42 kton of capex
converting)
27Navigator – #2 player in tissue in Iberia
after expansion project
Estimated tissue production capacity in Iberian Peninsula (kton)
Paper
production 135 130
Finished product production (converting)
Finished
product
production
(converting)
Paper
production
Others
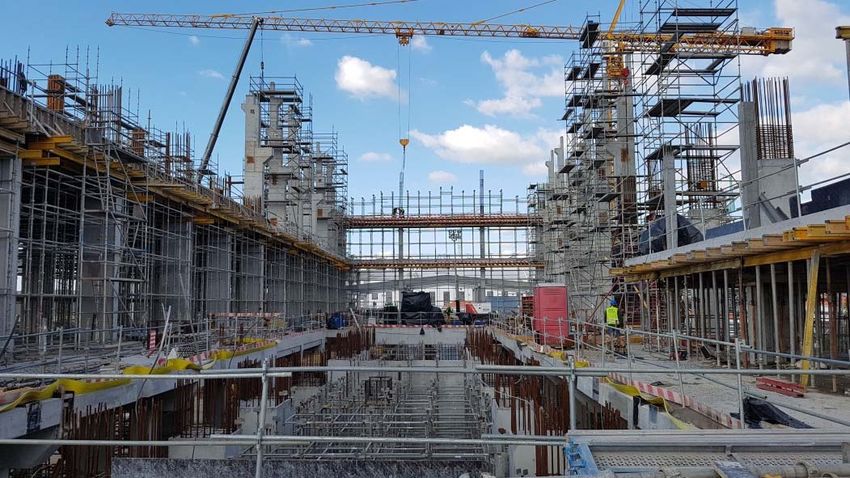
28Cacia tissue update
• Integrated tissue mill with capacity to produce 70 kton of reels and
converting products with estimated capex of € 120 million
• Main equipment suppliers have been selected and 92% of capex
already committed
• 60% of civil works executed; mechanical assemblies and piping
started, with 360 workers currently involved
• Project on time and on budget: paper machine to start up in Q3
2018
29Update on other projects
Increase pulp Mozambique project Divestment of the Pellets
production capacity business
Figueira da Foz Mozambique USA
Capex: € 85 million (50% Growth opportunity driven by Attractive opportunity to divest
commissioned) increased demand in Asia and and signed an agreement to sell
worldwide supply limitations its pellets business
From 580,000 to 650,000 tAD
Scale down rhythm of Closing of the transaction
New capacity planned to come investment and operations in occurred on Feb. 16th 2018
online in April 2018 2017 with final transaction value of
USD 135 million
Company remains engaged and
is negotiating necessary
conditions to proceed with the
project
30Table of contents
1. Overview
2. Market update
3. Development
4. Appendix – Key data
31Historical dividend payment
• Annualized total shareholder return in the last 5 years of 12.7%
• Dividend Yield of 11.3% vs 2.6% industry median
Total
Share
Dividend Ajusted amount 440,5
Year price 450 1
per dividend paid
(payment) (year 0,9
share yield (million 400
end)
Dividend payment (M €)
euros) 350 0,8
Dividend/share (€)
0.1600 0,7
2013 2.280 12.3% 201.4 300
0.1200 250,0 0,6
250
201,4 200,8 0,61 0,5
2014 0.2800 2.910 12.3% 200.8
200 170,0
0,4
0.4330 150
2015 0.0418 3.085 14% 440.5 0,35
0,3
0.1395 100 0,28 0,28 0,2
0,24
0.1590 50 0,1
2016 3.596 11.6% 170.0
0.0781 0 0
0.2371 2013 2014 2015 2016 2017
2017 3.265 10.7% 250.0
0.1116
32Financial figures and ratios for 2012-2017
Million euros 2012 2013 2014 2015 2016 2017
Total sales 1,501.6 1,530.6 1,542.3 1,628.0 1,577.4 1,636.8
EBITDA 385.4 350.5 328.4 390.0 397.4 403.8
Operating earnings (EBIT) 286.2 233.7 218.3 282.9 230.4 255.0
Financial earnings -16.3 -14.1 -34.2 -50.3 -20.8 -7.7
Net Profit 211.2 210.0 181.5 196.4 217.5 207.8
Cash Flow 310.4 326.8 291.6 303.6 384.6 356.6
Investment 30.1 16.9 50.3 148.5 138.6 114.7
Net debt 363.6 307.1 273.6 654.5 640.7 692.7
Million euros 2012 2013 2014 2015 2016 2017
EBITDA/Sales (%) 25.7% 22.9% 21.3% 24.0% 25.2% 24.7%
ROS (%) 14.1% 13.7% 11.8% 12.1% 13.8% 12.7%
ROE (%) 14.3% 14.2% 12.4% 14.7% 17.8% 17.2%
ROCE (%) 15.1% 12.9% 12.4% 15.7% 12.3% 13.6%
Equity to assets ratio (%) 54.4% 52.5% 53.7% 50.0% 51.2% 48.6%
Net debt/EBITDA 0.9 0.9 0.8 1.7 1.6 1.7
33Debt profile continues to improve
The successful restructuring of the Group´s debt in 2015
and 2016 resulted in a longer maturity and a lower cost of
debt, as well as an increased diversification of
counterparties. • Standard
BB
& Poors
Current
Credit
Current Average Cost of Debt 1.60% Stable outlook
Profile
Ba2 • Moody´s
Debt maturity profile (M€)
Total debt: € 851 million 363 227
Average maturity: 3.6 years 210
66
20 12 10 20
34Navigator continuing focus on cost
reduction – M2 program
• M2 cost reduction and efficiency programme continues with
estimated impact on EBITDA in FY 2017 of € 27 million
• Of a total of 126 projects with successful initiatives, the following
stand-out:
+ Wood: € 5.5 million
+ Chemicals: € 3.8 million
+ Energy purchases: € 3 million
+ Product packaging: € 2.7 million
• Global 5 year target for 2016-2020: € 100 million, of which €
43 million already achieved
35Example – impact of outbound logistics
In a complex operation such as logistics (with 3,800 destinations in 130
countries), we believe there is still room to optimize costs.
21 146
International ports
88K
Logistic platforms TEU* (largest
(3 PLs) (destination) Iberian shipper)
Road 6 National ports (origin)
40%
Maritime
60%
+ 100K
Trucks per year
1200
Vessel calls
630Trains
(440 per week day) (5 calls per week day) (2-3 per week day)
*TEU - Twenty Foot Equivalent Unit: unit of the capacity of a container ship and a container terminal 36With sustainability in its path
• “Inpactus”, the new R&D project to
create innovative products and
technologies from Eucalyptus
• Navigator participated for the 1st time in
the CDP rating obtained score A-
Leadership in the CDP – Climate Change
2017
• Navigator as “The Web Summit Carbon
Offsetting Partner”
37Sustainability at Navigator
38Sustainability at Navigator
39ATF solar photovoltaic power plant
1,140
8,800
tons of CO2
polycrystalline avoided (per
solar panels year)
The largest photovoltaic solar power plant in an industrial setting in
Portugal
Installed capacity: 2.2 MW
Production: 3.1 GWh/year
Self-consumption regime: Electricity is consumed in PM4
Electricity cost avoidance (2017): 264,000 €
Engineering, procurement and construction: EFACEC
40RAIZ & Inpactus project – creating
innovative products & technologies
A co-promotion R&D project
50 Research grants
between industry and
180 Researchers/technitians
academia
2 Invited chairs
A step forward to a green,
Total budget: 15.3 M€
global, sustainable and
competitive bioeconomy in
Public funding: 8.6 M€
Portugal, based on eucalyptus
NVG: 5.2 M€ Univ: 3.4 M€
pulp and paper industry!
Some examples of bioproducts from biorefinery
41Portucel S.A.
Assembleia
Geral
21 de Maio de 2013You can also read