3Q19 Institutional Presentation

Page created by Aaron Lang
 
CONTINUE READING
3Q19 Institutional Presentation
3Q19   Institutional Presentation
3Q19 Institutional Presentation
Disclaimer

The information contained in this presentation is only a summary and does not purport to be complete. This presentation has been prepared solely for informational purposes and should not be construed
as financial, legal, tax, accounting, investment or other advice or a recommendation with respect to any investment. This presentation does not constitute or form part of any offer or invitation for sale or
subscription of or solicitation or invitation of any offer to buy or subscribe for any securities, nor shall it or any part of it form the basis of or be relied on in connection with any contract or commitment
whatsoever.

This presentation includes estimates and forward-looking statements within the meaning of the U.S. federal securities laws. These estimates and forward-looking statements are based mainly on our
current expectations and estimates of future events and trends that affect or may affect our business, financial condition, results of operations, cash flow, liquidity, prospects and the trading price of our
preferred shares, including in the form of ADSs. Although we believe that these estimates and forward-looking statements are based upon reasonable assumptions, they are subject to many significant
risks, uncertainties and assumptions and are made in light of information currently available to us.

These statements appear throughout this presentation and include statements regarding our intent, belief or current expectations in connection with: changes in market prices, customer demand and
preferences and competitive conditions; general economic, political and business conditions in Brazil, particularly in the geographic markets we serve as well as any other countries we currently serve
and may serve in the future; our ability to keep costs low; existing and future governmental regulations; increases in maintenance costs, fuel costs and insurance premiums; our ability to maintain landing
rights in the airports that we operate; air travel substitutes; labor disputes, employee strikes and other labor-related disruptions, including in connection with negotiations with unions; our ability to attract
and retain qualified personnel; our aircraft utilization rate; defects or mechanical problems with our aircraft; our ability to successfully implement our growth strategy, including our expected fleet growth,
passenger growth, our capital expenditure plans, our future joint venture and partnership plans, our ability to enter new airports (including certain international airports), that match our operating criteria;
management’s expectations and estimates concerning our future financial performance and financing plans and programs; our level of debt and other fixed obligations; our reliance on third parties,
including changes in the availability or increased cost of air transport infrastructure and airport facilities; inflation, appreciation, depreciation and devaluation of the real; our aircraft and engine suppliers;
and other factors or trends affecting our financial condition or results of operations, including those factors identified or discussed as set forth under “Risk Factors” in the prospectus included in our
registration statement on Form F-1 (No. 333-215908) filed with the Securities and Exchange Commission (the “Registration Statement”).

In addition, in this presentation, the words “believe,” “understand,” “may,” “will,” “aim,” “estimate,” “continue,” “anticipate,” “seek,” “intend,” “expect,” “should,” “could,” “forecast” and similar words are
intended to identify forward-looking statements. You should not place undue reliance on such statements, which speak only as of the date they were made. We do not undertake any obligation to update
publicly or to revise any forward-looking statements after we distribute this presentation because of new information, future events or other factors. Our independent public auditors have neither examined
nor compiled the forward-looking statements and, accordingly, do not provide any assurance with respect to such statements. In light of the risks and uncertainties described above, the future events and
circumstances discussed in this presentation might not occur and are not guarantees of future performance. Because of these uncertainties, you should not make any investment decision based upon
these estimates and forward looking statements.

In this presentation, we present EBITDA, which is a non-IFRS performance measure and is not a financial performance measure determined in accordance with IFRS and should not be considered in
isolation or as alternatives to operating income or net income or loss, or as indications of operating performance, or as alternatives to operating cash flows, or as indicators of liquidity, or as the basis for
the distribution of dividends. Accordingly, you are cautioned not to place undue reliance on this information.

                                                                                                                                                                                                                        2
                                                                                                                                                                                                                        2
3Q19 Institutional Presentation
AZUL AT A GLANCE
The fastest-growing, most profitable and best positioned airline in Brazil

              in destinations served
   #1         (100+)

              in 84% of
   #1         markets served

              in domestic
   #1         departures

              in on-time performance and
   #1         customer satisfaction

              Profitability and balance
   #1         sheet

                                                                             3
3Q19 Institutional Presentation
BRAZILIAN AVIATION MARKET GROWTH OPPORTUNITY

        Brazil Domestic Passengers by Year
                                                                                                               Flights Per Capita
                   (in millions)

                                               126                                                                                           2.7

                           99

                   27

                                                                                                                                     1.3
      50
                                                                                                                   0.8         0.8
                           72
                                                                                                      0.5
                                                                                         0.3

     2008               2019E                 2022E                                     Brazil      Brazil     Colombia Mexico       Chile   USA
                                                                                        2007        2018         2018    2018        2018    2018

     Source: Azul, ANAC, IATA, CE BR, ABE AR, IBGE and Bloomberg. Assumes 2019 domestic passeng er growth ex - Azul remains flat                    4
3Q19 Institutional Presentation
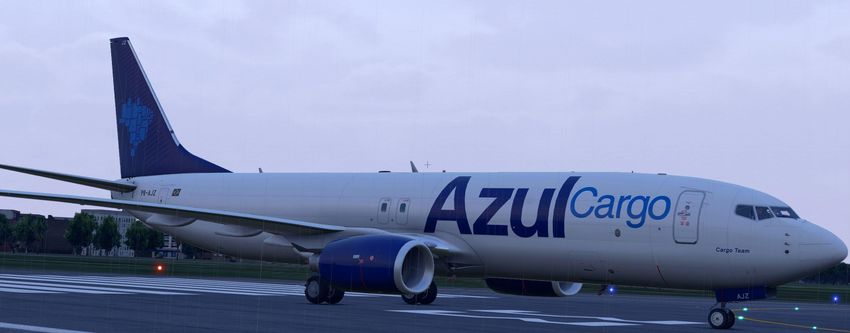
COMPANY LED BY FOUNDERS

    David Neeleman                   John Rodgerson                    José Mario Caprioli
   Founder and Chairman              Founder and CEO                 Founder of Trip Airlines and
                                                                          Board Member

    Alex Malfitani          Abhi Shah            Jason Ward               Flávio Costa
    Founder and CFO       Founder and CRO    Founder and VP People       Founder and COO

                                                                                                    5
3Q19 Institutional Presentation
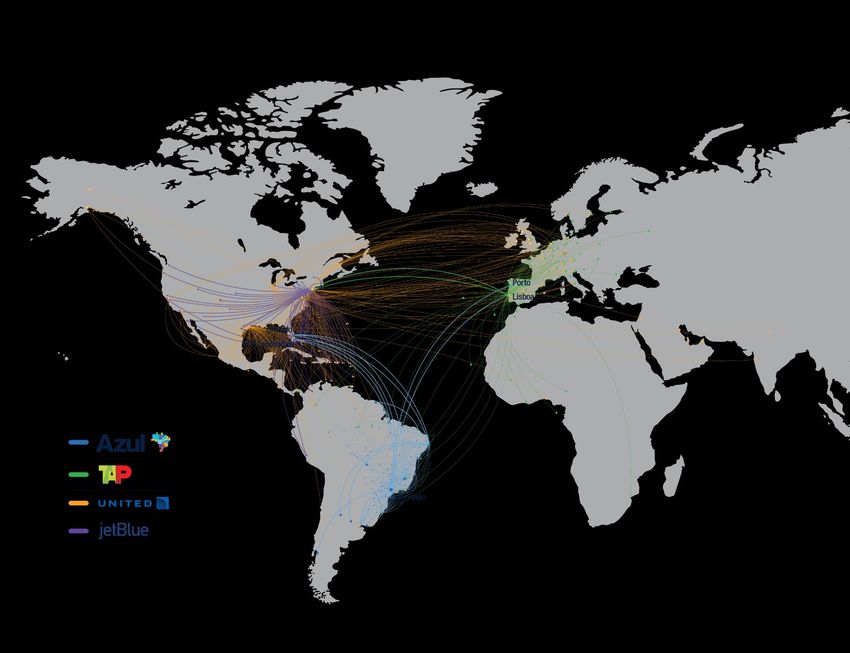
AZUL BUSINESS MODEL FOUNDATION

                            Over US$1.3 billion of capital invested:

     2008              2012                 2015                 2016           2017

 Start-up capital   Acquisition of     United investment     HNA investment   IPO US$406
 US$250 million      Trip Airlines      US$100 million       US$450 million      million

                                                                                           6
3Q19 Institutional Presentation
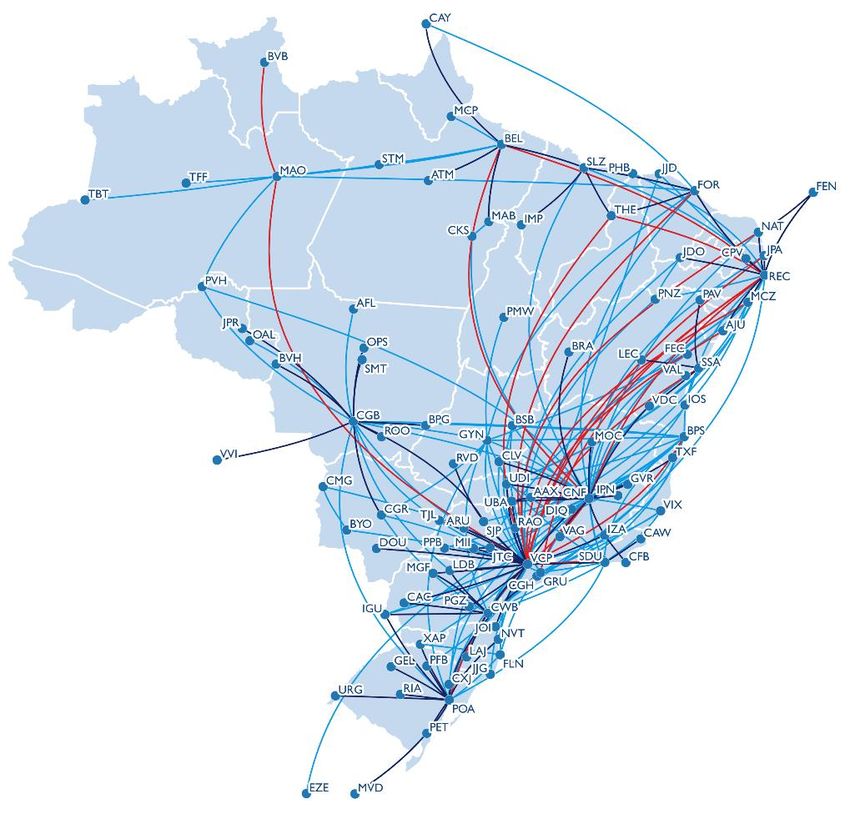
SUSTAINABLE, DEFENSIBLE BUSINESS MODEL

                   1.                     2.
                  Largest                Unparalleled
                  network with           network
                  multiple hubs          connectivity

                   3.                     4.
                  Diversified fleet      Renowned
                                         Customer
                                         Service

                                                        7
3Q19 Institutional Presentation
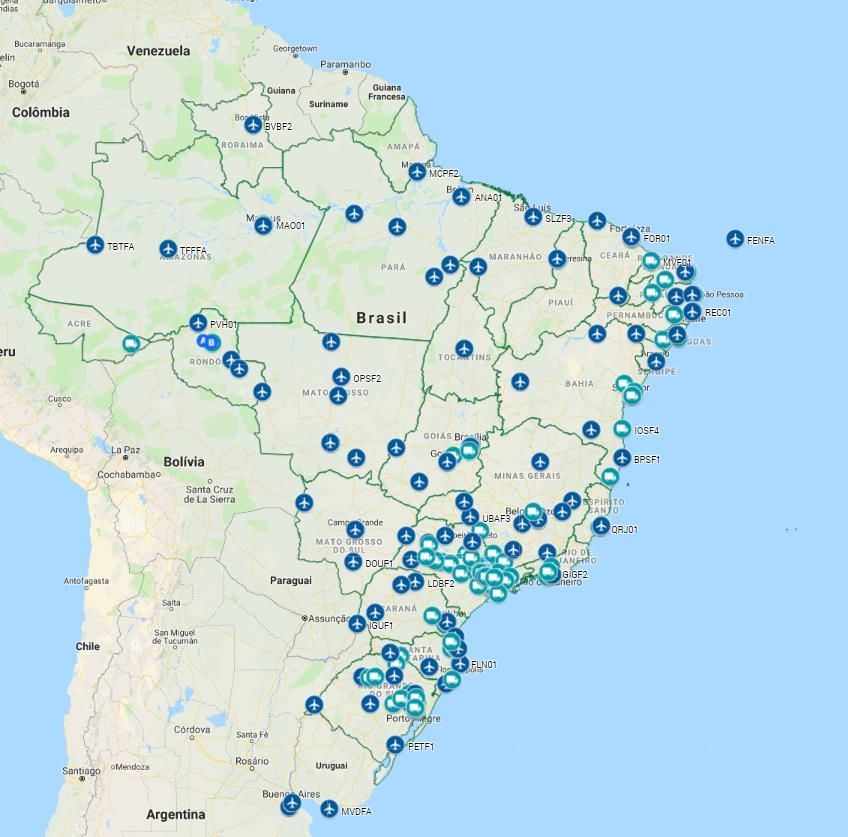
MARKET AND ROUTE LEADERSHIP

                                                                                   Domestic Cities               Origin &                Daily
                                                                                      Served                   Destinations            Departures

                                                                                        104                    2,812                   910

                                                                                                                                               780
                                                                                                                                                     751

                                                                                              57
                                                                                                                   1,404
                                                                                                   46
                                                                                                                        1,107

 Azul

 Competitors

                                                                                                        Azul   Competitor 1     Competitor 2

               Source: Azul, ANAC and Compani es. Consider s leadership by number of departures                                                            8
3Q19 Institutional Presentation
LIMITED ROUTE OVERLAP WITH COMPETITORS

              Azul Routes Leadership                        Route Overlap

                                                                              86%
                        Only Carrier 72%

                        Most Frequencies 12%

                        Others 16%

Leadership Share                                                28%
% of routes                          84%         21%

% revenues                           83%       Azul-Latam      Azul-Gol     Latam-Gol

                                                                                        9
3Q19 Institutional Presentation
STRATEGICALLY CONSISTENT GROWTH
Azul Route Leadership Position
01                      02                                     03

Before                  Before & After Avianca Brasil          2020E
A320neos (2015)         flight cancelations

                                                72%
                             2Q19
                                       16%
                                          12%
          24%     62%                                                                71%
                                                                        21%
            14%
                                                70%
                             4Q19                                             8%
                                        18%
                                          12%

                                                Only carrier   Frequency advantage         Other   10
LEADERSHIP                                                  Nonstop Destinations by Airport
POSITION IN TOP
AIRPORTS                                                            Azul                    Competitor 1   Competitor 2

                                                                                                                                  51
                                          Campinas                      4
                                                            1

                                                                                                                             40
                                          Belo Horizonte                                8
                                                                                    7

                                                                                                           26
                                          Recife                                6
                                                                    3

                                                                                                  17
                                          Cuiabá                2
                                                                2

                                                                                             12
                                          Rio (SDU)                                 7
                                                                            5

                                                                                             12
                                          São Paulo (GRU)                                                               35
                                                                                                                   33

      Source: Azul, ANAC and Compani es                                                                                                11
EXCLUSIVE PROVIDER ON KEY ROUTES

                             Spoke Example: Ribeirão Preto–Campinas

                                              ARU
                                              Araçatuba
                           BYO                                  CMG
                           Bonito                               Corumbá                                          Local

               RVD                                                        DOU
               Rio Verde                                                  Dourados            Connection          6%
  RAO                                         VCP
                                                                                              Breakdown
                                                                      TJL
                                                                                                                   94%
                   PGZ                                                                                                   Connecting
                Ponta Grossa                                        Três Lagoas
 Ribeirão
  Preto                             MII                   +43
                                    Marília

                               Exclusive destination                                 Non-exclusive destination

                                                                                                                                      12
FORTRESS HUB
AT CAMPINAS
AIRPORT

               13
UNIQUE NETWORK WITH STRATEGIC HUB LOCATIONS

 Competitors focus on                                          Azul serves all of Brazil
 São Paulo, Brasilia and Rio

                            Brasília

                                           Rio de
                              São Paulo    Janeiro
                              (GRU+CGH)    (SDU+GIG)

 More than 90% of competitors’ domestic ASKs
 are from/to cities in the triangle compared to 37% for Azul

                                                                                           14
STRONG CONNECTIVITY
AT MULTIPLE HUBS

Hubs              Daily    Cities Served   Connecting
                 Flights     (non-stop)    Passengers

Campinas                                      62%
                  142           51
(São Paulo)

Belo Horizonte     90           40            59%

                                                        Hubs:
Recife             62           26            57%       Campinas, Belo Horizonte & Recife

                                                        Focus cities:
                                                        Belem, Cuiabá, Curitiba, Porto Alegre, and
                                                        Goiânia
                                                                                                     15
AZUL OPERATING FLEET PROJECTION

                                                       170
                                                165
                                         160
                                  151
                          143
                           6             32     41      46
                                  20
                   123
                           38
                   20
                                  52
                    7      9             61
                                                70
  Embraer E2                                            80
                   33
                           33     12
  A320neo family                         12
                                  33            12
  A330
                                         33             12
                   63      57
  ATRs                                          32
                                  34                    32
                                         22
  E-Jets                                        10
                   2018   2019    2020   2021   2022   2023

                                                              16
Next Gen Aircraft % of Total ASKs

                                                                     87%
                                                             81%
                                                     75%
FLEET
TRANSFORMATION                               61%
PROGRESS
                                      42%
Next generation
aircraft to further          26%
strengthen Azul’s     14%
margins going
forward
                      2017   2018   2019E    2020E   2021E   2022E   2023E

                                                                             17
AZUL’S FLEET TRANSFORMATION
The addition of next-generation aircraft is the cornerstone of Azul’s margin expansion strategy going forward

                        CASK Advantage                                                                 Trip Cost vs CASK

                               -26%         -29%

                  E195           E2        A320neo
                118 seats     136 seats    174 seats

                        Trip Cost Advantage

                                              +5%
                                -14%
                                                                                                                                       seats
                                                                                  50      70      90       110    130      150   170

                  E195            E2        A320neo
                118 seats     136 seats    174 seats                                                     CASK     Trip cost

                                                                                                                                               18
APPROPRIATELY-SIZED AIRCRAFT FOR THE BRAZILIAN MARKET

 Targeted Routes by Fleet Type

                       70 seats
           ATR
                       Avg. Stage Length: 391 km

                       106-136 seats
           E-Jets
                       Avg. Stage Length: 701 km

                       174 seats
           A320neo
                       Avg. Stage Length: 1,475 km

                                                        19
THE A320NEO EFFECT: STRENGTHENING THE NETWORK

                                          Replacement of E-Jets for A320neos
                                          Campinas–Recife example

                                                                            Change

                                          Number of seats/week              +72%

                                          Daily flights                     +33%

                                          Load factor                       +3.0 p.p.

                                          Local passengers                  +40%

                    A320neo (174 seats)   Connecting passengers             +94%
                    ATRs (70 seats)
                    E-Jets (118 seats)    Non-A320neo flights load factor   +3.4 p.p.

                                                                                        20
Domestic ASK Growth 2020E

                                                    New markets

                                                       5%
                                                                      Additional
                                                                      frequencies in
                                                             19%      current markets
STRATEGICALLY
CONSISTENT
GROWTH

Over 30 destinations
                            Upgauge in
to be added over next   current markets       76%
five years

                                                                                        21
MARKET SHARE IN CORPORATE MARKETS

  RPK and Corporate Revenue Share (1H19)                                      Average Corporate Ticket Price (roundtrip, R$)

                                                                                                  26%                  7%
                                                                                    13%
                 23%
                                                    33%                                                                     790
                                                                                                      748        737
                                                                                       714
                                                                                631
                                                                                                592
                 32%
                                                    26%

                 37%
                                                    37%

                  8%                                 4%
            RPK Shares                          Corporate                       Competitor 1   Competitor 2        Azul
                                                Revenue

   Azul        Competitor 1          Competitor 2           Others                             1H18       1H19

          Source: Abracorp (Associa tio n of Brazilian Corporate Agencies )                                                       22
INTERNATIONAL
EXPANSION
THROUGH
PARTNERSHIPS

                23
HIGH QUALITY CUSTOMER EXPERIENCE
Customer-oriented culture and innovative service providing an enjoyable customer experience

New Cabin
Interior
(A330s)
STRONG BRAND RECOGNITION

                Net Promoter Score

                                                      TOP 10 AIRLINE      BEST LOW COST         BEST AIRLINE
                                                       WORLDWIDE          LATIN AMERICA           BRAZIL

  68%          62%           61%           60%

                                                    BEST BUSINESS CLASS      BEST ECONOMY        BEST AIRLINE
                                                       LATIN AMERICA      CLASS LATIN AMERICA   LATIN AMERICA

     89% of customers would strongly recommend or
    recommend Azul to a friend or relative

                                                                                                                25
AZUL CARGO
AT A GLANCE

    Air-service to +115 destinations with 130
    aircraft

    240 stores nationwide serving 3,700 cities

    93% of our ATK’s coming from belly space
    at very low variable cost

                                                 26
END-TO-END LOGISTICS SOLUTIONS

                                 27
HIGH GROWTH BUT STILL BELOW FAIR SHARE

                            TudoAzul Members
                                                                                           TudoAzul Growth Potential
                                (millions)

                                                                                 Gross Billings Market        Airline Passenger
                                                                          11.4          Share                  Revenue Share
                                                                   10.8

                                                            9.0
                                                                                                                   29%

                                  +36%               7.0
                                               5.9                                      20%

                                       4.5

                               3.1
                      2.2
              1.8
       1.2
 0.7

2009   2010   2011    2012    2013    2014    2015   2016   2017   2018   2Q19

              Source: Azul, Smiles and Multiplus
                                                                                                                                  28
              *Gross billings ex-airline
AZUL CARGO AND TUDOAZUL GROWTH

• Cargo revenue up 42% YoY                             • Gross billings up 40% YoY
• Increase in volume share from 12% to 22% YoY
                                                       • Wholly-owned loyalty program TudoAzul with
• Partnership with Mercado Libre                         ~12 million members
• E-Commerce represented 19% of cargo revenue
                                                       • Fourth consecutive year of growth above 30%
                 Cargo Revenue                                      Gross Billings Growth*
                    Net (R$ million)
                                                                             40%

                                                 42%

         3Q18                             3Q19                     3Q18                3Q19

          * Gross billings ex- airlin e                                                                29
GROWING THE BUSINESS AND EXPANDING MARGINS

 Operating Margin Growth Breakdown

                 Next-Generation        Business            Non-ticket            Macro
                     Aircraft            Units               Revenue           Environment

                      45%                 40%                  50%                 0%

   Pre-IPO                                                                                      2020

                 Additional upside for equity story coming from e-commerce and TAP investment

                                                                                                       30
DELIVERING ON OUR IPO PROMISES

           ASKs                            Net Revenue                   EBITDAR                 % ASKs
          (billion)                         (R$ billion)                (R$ billion)          Next-Generation

            54%                                71%                         99%
                      35.2                             11.4                            3.6                  42

   22.9
                                        6.7
                                                                 1.8

                                                                                              1

   2016               2019E             2016           2019      2016              2019      2016         2019E
                                                     Consensus                   Consensus

           Source: Azul and Bloomberg                                                                             31
RASK SLA*              CASK
                                                          Operating Margin
                                                                                              (R$ cents)          (R$ cents)

                                                                                               +1.7%
                                                                                                                    -4.0%
3Q19 FINANCIAL                                              17.6%      18.5%
                                                                                            31.7    32.3   25.8     25.4       24.8
HIGHLIGHTS

                                                             3Q18      3Q19                 3Q18   3Q19    3Q18     3Q19 3Q19 ex
                                                                                                                          payroll

                                                • Net revenue growth of 25% YoY with a 0.8 p.p. increase in operating margin

                                                • EBITDA of R$935.8 million, up 24.4% YoY

                                                • Operating income of R$ 559.3 million, up 31% YoY

                                                • 1.7% RASK increase YoY adjusted for stage length, with 26.1% growth in capacity

                                                • CASK down 1.5%; adjusting for payroll tax, down 4.0%

                                                • Net income, adjusted for foreign currency, increase of 57% to R$441 million

      * Stage - lengt h adjusted RASK formula = RASK*(s tag e - l e ngt h / 1000 )^ 0. 5
      Note: 3Q19 results exclude non - recurr e n t aircraft book loss of R$ 15.9 million
                                                                                                                                      32
3Q19 LTM EBITDA MARGIN (IFRS 16) – AZUL VS. PEERS

                      29.6%

                                        24.3%              24.2%             23.9%

                                                                                                20.7%
                                                                                                                  19.4%

                                                                                                                                16.3%
                                                                                                                                          14.7%

                      3Q19               3Q19              3Q19               3Q19              3Q19               3Q19         3Q19      3Q19
                                                                                                                                        Global Legacy
                                                                                                                                           Airlines*

       Source: Company public f ilings
       E xcludes non - recur ri ng items and minority interest                                                                                          33
       Global Legacy Airlines calculated as average E BITDAR margin of American Airlines, United Airlines and Delta Air Lines
STRONG LIQUIDITY POSITION
Azul maintained a strong cash position while protecting all of its non-aircraft debt foreign currency exposure

                                   Cash Balance                                                                            Total Debt ²
                                    (R$ million)                                                                            (R$ billion)

    Accounts receivables                                                                            Capitalized Leases
                                                                                41% of              Loans and Financing
    Cash¹
                                                                                 TTM
                                                                               revenue

                                                               4,367
               4,118

               1,341                                           1,424                                                                              10,3
                                                                                                                   8,8

               2,777                                           2,943

                                                                                                                   2,5                             3,0

               3Q18                                             3Q19                                              3Q18                            3Q19

                                                                                                                           3.3x               3.3x
                                                                                                                          Leverage (Net Debt / EBITDA)
               1   Includes cash and cash equivalents , short -term and long -term investm e nt s
               2    Adjusted f or currency hedges
                                                                                                                                                         34
Free Cash Flow
                                            (R$ million)
                  951

                                 279

                                            672

FREE CASH
FLOW                                                           484
GENERATION

                                                                            187

             Cash flow from   Net CAPEX     FCF            Aircraft Rent   Adj FCF
              operations                                     Payment

                                                                                     35
STRONG LIQUIDITY POSITION

                                  Debt Profile
                                                                                                                       Average Cost of Debt
                                   R$ Million

    Total Debt                                     Working Capital Debt
                                                                                                                            U.S. Dollar                  Real
              837
               2,164                                               705

                                                        1,315                              Lease Liabilities                   8.6%                         -
     10,280                                                          177
           9,282

    Aircraft leases                                       Senior notes
                                                                                           Other Loans                         5.7%                      5.8%
    Other aircraft liabilities                            Debentures
    Loans and financing                                   Others

                                                                           Debt Maturity Profile

                                                                                                                                      Senior Notes    BRL       USD
   4,367

                                                                                                                                                          1,446

                                                         420                          533                                                                 1,315
                                  94                                                                          312                    196
                                                            394                          444                     259
                                 8   86               26                         90                        53                     7     189             16    116
  Liquidity                       4Q19                  2020                       2021                        2022                 2023             2024 and beyond
           Note: Considers the ef f ect of currency hedges on debt                                                                                                     36
AZUL UNIQUE ASSETS

    R$ million

                                                                                          TAP Investment
                                                                                     (up to 47% of TAP equity value)
                                                 Pre-paid maintenance
                                                       expenses

                 100% owned loyalty
                     program
                                                                                                1,380

                                                       1,628

                    TudoAzul                     Security deposits                             TAP
                                                 and maintenance                            Investment
                                                     reserves

   Besides higher margins and a stronger balance sheet, Azul also has valuable assets not found in other airlines

                                                                                                                       37
TAP INVESTMENT
TAP’s convertible bond and network connectivity to further boost Azul’s results

                                                                                                      TAP Investment

                  • Leader in traffic between Brazil and                               • € 90M strategic investment in TAP bonds
                    Europe (26%)                                                         convertible into up to 41.25% of
                  • Fleet of 93 aircraft                                                 economic interest
                  • Service to 10 cities in Brazil                                     • 2025 maturity with 7.5% annual interest
                  • C-level suite formed by former Azul                                • Secured by TAP’s frequent flyer program
                    executives                                                           Victoria
                                                                                       • Acquired 6.1% economic stake in TAP for
                                                                                         US$ 25M

               ASK                Revenues               EBIT                             TAP Economic Interest After Bond
              (billion)           (€ million)         (€ million)                                  Conversion

                  +13%                                                                  Parpública
                                    +10%
                                                                                      & Employees
                      47                3,245
                                                     93                                                 21%
             42                2,960
                                                               66
                                                                                                                  47%    Azul

                                                                                                        32%
                                                                                           Atlantic
           2017      2018      2017     2018       2017      2018                 Gateway (ex-Azul)

                                                                                                                                   38
SUCCESSFUL CONCLUSION OF AZUL’S IPO AND FOLLOW ON
Azul to further strengthen its balance sheet with its IPO proceeds

                                                                             Azul IPO Summary

         IPO total offer of R$2,021 million (US$644 million):
         • R$1,288 million (US$406 million) of net proceeds to Azul
         • R$21 per preferred share, US$20.06 per ADS*
         Follow On total offer of R$ 1,250M (US$400 million)
         • Significant increase in daily liquidity
         HNA Follow On total offer of US$313 million
         • US$ 16.15 per ADS*

                                                                                                                       Preferred
 As of September 30th, 2019                                                Common                   Preferred                            Economic Interest
                                                                                                                      Equivalent**

 David Neeleman                                                                 622,406,638              11,432,352         19,731,107                 5.8%

 Trip former shareholders                                                       306,558,420             18,231,040          22,318,486                 6.5%

 United Airlines, Inc. (Calfinco)                                                                       26,995,316          26,995,316                 7.9%

 Others                                                                                                272,410,921         272,410,921                79.7%

 Treasury                                                                                                  290,091             290,091                 0.1%

 Total                                                                          928,965,058            329,359,720         341,745,921               100.0%

                *E ach ADS corresponds to three preferred shares
                                                                                                                                                              39
                **Assumi ng the conversio n of common shares to preferred shares at a 75:1 ration
ENVIRONMENTAL, SOCIAL AND GOVERNANCE (“ESG”) RESPONSIBILITY

                                                                           1H19          1H18      %∆
                                            GHG (Kg of CO2, million)       1,779.8      1,592.4    11.8%
                      Total fuel consumed per ASK (kg / ASK, million)       34.3         35.5      -3.4%

     Environmental                     Average age of operating fleet        5.9          5.8      2.0%

                                            Independent directors (%)        81.8         83.3      -1.8%
                           Percent of board members that are women            9.1          8.3      9.1%
                                                 Director average age        49.6         43.2     14.8%
                                      Director meeting attendance (%)         85           95      -10.5%
       Governance
                                                            Board size       11.0         12.0      -8.3%
                     Participation of woman in leadership positions (%)      39.4         39.8      -1.1%

                                            Employee gender: (%) male              57       57      0.0%
                                                              (%) female           43       43      0.0%
                                         Employee monthly turnover (%)         1.06        0.80     32.5%

            Social                             Employees unionized (%)        100.0        100.0    0.0%
                                                              Volunteers      2,034        1,553    31.0%

                                                                                                            40
FY 2019 OUTLOOK

                                                   Previous    Current

 ASK growth                                       20% to 22%    ~20%
    Domestic                                      23% to 25%    ~23%

    International                                 10% to 15%    ~12%

 CASK                                             0% to 2%     ~ -0.5%
  Cask excluding non-recurrent items                           ~1.5%

 Operating Margin excluding non-recurrent items   18% to 20%   ~18%

                                                                         41
I N V E S T O R R E L AT I O N S

 +55 11 4831 2880

     invest@voeazul.com.br
You can also read