Corporate Overview NASDAQ: OTEX | TSX: OTEX - February 2019
←
→
Page content transcription
If your browser does not render page correctly, please read the page content below

Corporate Overview
NASDAQ: OTEX | TSX: OTEX

February 2019

Safe Harbor Statement
Certain statements in this presentation, including statements about the focus of Open Text Corporation (“OpenText” or “the Company”) in our fiscal year ending June 30, 2019 (Fiscal 2019) on
growth in earnings and cash flows, creating value through investments in broader Enterprise Information Management (EIM) capabilities, distribution, the Company's presence in the cloud and in
growth markets, expected growth in our revenue lines, total growth from acquisitions, innovation and organic initiatives, and distribution expansion, the focus on recurring revenues, improving
efficiency, expanding cash flow and strengthening the business, adjusted operating income and cash flow, its financial condition, the adjusted operating margin target range, results of operations
and earnings, announced acquisitions, ongoing tax matters, the integration of the acquired businesses, expected timing, charges and savings related to restructuring activities, declaration of
quarterly dividends, future tax rates, new platform and product offerings, scaling OpenText to new levels, and other matters, may contain words such as "anticipates", "expects", "intends", "plans",
"believes", "seeks", "estimates", "may", "could", "would", "might", "will" and variations of these words or similar expressions are considered forward-looking statements or information under
applicable securities laws. In addition, any information or statements that refer to expectations, beliefs, plans, projections, objectives, performance or other characterizations of future events or
circumstances, including any underlying assumptions, are forward-looking, and based on our current expectations, forecasts and projections about the operating environment, economies and
markets in which we operate. Forward-looking statements reflect our current estimates, beliefs and assumptions, which are based on management's perception of historic trends, current
conditions and expected future developments, as well as other factors it believes are appropriate in the circumstances, such as certain assumptions about the economy, as well as market,
financial and operational assumptions. Management's estimates, beliefs and assumptions are inherently subject to significant business, economic, competitive and other uncertainties and
contingencies regarding future events and, as such, are subject to change. We can give no assurance that such estimates, beliefs and assumptions will prove to be correct. Such forward-looking
statements involve known and unknown risks, uncertainties and other factors and assumptions that may cause the actual results, performance or achievements to differ materially. Such factors
include, but are not limited to: (i) the future performance, financial and otherwise, of OpenText; (ii) the ability of OpenText to bring new products and services to market and to increase sales; (iii)
the strength of the Company's product development pipeline; (iv) the Company's growth and profitability prospects; (v) the estimated size and growth prospects of the EIM market including
expected growth in the Artificial Intelligence market; (vi) the Company's competitive position in the EIM market and its ability to take advantage of future opportunities in this market; (vii) the
benefits of the Company's products and services to be realized by customers; (viii) the demand for the Company's products and services and the extent of deployment of the Company's products
and services in the EIM marketplace; (ix) downward pressure on our share price and dilutive effect of future sales or issuances of equity securities (including in connection with future
acquisitions); (x) the Company's financial condition and capital requirements; and (xi) statements about the impact of product releases. The risks and uncertainties that may affect forward-looking
statements include, but are not limited to: (i) integration of acquisitions and related restructuring efforts, including the quantum of restructuring charges and the timing thereof; (ii) the potential for
the incurrence of or assumption of debt in connection with acquisitions and the impact on the ratings or outlooks of rating agencies on the Company's outstanding debt securities; (iii) the
possibility that the Company may be unable to meet its future reporting requirements under the U.S. Securities Exchange Act of 1934, as amended, and the rules promulgated thereunder, or
applicable Canadian securities regulation; (iv) the risks associated with bringing new products and services to market; (v) failure to comply with privacy laws and regulations that are extensive,
open to various interpretations and complex to implement including General Data Protection Regulation (GDPR) and Country by Country Reporting (CBCR); (vi) fluctuations in currency exchange
rates; (vii) delays in the purchasing decisions of the Company's customers; (viii) the competition the Company faces in its industry and/or marketplace; (ix) the final determination of litigation, tax
audits (including tax examinations in the United States and elsewhere) and other legal proceedings; (x) potential exposure to greater than anticipated tax liabilities or expenses, including with
respect to changes in Canadian, U.S. or international tax regimes including the new tax reform legislation enacted through the Tax Cuts and Jobs Act in the United States; (xi) the possibility of
technical, logistical or planning issues in connection with the deployment of the Company's products or services; (xii) the continuous commitment of the Company's customers; and (xiii) demand
for the Company's products and services. For additional information with respect to risks and other factors which could occur, see the Company's Annual Report on Form 10-K, Quarterly Reports
on Form 10-Q and other securities filings with the Securities and Exchange Commission (SEC) and other securities regulators. Readers are cautioned not to place undue reliance upon any such
forward-looking statements, which speak only as of the date made. Unless otherwise required by applicable securities laws, the Company disclaims any intention or obligation to update or revise
any forward-looking statements, whether as a result of new information, future events or otherwise.

                                                                                                                                                               OpenText Confidential. ©2019 All Rights Reserved.   2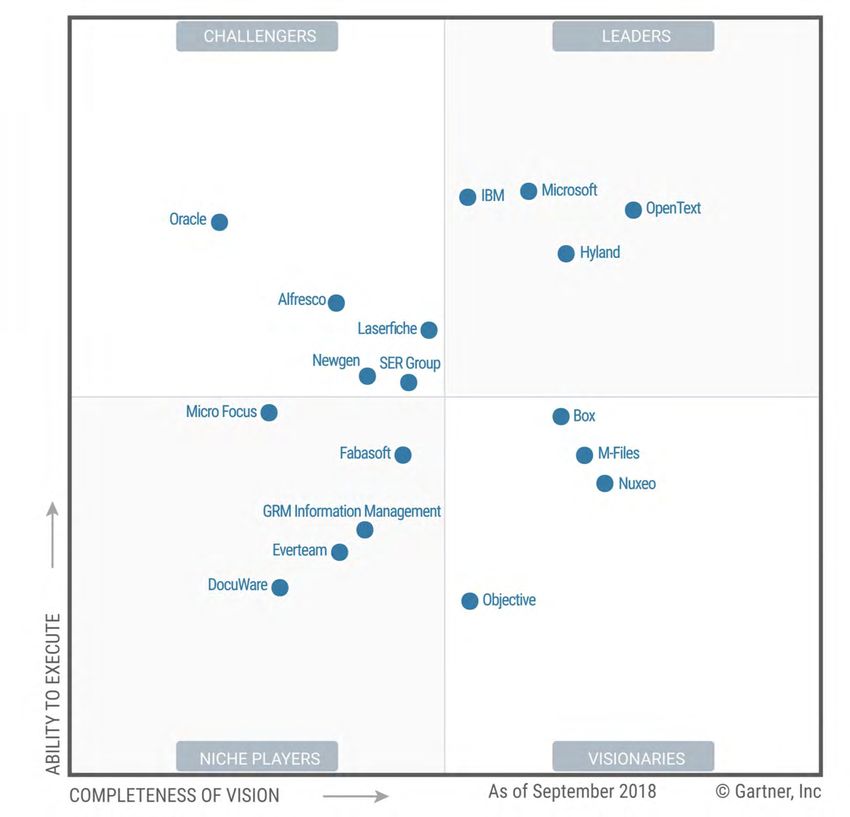
The Intelligent & Connected Enterprise

                               OpenText Confidential. ©2019 All Rights Reserved.   3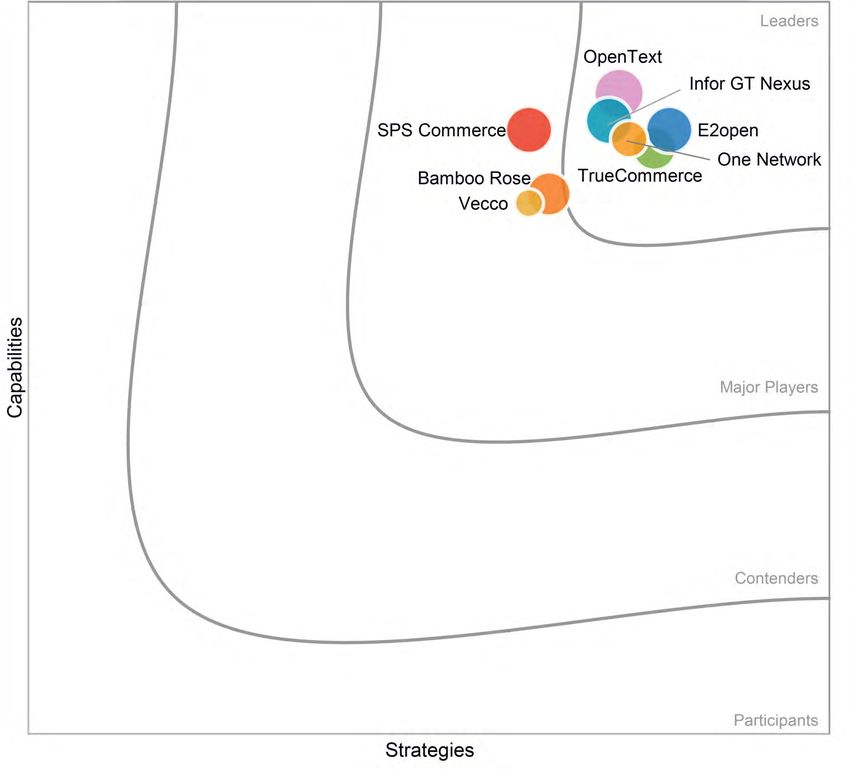
Content

          1. OpenText Global
          2. OpenText Europe

                               OpenText Confidential. ©2019 All Rights Reserved.   4
OpenText Global

                  OpenText Confidential. ©2019 All Rights Reserved.   5
NASDAQ, TSX: OTEX
                                                                                                                                                                                               A TSX-60 Company

The EIM market leader for enterprise software and cloud solutions enabling
      enterprises to create connected and intelligent organizations

                                                                     •        Market Leader in EIM                                        (1)

                                                                     •        120,000 Customers

    The                                                              •        100 Million End Users

Information                                                          Fiscal 2018 Results:
 Company                                                             •        Revenues of $2.8 Billion
                                                                     •        Annual Recurring Revenue of $2 Billion
                                                                     •        Adj EBITDA Margin 36%
                                                                     •        OCF $708 Million(2)
                                                                     •        ROIC 17.5%
     1.   EIM: Enterprise Information Management. All statements and figures are Company supplied estimates
     2.   Certain prior period comparative amounts have been adjusted to conform to current period presentation in accordance with recently adopted accounting standards. For more   OpenText Confidential. ©2019 All Rights Reserved.   6
          details, see Note 1 to the Company’s Form 10-Q
1100%
1300%
1500%
100%
300%
500%
700%
900%
-100%
12/31/1998
6/30/1999
12/31/1999
6/30/2000
12/31/2000
6/30/2001
12/31/2001 20 Year
OTEX v. NASDAQ
6/30/2002
12/31/2002
6/30/2003
12/31/2003
6/30/2004
OTEX
1,072%
12/31/2004
1. Source: NASDAQ (December 31, 2018)
6/30/2005
12/31/2005
6/30/2006
12/31/2006
6/30/2007
252%
12/31/2007
NASDAQ
6/30/2008
12/31/2008
6/30/2009
12/31/2009
6/30/2010
820pp
12/31/2010
6/30/2011
OTEX delta
to NASDAQ(1)
20-Year Total Shareholder Return
12/31/2011
6/30/2012
12/31/2012
6/30/2013
12/31/2013
6/30/2014
12/31/2014
6/30/2015
12/31/2015
6/30/2016
12/31/2016
6/30/2017
12/31/2017
6/30/2018
12/31/2018
OpenText Confidential. ©2019 All Rights Reserved.
Nasdaq
+252%
OpenText
+1,072%
7
Productivity Leader with Upper Quartile Metrics

                  ARR(1)                                                    Adj. EBITDA & Margin(2),(3)                                                        Operating Cash Flows(3)
                 ($US M)                                                                           ($US M)                                                                            ($US M)

                                    $2,061                                                                           $1,020                                                                          $708

                                                                                                  191%                                                                                169%
                  214%
                                                                                                                      36.2%
                                                                                         $351                                                                            $263
       $657
                                                                                          29.1%

       FY’12                        FY’18                                                FY’12                       FY’18                                               FY’12                      FY’18

                ARR                                                                           Adj. EBITDA(2)                                                                    OCF
             214% Growth                                                                      191% Growth                                                                    169% Growth

      1.   ARR – Annual recurring revenue is defined as the sum of cloud services and subscriptions revenue and customer support revenue.
      2.   Please see reconciliation of GAAP to Non-GAAP measures in our historical filings on Forms 10-Q and 10-K.
      3.   Certain prior period comparative amounts have been adjusted to conform to current period presentation in accordance with recently adopted accounting standards. For more
                                                                                                                                                                                        OpenText Confidential. ©2019 All Rights Reserved.   8
           details, see Note 1 to the Company’s Form 10-Q.
Six Years of Significant, Sustainable, Profitable Growth
   Total Revenue                                                           ARR(1)                                                               Cloud                                              Customer Support
          ($US M)                                                         ($US M)                                                              ($US M)                                                          ($US M)

                       $2,815                                                               $2,061                                                                 $829                                                         $1,233
           133%                                                                                                                                                                                                   88%
                                                                          214%
                                                                                                                                                                                                       $657
  $1,207
                                                                $657

                                                                                                                                        $0

   FY’12               FY’18                                    FY’12                       FY’18                                     FY’12                       FY’18                               FY’12                     FY’18

         License                                   Operating Cash Flows(2),(3)                                           Adj. EBITDA & Margin(2),(3)                                                        Adj. EPS(2)
          ($US M)                                                         ($US M)                                                              ($US M)                                                         ($US/sh)

                        $438                                                                  $708                                                               $1,020                                                          $2.56
           49%
                                                                           169%                                                                191%                                                              123%
  $294
                                                                                                                                                                   36.2%                              $1.15
                                                                $263                                                                 $351
                                                                                                                                       29.1%

  FY’12                FY’18                                    FY’12                        FY’18                                   FY’12                        FY’18                               FY’12                     FY’18
              1.   ARR – Annual recurring revenue is defined as the sum of cloud services and subscriptions revenue and customer support revenue.
              2.   Certain prior period comparative amounts have been adjusted to conform to current period presentation in accordance with recently adopted accounting standards. For more   OpenText Confidential. ©2019 All Rights Reserved.   9
                   details, see Note 1 to the Company’s Form 10-Q.
              3.   Please see reconciliation of GAAP to Non-GAAP measures in our historical filings on Forms 10-Q and 10-K.
Our Vision: The Intelligent and Connected Enterprise

   Customer experience                                                            Content services

Employee engagement                                                                      Security
                                             Intelligent
                                          information core
                              EIM                                EIM
Supplier efficiency                                                                             Business Network
                           applications    Automation & AI,   platforms
                                             APIs & data
                                            management
     Asset utilization                                                                      IoT, data integration

     Product innovations                                                       SDK, Developer

                                                                          OpenText Confidential. ©2019 All Rights Reserved.   10
The OpenText Business System
Acquisitions, Organic, Distribution.
Optimize, Scale, Customer & Partner Success.
Total
Market Leadership Emphasis on recurring revenues.
Growth
Integration.
Onboarding. Strategic The Information Operational
Customer driven innovation.
Tools, Systems, Methods.
Acquisitions Company Excellence
$100 Billion
Market
Source, Diligence, Value Oriented Best Teams Win
Disciplined
Key
Dividends, ROIC Capital
Metrics ARR, Adj. EBITDA, OCF
Allocation
Continuous
Improvement
OpenText Confidential. ©2019 All Rights Reserved. 11#1 in Core Markets
Gartner Magic Quadrant for IDC MarketScape: Multi-Enterprise
Content Services Platforms Supply Chain Commerce Networks 2018
OpenText
OpenText
Source: Gartner, October 2018 Source: IDC, 2018
OpenText Confidential. ©2019 All Rights Reserved. 12$100 Billion Strategic Opportunity
The Information Company
SAAS
Enterprise
Information Management Mid-Market
Managed
Content Experts Services AI
Business
CEM IoT Security
ECM Network
BPM Discovery Cloud + MORE
Search
$5B $15B $30B $50B $100B 1)
(
1. Source: Industry Analyst reports for EIM technologies, AI and IoT.
OpenText Confidential. ©2019 All Rights Reserved. 13Total Growth
Acquisitions Organic
Customer &
Partner
Success
Annual Recurring Revenue
• EIM Market leader and expanded portfolio to include Security, AI and IoT
• Focus on select verticals: FinServ, Life Sciences, Manufacturing, Auto, Healthcare, Government
OpenText Confidential. ©2019 All Rights Reserved. 14History of Successful Acquisitions
(1)
Timeline based on calendar year
• $5.1 billion of capital deployed
since 2012 for acquisitions
• 17 completed acquisitions over 7
years
• Average revenue multiple of 2.1x 2012 2014 2016 2018 2019
revenue
2013 2015 2017
• Share price appreciation (2) of
192%
• $708M OCF in FY’18(3)
• 17.5% ROIC in FY’18
(1) Timeline based on calendar year.
(2) Dividend adjusted share price appreciation from Jan 3, 2012 to June 29, 2018. OpenText Confidential. ©2019 All Rights Reserved. 15
(3) Certain prior period comparative amounts have been adjusted to conform to current period presentation in accordance with recently adopted accounting
standards. For more details, see Note 1 to the Company’s Form 10-Q.A Total Growth Strategy
$3,000 Enterprise
Content Division
15% CAGR
$2,500 $2,815M
HP CCM Assets
Total Revenue ($ M)
HP CEM Assets
$2,000
$1,500
$1,207M
$1,000
$500
$0
FY 2012 FY 2013 FY 2014 FY 2015 FY 2016 FY 2017 FY 2018
OpenText Confidential. ©2019 All Rights Reserved. 16FY’18 Revenue Breakdown
Total Revenue Mix Total Revenue by Geography
11% 16% 10%
33%
29% 57%
44%
License Americas
Cloud services & Subscriptions
Customer Support EMEA
Professional Service & Other APJ
OpenText Confidential. ©2019 All Rights Reserved. 17Leadership in Key Verticals
Utilities/Energy Public Sector Manufacturing Automotive Consumer Goods
Technology Finance/Insurance Healthcare Transportation Services
OpenText Confidential. ©2019 All Rights Reserved. 18Long Term Model - 2021 Adjusted EBITDA Targets
FY’19 Model FY’21 Target Bridge from FY’19 to FY’21
• Improve Cloud margin by optimization, offshore, and
platform consolidation
• ARR: One renewals organization, AI and automation
• Optimize OpenText Business System
36% - 38% 38% - 40%
• Utilize Centers of Excellence (Canada and offshore, i.e.
India, Philippines)
• Leverage AI and automation in all departments
• More efficient spend in Sales & Marketing
OpenText Confidential. ©2019 All Rights Reserved. 19Long Term Model – Operating Cash Flow Targets (1)
(2) OpenText Business System
OCF
Gets Us There
Total Growth:
$1B
• Acquisitions
$708M • Organic Growth
• Partner Distribution
Efficiency:
• People and Programs
FY’18 Exiting FY’21
• Digital Automation
• AI
Operating Cash Flows
$1 Billion
1. Aspirational model, results could vary based on timing and onboarding of acquisitions. This model is not guidance.
2. Certain prior period comparative amounts have been adjusted to conform to current period presentation in accordance with recently adopted OpenText Confidential. ©2019 All Rights Reserved. 20
accounting standards. For more details, see Note 1 to the Company’s Form 10-Q.Executive Leadership Team (ELT)
Ted Muhi James Madhu Gordon Prentiss Patty Paul David Brian Savinay
Harrison Majzoub McGourlay Ranganathan Davies Donohue Nagle Duggan Jamieson Sweeney Berry
EVP, EVP, EVP, EVP, EVP, SVP, SVP, SVP, SVP, SVP, SVP,
Sales Engineering Customer CFO CLO & Corporate Portfolio Group CMO Revenue Chief Information Chief Human Cloud Service
San Mateo, San Mateo, Operations San Mateo, Development San Mateo, Durham, NH, US Operations Officer Resource Officer Delivery
CA, US CA, US Waterloo, CA, US Richmond Hill, CA, US San Mateo, Richmond Hill, San Mateo, San Mateo,
ON, CA ON, CA CA, US ON, CA CA, US CA, US
Mark J. Barrenechea
CEO & CTO
Waterloo / San Mateo
OpenText Confidential. ©2019 All Rights Reserved. 21Global Operations and Distribution
San Mateo, CA Gaithersburg, MD Melbourne, AU Bangalore, India
Reading, UK Singapore Waterloo, ON
Total Americas(2) EMEA APJ
Total Employees United States Canada Europe, Middle East, Africa APJ
# of Employees(1):
12,800 3,700 1,700 2,500 4,700
Total Revenue United States Canada
FY18 Revenue:
$2.82B $1.43B $150M $920M $280M
1. Numbers are approximate as of December 31, 2018
OpenText Confidential. ©2019 All Rights Reserved. 22
2. Excludes Central and South AmericaOpenText Europe
OpenText Confidential. ©2019 All Rights Reserved. 23Europe Footprint for > 25 years
39 Offices Reading, UK
Paris, FR
European HQ
Grasbrunn,
Germany
OpenText Confidential. ©2019 All Rights Reserved. 24Europe Strong Customer Presence
CPG/Retail Government Manufacturing Automotive Legal and Media
Telecommunication Financial/Insurance Pharma/Healthcare Transportation Energy
OpenText Confidential. ©2019 All Rights Reserved. 25Europe Partners: Greater than 350
● Broad partner base in all
Ecosystem European Countries
Strong product collaboration in European Sales Cycle
● Regional partnership
with Global SI’s
Strategic
● Increased Market Reach
Alliances
● Expand Delivery
Capacity
● Deep Industry
Channel Partners
Luxembourg Spain Belgium Switzerland
Knowledge
Germany Germany Spain Portugal
● New Cloud Solutions
OpenText Confidential. ©2019 All Rights Reserved. 26SAP and OpenText
#1 SAP ISV
Partner
25 Years of
Years
Co-innovation
12+ Solutions Extensions and 7 Cloud Solution
Award winning
Extensions
5,000+ Joint Customers
1 Team: SAP-tested, licensed, with unified support
OpenText Confidential. ©2019 All Rights Reserved. 27EMEA Strategic Acquisitions
Germany
2004
entering the SAP Market
providing the foundation for Content
Enterprise Content
Management
Germany
2004
entering the DACH Content
Government Market
Germany
2004
first entry point into the Experience Sweden Germany
Web Content 2009 2016
Management expanding our CEM expanding our
offering toward Experience Discovery Portfolio Discovery
output
UK
2004 management
start to build our Digital Experience
Asset Management
offering
Germany Netherlands Finland
2008 2013 2019
entry point into the foundation for out Extends OpenText
Capture Market (Océ Content Process Suite and Appworks Business Network & Cloud
Document Technologies Appworks platform Cloud Leadership
GmbH)
OpenText Confidential. ©2019 All Rights Reserved. 28The OpenText Cloud: GDPR Compliance
Amstelveen
• Organization-wide GDPR compliance
strategy
Slough
Frankfurt
• GDPR compliant data processor
Woking • Cloud Certifications e.g.
ISO27001:2013, SOC 1-3
Paris
• OpenText Product Security Assurance
Program
❖4 NOCs (T1/T2)
Munich ❖31 Data Centers
❖29 Satellite POPs
Twin Data Center Core Data Center Satellite POP
OpenText Confidential. ©2019 All Rights Reserved. 29Europe In Summary 13+ Countries
2,500 Employees
Europe Talent by Country
$920M FY18 Revenue
Germany
31 Data Centers
Great Britain
70+ Customers
France
Ireland
The Netherlands
Sweden
Russia
Spain
Switzerland
Leadership Roles in Europe
Italy
• Global Accounts
Austria • Engineering Product Management
U.A.E. • Strategic Initiatives
Other • Managed Service Practice
0 100 200 300 400 500 600 700 800 900 • Advanced Technology
OpenText Confidential. ©2019 All Rights Reserved. 30You can also read