Second Quarter 2021 Update - NYSE Stock Symbol: HAL Common Dividend $0.045 in the second quarter 2021 Shares Outstanding 890 million as of ...
←
→
Page content transcription
If your browser does not render page correctly, please read the page content below
 .045 in the second quarter 2021 Shares Outstanding 890 million as of ..." />
Second Quarter 2021 Update
NYSE Stock Symbol: HAL Investor Relations Contacts
Common Dividend Abu Zeya, Sr. Director
$0.045 in the second quarter 2021 Marina Matselinskaya, Director
Shares Outstanding (281) 871-2688
890 million as of 07/16/2021 investors@halliburton.com
© 2021 Halliburton. All rights reserved.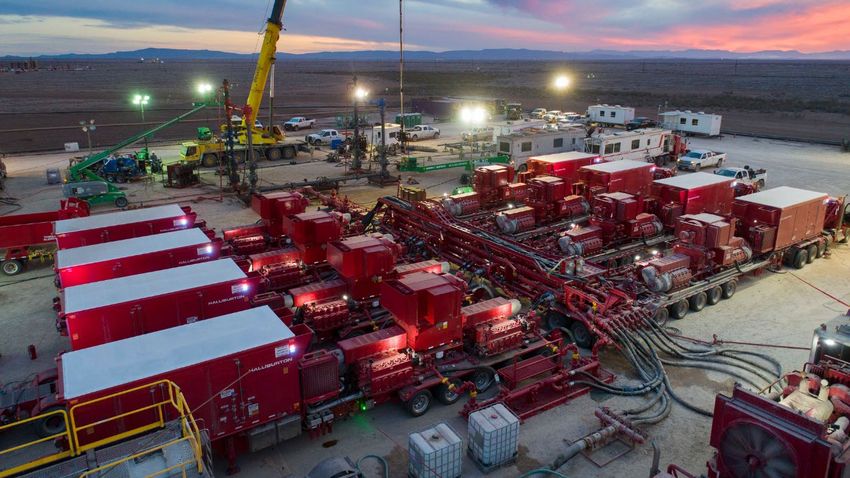 .045 in the second quarter 2021 Shares Outstanding 890 million as of ..." />
Safe Harbor

The statements in this presentation that are not historical statements, including statements regarding future financial performance, are forward-looking
statements within the meaning of the federal securities laws. These statements are subject to numerous risks and uncertainties, many of which are
beyond the company's control, which could cause actual results to differ materially from the results expressed or implied by the statements. These risks
and uncertainties include, but are not limited to: the impact of COVID-19 and any variants, the related economic repercussions and resulting negative
impact on demand for oil and gas, operational challenges relating to COVID-19 and efforts to mitigate the spread of the virus, including logistical
challenges, protecting the health and well-being of our employees, remote work arrangements, performance of contracts and supply chain disruptions;
the ability of the OPEC+ countries to agree on and comply with supply limitations; the continuation or suspension of our stock repurchase program, the
amount, the timing and the trading prices of Halliburton common stock, and the availability and alternative uses of cash; changes in the demand for or
price of oil and/or natural gas; potential catastrophic events related to our operations, and related indemnification and insurance matters; protection of
intellectual property rights and against cyber-attacks; compliance with environmental laws; changes in government regulations and regulatory
requirements, particularly those related to oil and natural gas exploration, radioactive sources, explosives, chemicals, hydraulic fracturing services, and
climate-related initiatives; compliance with laws related to income taxes and assumptions regarding the generation of future taxable income; risks of
international operations, including risks relating to unsettled political conditions, war, the effects of terrorism, foreign exchange rates and controls,
international trade and regulatory controls and sanctions, and doing business with national oil companies; weather-related issues, including the effects of
hurricanes and tropical storms; changes in capital spending by customers, delays or failures by customers to make payments owed to us and the
resulting impact on our liquidity; execution of long-term, fixed-price contracts; structural changes and infrastructure issues in the oil and natural gas
industry; maintaining a highly skilled workforce; availability and cost of raw materials; agreement with respect to and completion of potential dispositions,
acquisitions and integration and success of acquired businesses and operations of joint ventures. Halliburton's Form 10-K for the year ended December
31, 2020, Form 10-Q for the quarter ended June 30, 2021, recent Current Reports on Form 8-K and other Securities and Exchange Commission filings
discuss some of the important risk factors identified that may affect Halliburton's business, results of operations, and financial condition. Halliburton
undertakes no obligation to revise or update publicly any forward-looking statements for any reason.

© 2021 Halliburton. All rights reserved.                                      2
 .045 in the second quarter 2021 Shares Outstanding 890 million as of ..." />
Agenda
Agenda
Company Overview
Strategic Priorities
Profitable growth internationally
Maximizing value in North America
Digital (Halliburton 4.0)
Capital Efficiency
Sustainable Energy Future
Financial Review
© 2021 Halliburton. All rights reserved. 3 .045 in the second quarter 2021 Shares Outstanding 890 million as of ..." />
Company Overview
                                           Leading globally diversified oilfield services company

                                           We collaborate and engineer solutions to
                                           maximize asset value for our customers

© 2021 Halliburton. All rights reserved.     4
.045 in the second quarter 2021 Shares Outstanding 890 million as of ..." />
Halliburton Global Footprint

                                                                                                 Founded

                                                                                                 1919
                                                                                                 Employees

                                                                                                 40,000*
                                                                   TC
                                                                                                 130+ Nationalities
                                           TC                    TC TC

                                                                                                 Operational Countries

                                                TC
                                                     TC
                                                       TC
                                                                                            TC
                                                                                                 70
                                                                         TC
                                                                                  TC
                                                                                                 Research Centers

                                                                                       TC        12
        Locations                                                                                Corporate Headquarters

                                                                                                 Houston
                                                            TC
 TC    Technology Centers

        Corporate Headquarters

                                                                                                                    *approximate estimate

© 2021 Halliburton. All rights reserved.                                      5
.045 in the second quarter 2021 Shares Outstanding 890 million as of ..." />
Halliburton Participates in Every Stage of Oilfield Life Cycle

                   Exploration             Well Construction   Completions   Production   Abandonment

© 2021 Halliburton. All rights reserved.                           6
.045 in the second quarter 2021 Shares Outstanding 890 million as of ..." />
Halliburton Product Service Lines

                    Drilling and Evaluation (D&E)                      Integrating All Product Service Lines    Completion and Production (C&P)

             Sperry                         Drill Bits   Wireline &                                            Cementing     Completion    Production
             Drilling                      & Services    Perforating                                                           Tools      Enhancement

                                                                               Project         Landmark
                                                                             Management       & Consulting

                          Testing                   Baroid                                                             Artificial   Production
                         & Subsea                                                                                        Lift        Solutions

© 2021 Halliburton. All rights reserved.                                                  7
.045 in the second quarter 2021 Shares Outstanding 890 million as of ..." />
Strategic Priorities at a Glance

                                               Profitable Growth                                Maximizing Value in
                                                                                                                                             Digital (Halliburton 4.0)
                                               Internationally                                  North America
                                           » Substantial global footprint                   » The leading position                      » Leading software provider
                                           » Competitive technology portfolio               » Integrated premium provider               » Digitalizing the value chain
                                           » Grow Production businesses                     » Efficient service delivery                » Enhance business opportunities
                                           » Profitable growth                              » Maximize free cash flow                   » Drive internal efficiencies
   Deliver industry-
   leading returns
   and strong free
   cash flow                                                      Capital Efficiency                                 Sustainable Energy Future
                                                              » Structurally lower capital intensity           » Help customers decarbonize legacy
                                                              » Driven by advances in technology                 production base

                                                              » Support stronger Free Cash Flow                » Commitment to SBTi targets to reduce
                                                                generation                                       own emissions
                                                                                                               » Advance clean energy solutions through
                                                                                                                 Halliburton Labs

© 2021 Halliburton. All rights reserved.                                                8
.045 in the second quarter 2021 Shares Outstanding 890 million as of ..." />
Profitable Growth Internationally
Balance growth with improving
margins and returns
© 2021 Halliburton. All rights reserved. 9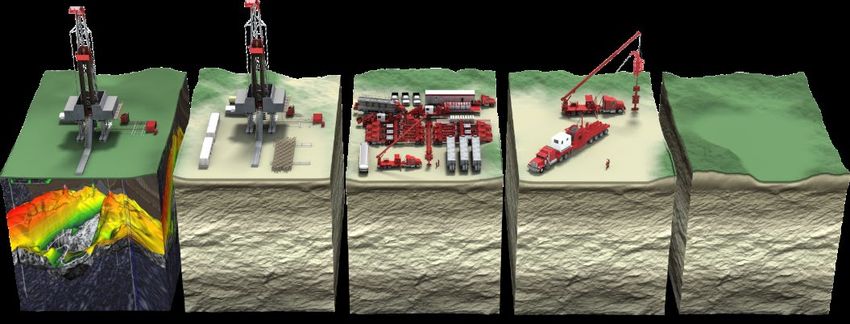 .045 in the second quarter 2021 Shares Outstanding 890 million as of ..." />
Profitable Growth Internationally
Portfolio strength drives market outperformance
2Q 2021 Revenue International Revenue Outperformance
Compared to Rig Count
150.0 1Q17 = 100
125.0
42%
104
100.0
58%
78
75.0
50.0
North America International 1Q17 3Q17 1Q18 3Q18 1Q19 3Q19 1Q20 3Q20 1Q21 2Q21
HAL Int'l Revenue Index Int'l Rig Index
HAL earned the majority of our
International margin recovery underway
revenue internationally in 2Q21.
© 2021 Halliburton. All rights reserved. 10Competitive Technology Portfolio
Maximize your Asset Value
iCruise® EarthStar® FlexRite® Multi-branch Artificial Lift and
Intelligent Drilling System Ultra-deep Resistivity Sensor Completions System Specialty Chemicals
Significant market penetration Rapid international adoption A clear leader in the Ongoing international
offshore completions expansion – Middle East,
Fully automated – capability to Unique digital 3D inversion
market Latin America
reduce rig site personnel capabilities help discover
more reserves 100+ systems installed to Specialty chemicals plant
Modular design compresses
date with 100% reliability under construction in Saudi
R&M time/cost and increases Highest depth of investigation
Arabia
asset velocity in the industry (captures 200 Integrates sand control and
feet around the wellbore) intelligent SmartWell®
reservoir controls for
increased production in new
© 2021 Halliburton. All rights reserved. 11
and existing wellsMaximizing Value in North America Remain leader and maximize free cash flow © 2021 Halliburton. All rights reserved.
All-Electric
Fracturing Site
High Horsepower Solution
First true 5,000HHP pump
8 pumps / 40,000HHP
All Electric Location
Electric wireline
Electric blender
Electric Technical Command Center
Electric pumpdowns
Power Agnostic
Grid / reciprocal engines (VoltaGrid) /
large turbine The First Fully Electric 40,000-
HHP Frac Site
© 2021 Halliburton. All rights reserved. 13SmartFleet™ Intelligent Fracturing System Real-time fracture control while pumping Connected to the Subsurface Live 3D Visualization Control While Pumping Equipped with fiber optics to Real-time measurements and Real-time decisions and commands autonomously adapt and respond to projections for a direct line of sight to to improve fracture placement and real-time reservoir measurements fracture geometry and performance mitigate well interactions © 2021 Halliburton. All rights reserved. 14
Integrated Completions

             ExpressKinect™                   Velocity™ Modular                    EcoSeal
               Quick Latch                  Perforating Gun System            Greaseless Wireline             E-Winch
                     Faster and safer          Safer and more reliable        Faster, safer and reduces     Faster, safer and
                                                                                environmental impact       improves reliability

                                                               29%
                                                  Perforating Runs             Stage Transition Time      Non-Productive Time
            Stage Transition Time
                                                    per Misrun
                                  19%                         4x                             26%                       13%
                                                                                                                       13%

          NAL Avg                 w/ EKQL       Standard    Velocity              NAL Avg w/ EKQL &       NAL Avg w/ E-Winch
                                                                                           EcoSeal
© 2021 Halliburton. All rights reserved.                                 15
Digital (Halliburton 4.0)
Transforming the way we work to make a
quantum leap in productivity
© 2021 Halliburton. All rights reserved.HALLIBURTON 4.0
Subsurface 4.0 Well Construction 4.0 Reservoir Recovery 4.0
Evergreen subsurface at planet scale Optimize well program Optimize capacity
Adaptive risk & uncertainty Automate drilling Maximize uptime
Agile field development Lean supply chain Increase recovery
Enterprise 4.0
Process and workflows Data and analytics
Digital Partners Cloud Smart tools
Solutions Partners
© 2021 Halliburton. All rights reserved. 17Capital Efficiency
Structurally lower capital intensity and generate
strong free cash flow
© 2021 Halliburton. All rights reserved.Capital Efficiency
Lower Capital Intensity Strengthen FCF Profile
CAPEX at 5-6% of revenue ~$1.3B average annual FCF*
(2017-2020)
Equipment design Higher asset velocity
enhancements Digital technologies
New materials Changing portfolio mix
CAPEX as % of Revenue
11.4%
7.2%
5-6%
2009-14 2015-19 2020 and
Beyond
* See slide 28 for reconciliation of Cash Flows from Operating Activities to Free Cash Flow.
© 2021 Halliburton. All rights reserved. 19Sustainable Energy Future
Delivering affordable and reliable energy while
lowering overall emissions
© 2021 Halliburton. All rights reserved.Sustainable Energy Future
Decarbonize Legacy
Production Base Reduce Emissions Halliburton Labs
Committed to provide technologies Committed to reduce Scope 1 & 2 A clean energy accelerator based at
that reduce emissions / emissions 40% by 2035 from 2018 Halliburton Houston headquarters
environmental footprint baseline Access to knowledge and opportunity
Collaborate with customers on Provide disclosures in the Annual & to develop sustainable, affordable
environmental footprint tracking Sustainability report energy – building optionality
Utilize current invested capital and
infrastructure
© 2021 Halliburton. All rights reserved. 21Financial Results
Second Quarter 2021
© 2021 Halliburton. All rights reserved.2Q21 Revenue Breakdown
North America
Middle East/Asia
North America revenue in the second quarter of 2021
Middle East/Asia revenue in the second quarter of
was $1.6 billion, a 12% increase when compared to the
2021 was $925 million, a 5% increase sequentially,
first quarter of 2021. This increase was primarily driven
resulting from improved activity in multiple product
by higher pressure pumping services, drilling-related
service lines in Saudi Arabia, higher well intervention
42% services, and wireline activity in North America land, as
services across the region, increased drilling-related
25% well as higher well construction activity in the Gulf of
services in Oman, higher completion tools sales in
Mexico. Partially offsetting these increases were
Kuwait, higher well construction activity in Australia,
reduced software sales across the region.
and increased pipeline services in China. These
improvements were partially offset by lower software
sales across the region, lower project management
activity in India, and lower activity in Bangladesh.
18% 15%
Latin America
Europe/Africa/CIS Latin America revenue in the second quarter of 2021 was
Europe/Africa/CIS revenue in the second quarter of 2021 was $679 $534 million, flat sequentially. Increased activity in
million, a 7% increase sequentially, resulting from increased activity multiple product service lines in Mexico, higher fluid
across multiple product service lines in Russia, Norway, Algeria, and services in Brazil, as well as additional completion tools
Ghana. These increases were partially offset by lower software sales in Guyana, were offset by reduced stimulation
sales across the region and lower activity in Nigeria. activity in Argentina, Mexico, and Brazil, lower software
sales across the region, and decreased project
management activity in Mexico and Ecuador.
© 2021 Halliburton. All rights reserved. 23Segment and Geographic Results
Millions of dollars
© 2021 Halliburton. All rights reserved. 24Financial Metrics
Total Revenue (Normalized) Return on Capital Employed(a)
Peer Group (b) HAL HAL Peer Group(b)
150
140 1Q17 = 100
130
11%
120
110 8%
7% 7% 7%
100
90 4% 4%
80 3% 3% 3%
70
60
1Q17 3Q17 1Q18 3Q18 1Q19 3Q19 1Q20 3Q20 1Q21 2Q21 2017 2018 2019 2020 2Q21 TTM
Debt Maturity Profile ($MM)(c) Adjusted Free Cash Flow* ($MM)
$1,439
$1,349
$1,253 $1,271
1,000 1,000 $1,105
(d) 600
500
104
2017 2018 2019 2020 2Q21 TTM
(a) Excludes certain charges. See slide 26 for reconciliation of Return on Capital Employed to Adjusted Return on Capital Employed and slide 27
for reconciliation of Cash Flows from Operating Activities to Free Cash Flow.
(b) Peer Group includes Schlumberger and Baker Hughes Company
(c) Total debt outstanding beyond 2030 is $6,500 MM
© 2021 Halliburton. All rights reserved. 25
(d) To be redeemed in August 2021Reconciliation of As Reported ROCE to Adjusted ROCE
($millions) 2017 2018 2019 2020 2Q21 TTM
As reported net income attributable to company $(463) $1,655 $(1,131) $(2,945) $145
Interest expense, after-tax 517 479 450 559 417
As reported operating profit, after-tax
$54 $2,134 $(681) $(2,386) $562
Adjustments, after-tax 1,440 5 2,215 3,530 514
Adjusted operating profit, after-tax (a) $1,494 $2,139 $1,534 $1,144 $1,076
Average capital employed (b) $20,561 $19,591 $19,243 $16,724 $15,184
As reported ROCE (c) 0% 11% (4%) (14%) 4%
Adjusted ROCE (c) 7% 11% 8% 7% 7%
(a) Management believes that operating income adjusted for certain charges is useful to investors to assess and understand operating performance, especially when comparing
results with previous and subsequent periods or forecasting performance for future periods, primarily because management views the charges to be outside of the company's
normal operating results. Management analyzes operating income without the impact of these charges as an indicator of performance, to identify underlying trends in the
business, and to establish operational goals. See slide 25 for further details on these adjustments, pre-tax.
(b) Average capital employed is a statistical mean of the combined values of debt and shareholders’ equity for the beginning and end of the period.
(c) As reported return on capital employed (ROCE) is calculated as: “As reported operating profit, after-tax” divided by “Average capital employed.” Adjusted ROCE is calculated as:
“Adjusted operating profit, after-tax” divided by “Average capital employed.”
© 2021 Halliburton. All rights reserved. 26Reconciliation of Cash Flows from Operating Activities to Free Cash Flow
($millions) 2017 2018 2019 2020 2Q21 TTM
Total cash flows provided by (used in) operating activities $2,468 $3,157 $2,445 $1,881 $1,670
Capital expenditures
(1,373) (2,026) (1,530) (728) (668)
Proceeds from sales of property, plant, and equipment 158 218 190 286 269
Free cash flow (a) $1,253 $1,349 $1,105 $1,439 $1,271
(a) The Free Cash Flow metric is a non-GAAP financial measure, which is calculated as “Total cash flows provided by operating activities” less “Capital expenditures” plus
“Proceeds from sales of property, plant, and equipment.” Management believes that Free Cash Flow is a key measure to assess liquidity of the business and is
consistent with the disclosures of our direct, large-cap competitors. Prior periods presented are consistent with this metric.
© 2021 Halliburton. All rights reserved. 27Why Invest in Halliburton? Strong international business and the only integrated service provider in North America Driving new business opportunities and efficiencies through digital (Halliburton 4.0) Unique growth opportunities in specialty chemicals and artificial lift businesses Advancing a sustainable energy future for our customers, our Company, and all our stakeholders Committed to capital efficiency and delivering industry- leading returns and strong free cash flow © 2021 Halliburton. All rights reserved. 28
You can also read