ROCOF AND ENHANCED FREQUENCY CONTROL CAPABILITY RESERVE MODELLING - ENERGY EXEMPLAR
←
→
Page content transcription
If your browser does not render page correctly, please read the page content below

RoCoF and Enhanced Frequency
Control Capability Reserve
Modelling
PLEXOS User Group Meeting, Valencia
12 June 2019

Copyright © Baringa Partners LLP 2019. All rights reserved. This document is subject to contract and contains confidential and proprietary information.
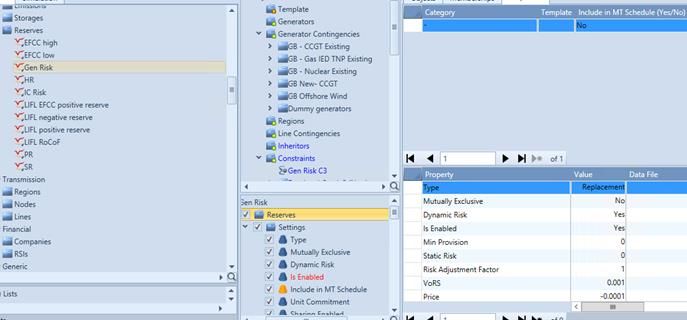
Table of contents

                        A                     Overview of Baringa                                                                                         3

                         B                    Project background and PLEXOS modelling                                                                     6

                         C                    EFCC CBA analysis overview                                                                                  20

                        D                     Key CBA results                                                                                             23

Copyright © Baringa Partners LLP 2019. All rights reserved. This document is subject to contract and contains confidential and proprietary information.        2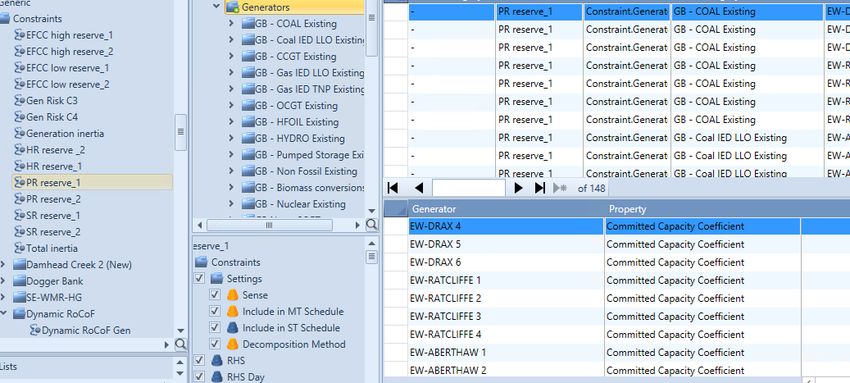
Overview of Baringa Partners
Baringa Partners is a
market-leading consulting Our Our
company with a focus on the We bring Collaboration independence award-winning
We all roll up
challenges of tomorrow, deep industry runs through means we culture
our sleeves to
operating in the Utilities, Energy experience to everything provide attracts the
deliver
& Resources, Financial Services, client projects we do impartial brightest
advice people
Telco and Consumer Retail
sectors.
We help clients using our deep Baringa was founded in 2000 and now has:
industry insight to:
Run more effective businesses
600 Employees 60 Partners 6 Offices worldwide
Launch new businesses and UK, Germany,
reach new markets Ireland,
Understand and navigate Australia, UAE
industry change. and USA
We have worked with energy Our reputation is hard won and we’re determined to
companies & utilities across:
keep it growing.
Strategy and regulation
Energy market analysis
Customer Values Analysis
Commercial Strategies
Operating model design
Operational excellence
Back office transformation
Technical and Digital
architecture and Solutions
Copyright © Baringa Partners LLP 2019. All rights reserved. This document is subject to contract and contains confidential and proprietary information. 3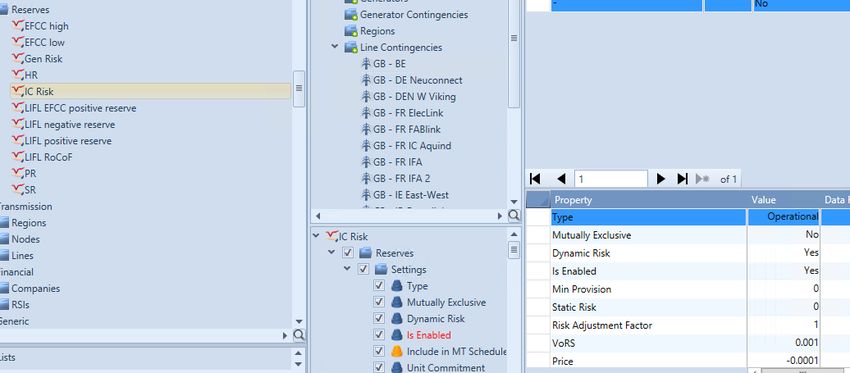
Baringa Overview – locations and client coverage
We maintain regularly updated models for Europe and Australia as well as a wide range of geographies

                                                                                                Baringa Office Locations
                                                                                                UK | Ireland | Germany | N America | UAE | Australia

                                                                                                Baringa Client Project Locations

Copyright © Baringa Partners LLP 2019. All rights reserved. This document is subject to contract and contains confidential and proprietary information.   4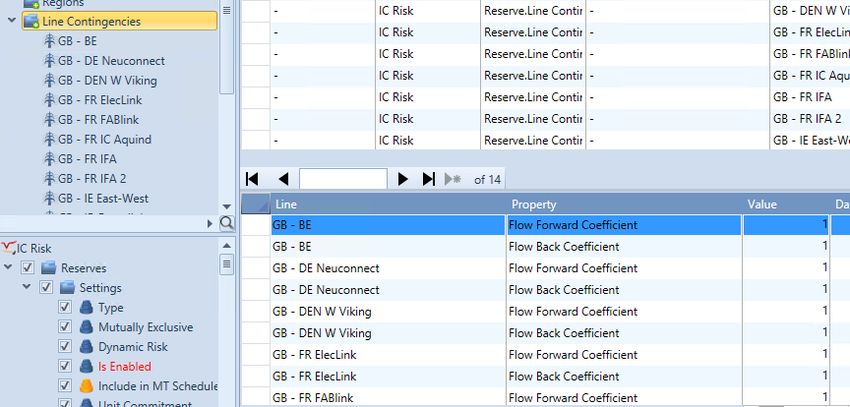
Table of contents

                        A                     Overview of Baringa                                                                                         3

                         B                    Project background and PLEXOS modelling                                                                     6

                         C                    EFCC CBA analysis overview                                                                                  20

                        D                     Key CBA results                                                                                             23

Copyright © Baringa Partners LLP 2019. All rights reserved. This document is subject to contract and contains confidential and proprietary information.        5
Project background

       As Great Britain’s (GB) electricity sector becomes increasingly decarbonised, traditional thermal power stations are closing
       and a rising number of inverter based technologies, such as wind and solar photovoltaic (PV), are connecting to the
       network. This creates several operability challenges, one of which is reducing system inertia
       Thermal power stations have traditionally provided system inertia, which acts as a natural aid to maintaining system
       frequency, so removing them from the system will impact how frequency is managed. System frequency is a measure of
       the balance between electrical power generated and consumed. In GB, the electricity system frequency is nominally 50Hz
       and the National Electricity Transmission System Operator (NETSO) balances generation and demand in real-time
       Lower system inertia means that after a frequency disturbance, there is a faster rate of change of frequency (RoCoF). This
       increases the unpredictability and volatility of system frequency movement across the network immediately after an event.
       Consequently, the speed, volume and degree of coordination of frequency response must increase to keep frequency
       within acceptable parameters
       The Enhanced Frequency Control Capability (EFCC) project by National Grid has been designed to find a resolution to this
       electricity system challenge. The aim of the EFCC project was to develop and demonstrate an innovative new monitoring
       and control system (MCS) which obtains accurate frequency data at a regional level, calculates the required rate and
       volume of fast response and then enables the initiation of this required response within 0.5 seconds of a detected system
       frequency event
       The project was a collaboration between NGESO, GE Renewable Energy (formally known as Alstom Psymetrix), the
       University of Manchester, the University of Strathclyde, BELECTRIC, Flexitricity, Centrica/EPH, Ørsted (formally known as
       DONG Energy) and Siemens Gamesa Renewable Energy. All the partners, including NGESO, were responsible for particular
       work package(s) which denoted their areas of expertise and knowledge
       Baringa was asked to develop a cost and benefit analysis to assess the potential benefits of dispatching faster frequency
       response through EFCC to the industry and consumers

Copyright © Baringa Partners LLP 2019. All rights reserved. This document is subject to contract and contains confidential and proprietary information.   6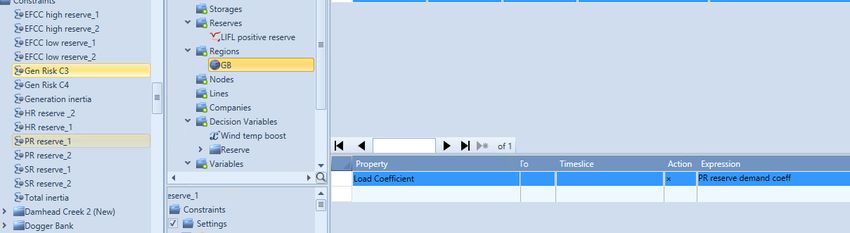
Technical background: Faster RoCoF
Inertia provide a natural response to a frequency event reducing RoCoF (rate of change of
frequency) and the response required to re-address system frequency
         Under current conditions – high inertia and RoCoF of 0.125 Hz/s – a frequency event (1) is managed by a combination of the inertia provided by synchronous
         generation in the short-term (i.e. within the first 2 seconds (2)) by which time traditional response provides (typically thermal) have been deployed to manage the
         frequency event (3). This is show by the pink line and pink shaded area below.
         Faster RoCoF falls is shown by the grey line (4). The impact of a frequency event, for example the loss of a power station, is now faster and larger than before. As
         system inertia is now lower, this cannot provide the same natural response in the sub-2 seconds timeframe. Traditional response providers (5) cannot respond
         fast enough to arrest the frequency drop, resulting in a frequency drop below the current limits (6). With traditional response times, faster RoCoF is therefore
         infeasible, and/or would require a greater volume of response overall to counteract the faster RoCoF.
                                        1 Frequency event –
                                               loss of generation
                                                                                                                                                          Target Nominal System Frequency
                                  50.0 Hz
                                                                                   2
                                                                                        RoCoF=0.125Hz/s:
                     Frequency

                                                                                        Frequency drop of
                                                                                        0.25Hz in 2 seconds
                                 49.75 Hz
                                                 4
                                                    RoCoF=0.25Hz/s:
                                                   Frequency drop of
                                                   0.5Hz in 2 seconds                                                                                                     Statutory limit
                                  49.5 Hz

                                    MW                                                    6                  Infeasible
                                  additional                                                                                                  5
                                   output
                                                                                                                                   Traditional primary      Secondary response
                                                                                                                                             response
                     Response

                                                                                                                    Traditional primary
                                                                                                                                                             Secondary response
                                                                                                            3       response

                                                                                                                                                                                            Time
                                                                        t          t+2s           t+4s                       t+10s                                                                 7
Copyright © Baringa Partners LLP 2019. All rights reserved. This document is subject to contract and contains confidential and proprietary information.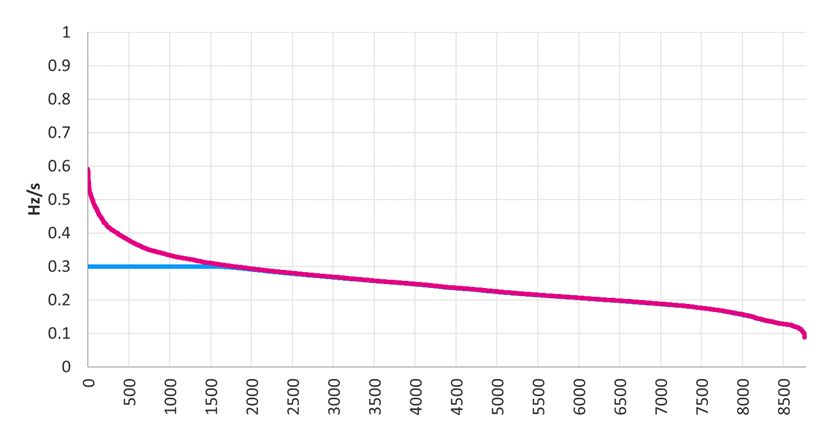
Technical background: EFCC impact
With EFCC, the faster and more targeted response can help to address the faster RoCoF, reducing
the overall volume of response required to arrest the frequency event.
         With EFCC, a RoCoF of 0.250 Hz/s (7) can be managed more effectively by using faster response (8), able to arrest the frequency drop in the 2 second gap
         between the frequency event and traditional primary response (9).
         The fast EFCC response will arrest the frequency deviation quickly, hopefully preventing the frequency falling outside the limits. This faster response should
         therefore reduce the volume of response required to bring frequency back up to target levels (10 and 11).

                                               Frequency event –
                                                loss of generation
                                                                                                                                                               Target Nominal System Frequency
                                  50.0 Hz
                                                                                                                                                          11
                     Frequency

                                 49.75 Hz
                                                                       7
                                                     RoCoF=0.25Hz/s

                                                                                          10                                                                                    Statutory limit
                                  49.5 Hz

                                                                                                             Infeasible

                                                                                                                                    Traditional primary            Secondary response
                                    MW                                                                                                        response
                     Response

                                  additional
                                   output
                                                                             8                                               Traditional
                                                                                   EFCC response                             response
                                                                                                                9                                              Secondary response

                                                                                                                                                                                                  Time
                                                                        t          t+2s           t+4s                         t+10s
Copyright © Baringa Partners LLP 2019. All rights reserved. This document is subject to contract and contains confidential and proprietary information.                                                  8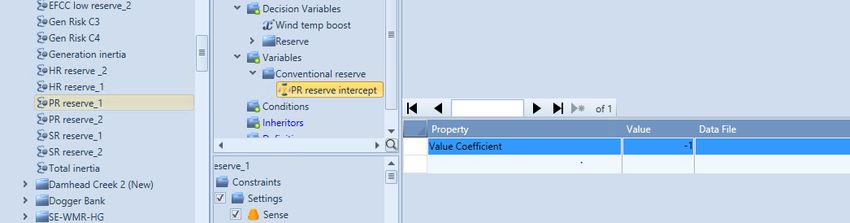
Technical background: EFCC benefit summary
The benefit of EFCC can be seen in the chart

  The high level benefits of EFCC are shown diagrammatically below:
         A to B – Faster RoCoF can now be accommodated, reducing the re-dispatch costs (from either reducing the largest infeed loss and/or from re-dispatching to get
         more synchronous generation on the system).
         C to D – Faster acting EFCC response is able to more quickly arrest the frequency drop reducing the volume of response required to bring frequency back to target
         levels.

                                               Frequency event –
                                                loss of generation
                                                                                                                                                          Target Nominal System Frequency
                                  50.0 Hz
                     Frequency

                                                                                                RoCoF=0.125Hz/s

                                 49.75 Hz                                                A

                                                    RoCoF=0.25Hz/s
                                                                            B
                                                                                                                                                                          Statutory limit
                                  49.5 Hz

                                                                                                             Infeasible

                                    MW
                     Response

                                  additional
                                   output                                                                                   C      Traditional response
                                                                                                         D
                                                                                                            Traditional primary                             Secondary response
                                                                                       EFCC + traditional response
                                                                                                            response

                                                                                                                                                                                            Time
                                                                        t          t+2s           t+4s                       t+10s
Copyright © Baringa Partners LLP 2019. All rights reserved. This document is subject to contract and contains confidential and proprietary information.                                            9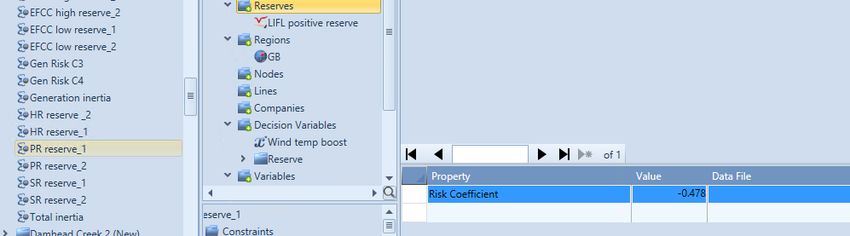
Managing RoCoF limit

           2 * RoCoF limit * (System inertia – inertia of Largest Infeed Loss) >= Frequency * Largest Infeed Loss

          The ROCOF limit can be managed by decreasing largest
        infeed or increasing system inertia. Decreasing the largest
           infeed is a less costly option and is what is done more
                                   frequently

              Decreasing levels of inertia projected going forward in the
               National Grid SOF 2018 (system operability framework)

Copyright © Baringa Partners LLP 2019. All rights reserved. This document is subject to contract and contains confidential and proprietary information.   10
PLEXOS modelling approaches and features used
Modelling RoCoF Gen and RoCoF IC constraints
Decision variables heavily deployed! (Over 50): Decision Variable objects are useful when you need to define a constraint
on an aspect of the simulation that is not definable with the default constraint coefficients
RoCoF modelling: Tracking interconnector and generation RoCoF constraints. This can be important in the cases where an
interconnector can be the largest infeed however losing a generator of comparable size might have a bigger impact on the
frequency due to inertia
– RoCoF Gen constraint:
2 * RoCoF limit * (System inertia – inertia of Largest Infeed Loss) >= Frequency * Gen Risk
– RoCoF IC constraint:
2 * RoCoF limit * System inertia >= Frequency * IC Risk
Gen risk and IC risk are defined as reserve objects with the set of generator and line contingencies defined, respectively. In
the case of generator contingencies, the largest generation unit can set the gen risk and in the case of line risk, the largest
flow (both import and export direction) can set the IC risk.
Copyright © Baringa Partners LLP 2019. All rights reserved. This document is subject to contract and contains confidential and proprietary information. 11PLEXOS modelling approaches and features used
Modelling IC risk
2 * RoCoF limit * System inertia >= Frequency * IC Risk
Modelling IC risk:
Copyright © Baringa Partners LLP 2019. All rights reserved. This document is subject to contract and contains confidential and proprietary information. 12PLEXOS modelling approaches and features used
Modelling Gen Risk and Largest Infeed Loss (LIFL)
2 * RoCoF limit * (System inertia – inertia of Largest Infeed Loss) >= Frequency * Gen Risk
Modelling Gen Risk:
Binary DVs created to track largest infeed and remove its inertia in the RoCoF constraint
Further DVs created to model groupings of generators considered as a single loss
Example: Saltend 1 constraints (similar constraints for SE2 and SE3):
– DV(SE1)-DV(dummy SE-WMR-HG)-Unitsgen(SE1)>=-1
– DV(SE1)-Unitsgen(SE1)PLEXOS modelling approaches and features used
Modelling inertia
2 * RoCoF limit * (System inertia – inertia of Largest Infeed Loss) >= Frequency * Gen Risk
H values (inertia coefficients) for generators
Copyright © Baringa Partners LLP 2019. All rights reserved. This document is subject to contract and contains confidential and proprietary information. 14RoCoF and inertia modelling
The RoCoF and inertia modelling optimises largest infeed re-dispatch actions to manage the
system within the required RoCoF limit
RoCoF assumptions
The fast response from EFCC is a system enabler, allowing the system to operate at a faster RoCoF.
The main EFCC benefit in the CBA is derived from enabling this RoCoF limit change, and the resulting benefit from reduced system actions. The RoCoF
limits used in the modeling are shown in the table below.
Without EFCC, we With EFCC, we assume
assume the system can the system can manage a
manage a 0.2Hz/s RoCoF 1Hz/s RoCoF
RoCoF limit (Hz/s) 2019 2020 2021 2022 2023 2024 2025 2026 2027 2028
Counterfactual 0.125 0.125 0.200 0.200 0.200 0.200 0.200 0.200 0.200 0.200
Factual-EFCC case 0.125 0.125 1.000 1.000 1.000 1.000 1.000 1.000 1.000 1.000
Interconnector assumptions Generator groupings
Interconnectors are commonly the largest infeed on the system, and The RoCoF modelling takes into account the impact of generator
therefore constraining down flows on interconnectors is a key tool for transmission connection groupings and the impact this has on the
managing RoCoF. largest infeed (i.e. the extent to which a credible loss on the
transmission system could result in a RoCoF event exceeding the
To simulate this, we first model an unconstrained market to calculate
RoCoF limit).
the cross-border flows for each hour (i.e. based on economic
dispatch). Then, we use these unconstrained market results to set the The Baringa model takes into account the local RoCoF groups
interconnector flows for the constrained market run (i.e. applying the identified by National Grid in ‘The Statement of the Constraint Cost
RoCoF constraints). Target Modelling Methodology’ (Immingham, Saltend, Seabank and
South Humber Bank).
We limit the re-dispatch of interconnectors for RoCoF management to
50 % of interconnector capacity. We also assume a fixed cost of
interconnector re-dispatch of £25/MWh.
Copyright © Baringa Partners LLP 2019. All rights reserved. This document is subject to contract and contains confidential and proprietary information. 15Response modelling – response volumes
The response modelling sets the demand for each response service using regression analysis of
the relationship between demand, inertia, infeed and static response.
The CBA takes into account the impact of EFCC in two areas. First, EFCC is an enabler for the transition to RoCoF of 1.0Hz/s from
2021. Second, EFCC will compete with other existing response providers for traditional response timeframes – Primary, Secondary
and High response
Primary, Secondary, High
The EFCC response modelling considers the volume of response available from the EFCC technologies, the response timeframes for
the different technologies and the impact this has on response holding across different response timeframes
In the counterfactual, without EFCC, we assume that National Grid procures traditional frequency services:
• Primary (Max delivery by 10s after a frequency event)
• Secondary (Max delivery by 30s after a frequency event)
• High (Max delivery by 10s after a frequency event)
To model the EFCC response we also assume a response holding requirement at 0.5s (defined as EFCC in this section), and
modelled in addition to the primary and secondary requirements:
• EFCC (Max delivery by 0.5s after a frequency event)
Regression analysis: To calculate response holding volumes we derived a relationships between demand, inertia, largest loss and
static volume
This regression analysis provided coefficients for each variable which we have used in our model to calculate the required response
holding requirements for each hour
In-feed/ex-
Response Demand Inertia
feed loss
Copyright © Baringa Partners LLP 2019. All rights reserved. This document is subject to contract and contains confidential and proprietary information. 16PLEXOS modelling approaches and features used
Modelling reserve using custom constraints
Reserve modelling: We have modelled reserve requirement through custom constraints rather than using the reserve
object as the reserve formula for traditional response took the following form which is not possible to model using the
reserve object:
PR= A – B x demand – C x inertia +D x infeed loss – E x static response – F x EFCC provision – G x EFR provision
Definition of reserve risk in PLEXOS is as below:
Example modelling of primary response using custom constraints:
Created a decision variable with an objective
function value so that it is minimised to avoid
over-provision
Copyright © Baringa Partners LLP 2019. All rights reserved. This document is subject to contract and contains confidential and proprietary information. 17PLEXOS modelling approaches and features used
Modelling LIFL, demand and intercept components of the reserve in the custom constraint
Modelling inertia component of the reserve:
LIFL coefficient
Demand coefficient
Intercept defined as a variable with a
coefficient of 1
Copyright © Baringa Partners LLP 2019. All rights reserved. This document is subject to contract and contains confidential and proprietary information. 18Table of contents
A Overview of Baringa 3
B Project background and PLEXOS modelling 6
C EFCC CBA analysis overview 20
D Key CBA results 23
Copyright © Baringa Partners LLP 2019. All rights reserved. This document is subject to contract and contains confidential and proprietary information. 19Overview of Baringa’s CBA approach
The CBA includes a counterfactual model run and a ‘test case’ to show the impact of a change in
RoCoF limits and the introduction of EFCC
1
Replicate FES Steady State and
Consumers Power in Baringa’s
in-house dispatch model 2019-
2028
Traditional
MFR and
FFR Counterfactual EFCC impact “test case” Sunk Costs
providers of
Primary,
2 5
Secondary
Run Baringa model with
and High Re-run the analysis allowing
existing RoCoF constraint and
response faster RoCoF
traditional response providers 8
3 6 Costs of installing
Calculate cost of system Calculate change in system
and maintaining EFCC
actions required to meet the actions required to meet
(for NG and industry)
current RoCoF constraint faster RoCoF
∆ in total
4 system 7
costs = Subtracted from
Calculate the response
Calculate response holding market benefit to reveal
holding requirements with
requirements total net effect
impact EFCC capabilities
of EFCC
Move to 1
Hz/s in 2021
Copyright © Baringa Partners LLP 2019. All rights reserved. This document is subject to contract and contains confidential and proprietary information. 20Roll-out profile – explanatory slide
Example the response and EFCC assumptions used in the study
Example roll-out – to explain the assumptions slides
Total capacity taken from the FES
for all technologies De-load: maximum volume the generator can reduce
output to offer response service (no change over time)
Counterfactual De-load Response Response: Proportion
of de-load that counts
Low response 45% 100% towards response
High response 0% 100% provision at each
timeframe (i.e. 10 and
30s)
EFCC De-load Response
EFCC boost (low) 0% 1.5% We assume an EFCC
boost for onshore and
EFCC (low) 45% 10% offshore wind only,
with a small response
EFCC (high) 0% 10% at 0.5s
The de-load and potential response approach is the same
Response capability is the MW of total The EFCC response capability is the MW
for traditional response and EFCC. For EFCC we show the
capacity assumed to be able to offer of total capacity that can offer EFCC
assumed response from each technology at 0.5s
traditional response (primary, capability (i.e. some response at 0.5s)
secondary and high) The EFCC assumptions are combined with the
The actual EFCC response will be a
counterfactual/traditional response assumptions in the
The actual response provided by each function of this assumption and the
EFCC case (i.e. EFCC is additional to traditional response)
technology will be a function of the assumed EFCC response (shown in the
response capability, and the assumed blue table)
service response (shown in the pink
table)
Copyright © Baringa Partners LLP 2019. All rights reserved. This document is subject to contract and contains confidential and proprietary information. 21Table of contents
A Overview of Baringa 3
B Project background and PLEXOS modelling 6
C EFCC CBA analysis overview 20
D Key CBA results 23
Copyright © Baringa Partners LLP 2019. All rights reserved. This document is subject to contract and contains confidential and proprietary information. 22RoCoF duration curves
RoCoF duration curves provide a clear indication of the potential benefits of moving to higher
RoCoF using EFCC
2025 RoCoF duration curve
Unconstrained
market run RoCoF
duration curve
RoCoF limit is set
to 0.3 Hz/s in the
constrained case
Copyright © Baringa Partners LLP 2019. All rights reserved. This document is subject to contract and contains confidential and proprietary information. 23RoCoF duration curves
RoCoF duration curves provide a clear indication of the potential benefits of moving to higher
RoCoF using EFCC
2025 RoCoF duration curve
Modelling a RoCOF limit of 0.2 Hz/s in the
counterfactual increases the number of hours
where the RoCoF limit is binding significantly,
therefore results in increased benefit from
moving to higher RoCoF using EFCC
Copyright © Baringa Partners LLP 2019. All rights reserved. This document is subject to contract and contains confidential and proprietary information. 24RoCoF duration curves
RoCoF duration curves provide a clear indication of the potential benefits of moving to higher
RoCoF using EFCC
2025 RoCoF duration curve
Modelling a RoCoF limit of 0.125 Hz/s (as
is the case today) means the RoCoF limit
is binding almost throughout the year
Copyright © Baringa Partners LLP 2019. All rights reserved. This document is subject to contract and contains confidential and proprietary information. 25Inertia distribution – Consumer Power
These charts show how system inertia changes over the modelling horizon in Consumer Power.
2021 In the Consumer Power scenario, the significant volume
of renewables results in a larger difference in inertia
distribution between the unconstrained run and the
Low RoCoF run (i.e. the system needs more re-dispatch
actions to meet the RoCoF constraint)
The modelling shows this as a greater move in the
inertia distribution curve between the unconstrained
run and Low RoCoF run
2028
Copyright © Baringa Partners LLP 2019. All rights reserved. This document is subject to contract and contains confidential and proprietary information. 26High level benefits comparison – Consumer Power
For the Consumer Power scenario with significant renewable capacity, the CBA shows a material
benefit to deploying EFCC and enabling faster RoCoF
Consumer Power – breakdown of benefits Key messages
Total change in generation costs
The change in generation costs reflects the total
system cost change with a move to faster RoCoF.
This include GB and connecting market generation
costs, plus an assumed cost of interconnector re-
dispatch (as shown below)
Social cost of carbon
Our modelled generation costs takes into account the
cost of carbon for each generator. Here we add in the
social cost of carbon, from the Treasury green book to
account for wider benefits to society
This only reflects the GB portion of carbon savings (i.e.
does not take into account the change in carbon in
connecting markets)
Renewable curtailment costs
At a faster RoCoF, the system can accommodate a
greater volume of renewables. This reduces the cost
or renewables curtailment, represented by a benefit in
the CBA.
Total ‘European’ We calculate this using the change in wind and solar
GB generation multiplied by an assumed balancing bid
generation costs IC re- Total
generation cost (£50/MWh onshore wind, £100/MWh offshore
costs (GB, NL, SEM, dispatch generation
wind & solar)
FR, BE, NO, DK) costs cost
Link: https://www.nationalgrideso.com/document/126486/download
Copyright © Baringa Partners LLP 2019. All rights reserved. This document is subject to contract and contains confidential and proprietary information. 27Contacts at Baringa Partners:
Adrian Palmer Baringa Partners LLP Ozlem Akgul Baringa Partners LLP
3rd Floor, Dominican Court 3rd Floor, Dominican Court
Director 17 Hatfields Senior Consultant 17 Hatfields
London SE1 8DJ London SE1 8DJ
United Kingdom United Kingdom
adrian.palmer@baringa.com ozlem.akgul@baringa.com
mobile +44 7904 279 887 www.baringa.com mobile +44 7800 864 508 www.baringa.com
Baringa Partners is an independent business and technology consultancy.
We help businesses run more effectively, reach new markets and navigate
industry shifts. We use our industry insights, pragmatism and original thought to
help each client transform their business.
Collaboration runs through everything we do. Collaboration is the essence of our
strategy and culture. It means the brightest and the best enjoy working here.
Baringa. Brighter Together.
Copyright © Baringa Partners LLP 2019. All rights reserved. This document is subject to contract and contains confidential and proprietary information. 28This report has been prepared for Baringa's client (“Client”) and has been designed to meet the agreed requirements of Client as contained in the relevant contract between Baringa and Client. It is released to Client subject to the terms of such contract and is not to be disclosed in whole or in part to third parties, altered or modified without Baringa's prior written consent. This report is not intended for general advertising, sales media, public circulation, quotation or publication except as agreed under the terms of such contract. Information provided by others (including Client) and used in the preparation of this report is believed to be reliable but has not been verified and no warranty is given by Baringa as to the accuracy of such information unless contained in such contract. Public information and industry and statistical data are from sources Baringa deems to be reliable but Baringa makes no representation as to the accuracy or completeness of such information which has been used without further verification. This report should not be regarded as suitable to be used or relied on by any party other than Client. Any party other than Client who obtains access to this report or a copy, and chooses to rely on this report (or any part of it) will do so at its own risk. To the fullest extent permitted by law, Baringa accepts no responsibility or liability in respect of this report to any other person or organisation. Copyright © Baringa Partners LLP 2018. All rights reserved.
You can also read