Roadshow presentation - Zalando Corporate
←
→
Page content transcription
If your browser does not render page correctly, please read the page content below

Roadshow
presentation
June 2020

   February 2020   Zalando Press Conference   Network: Press_Conference Password:
                   Zalando20
Agenda
Our vision:
The Starting Point for Fashion

Platform as key lever
to become the Starting Point

Our business model of the future

Executing our strategy in times of Covid-19

Q1/2020 Results

2

Our vision: To become the Starting Point for Fashion

                                 Movies & Series

                                                   Fashion

      Music

3
In 2019, we have delivered towards our ambition

             Visits                     App GMV                   GMV
            in bn #                      in bn €                 in bn €

                      +33%                         +56%                    +24%

                       4.2                                                  8.2
                                                    3.9
                                                                   6.6     +1.6
                      +1.1
             3.1                                   +1.4
                                           2.5            5.5     +1.1
    2.6     +0.5
                                  1.7     +0.8

    2017    2018      2019       2017     2018     2019   2017    2018      2019

4
Our vision is build on two key levers - Deep Customer Relationships and our
Platform Strategy

       Key lever 1                                                             Key lever 2

   Deep Customer Relationships                                     Platform Strategy

                     Assortment
                                                                         Zalando Marketing
                     Digital                                             Services
                     Experience
                                                                         Zalando Fulfillment
                     Convenience                    Starting
                                                                 ZFS     Solutions
                                                    Point for
                     Loyalty program                Fashion              Partner Program

                     Sustainability &
                     Circularity         Superior & Holistic
                                        Customer Experience

   5
Cohort analysis shows that we are creating a healthy customer base

      Total GMV per Cohort¹ and Order Year

                                                                                                                                 1. Old cohorts grow again
                                                                                                                                 over time

                                                                                                                                 2. Customer churn goes
                                                                                                                                 down

                                                                                                                                 3. Every new cohort is
                                                                                                                                 bigger than the previous
                                                                                                                                 one
         2014                         2015                        2016                         2017                2018   2019
(1)    Cohort refers to customers grouped by the calendar year in which they first placed an order with Zalando.

6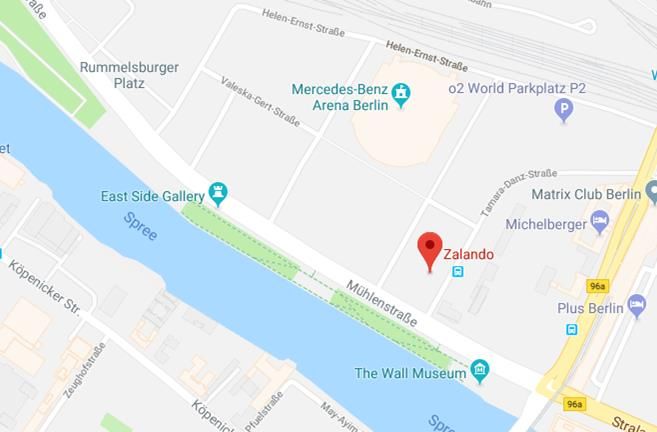
Agenda
Our vision:
The Starting Point for Fashion

Platform as key lever
to become the Starting Point

Our business model of the future

Executing our strategy in times of Covid-19

Q1/2020 Results

7

The platform strategy is one key lever towards being the Starting Point

                    Brand Benefits
                                                                         Zalando Benefits
         ●    Direct access to European
              digital consumer                                                ●   Platform adds scale to
                                                                                  Zalando
         ●    Leverage Zalando
              capabilities                                                    ●   Less inventory risk –
              (tech, data, logistics)                                             while improving
                                                                                  customer offering
                                                                                  (50% of PP volume
                                                                                  incremental)
                                                              Platform
                                                              Strategy
                                                                             Customer Benefits

                                                                              ●   Offer desirable and
                                                                                  comprehensive
                                                                                  assortment

                                                                              ●   High availability

8    Month, Year        Presentation Title // Document info
Only in partnership with our brand partners, we are able to offer a superior experience for
our customers to enjoy

         Partner Program offers growth                                                 Auction-bid pricing &
         opportunities and advantages                                                       campaigns
         to all parties
                                                                    +
                          Zalando Marketing                                Cost-Plus
                          Services

                         Zalando Fulfillment                  Commission
          ZFS            Solutions                              5%-25%       ZFS              ZFS

                          Partner
                          Program

                               Direct-to-Consumer                ✔           ✔                ✔
              Control of Product, Content & Pricing              ✔           ✔                ✔
        Superior Order Economics, Convenience to
         Consumer & Physical Access to Consumer
                                                                             ✔                ✔
               High Sell-Through & Brand Building                                             ✔
9    Month, Year        Presentation Title // Document info
In 2019, we achieved important milestones in driving the Platform Transition

                                                                                                                                                          Target-Model

                                                                                                                                                          40% PP share
                                        10%                          5%           15%
                                                                                                                                                            of FS GMV1

                                                                                                                                                        75% ZFS share
                                               ~25%                                     15%                 ~40%
                                                                                                                                                          of PP items2

                                      ~0.7%                   +0.3%          ~1%                                                                          3-4% of GMV2

                                Q4 2018                           Q4 2019                     Target model

     1)   Partner Program share of 40% refers to our business model mix ambition for 2023/24. In our long-term target model, we aim for a 50% Partner Program share.
     2)   Refers to our long-term target model ambition.

10
ZFS leveraging our European logistic network to enable PP success
7. SZCZECIN (Gryfino)
1. ERFURT
Start in 2012
Start in 2017 Create the capacity for future growth:
12 warehouses allow > 14bn GMV
8. OLSZTYNEK
2. BRIESELANG 6 Start in 2019
Start in 2011 Get closer to our customers:
We will deliver 30% of orders
9. LODZ (Gluchow)
3. MÖNCHENGLADBACH
Start in 2013
Start in 2019 on the next day by 20201
7 8
2
9
3
4. LAHR 12 1 10. VERONA (Nogarole Rocca) Scale a differentiating asset which
Start in 2020
Start in 2016
4
we can open up to brand partners
5
10 11. MILANO (Stradella)
5. PARIS 11
Start in 2016
(Moissy-Cramayel)
Start in 2016
12. ROTTERDAM (Bleiswijk)
6. STOCKHOLM Start in 2021
Start in 2018
(1) 3pm cutoff time
11 Month, Year Presentation Title // Document infoWe offer a broad range of payment methods and logistic partners
to satisfy local customer preferences
Payment Methods Countries Logistic partners
INVOICE
PREPAYMENT
22 different payment methods Our presence in 17 countries 25 domestic carrier integrations, 2
requires localization express carrier, 14 same day
destinations
12 Month, Year Presentation Title // Document infoConnecting brands to consumers with Zalando Marketing Services
Brands Zalando Marketing Services Consumers
Influencer Products (Collabary)
Consumer Insights
Media Products
No. of campaigns
>37m female unique visitors
>1000m visits per quarter
>31m active customers
2016 2017 2018 2019
13 Month, Year Presentation Title // Document infoAgenda Our vision: The Starting Point for Fashion Platform as key lever to become the Starting Point Our business model of the future Executing our strategy in times of Covid-19 Q1/2020 Results 14
We remain convinced that online fashion is a long-term growth opportunity

                     We are targeting a massive opportunity
                                in 5-10 years1…                                                                                          …with low online share compared to other categories

                                                                                                                                                                                   Consumer
                                                                                                                                                                     Fashion
                                                                                       Total                                                                                       Electronics2
                                                                                      fashion
                                                                                      >450bn

                                                                         Online
                                      >25%                              fashion

                            >5%                                                                                                                                                       36%   45%
                                                                                                                                                                    15%     20%
                                                                                                                                                                      15%    20%      36%   45%
                                                                                                                                                                    2018    2023     2018   2023

     (1)   Source: Company estimates and Euromonitor International forecasts, February 2019. Euromonitor forecasts the overall European Fashion Market to grow to
           roughly 450bn EUR over the next 5-10 years. Values based on actuals and estimates; fixed exchange rates.
           Fashion data incl. apparel and footwear, bags and luggage, jewelry and watches. Data for Europe (excluding Russia) inclusive of sales tax
     (2)   Source: United States online penetration, Statista, last update 2018-10

15
We aim to achieve a scale of 20bn EUR GMV by 2023/24
Growth Ambition 2023/24 Business Model Mix 2023/24
in €bn GMV1 in €bn
20
~20bn GMV by Partner
2023/24 program
~40%
13
Wholesale ~60%
15% 20% 36% 45%
2014 ‘15 ‘16 ‘17 ‘18 ‘19 ‘20 2023/24 GMV Revenue
CAGR2 +20-25% +15-20%
(1) GMV (Gross Merchandise Volume) incl. VAT
(2) 5-year CAGR (2018-2023): high end of range, 6-year CAGR (2018-2024): low end of rangePlatform model to drive higher long-term profitability at scale
Target Margin (growth in line with / slightly above online market)
Partner Group margin Key assumptions:
In % of revenue Wholesale1
Program impact 2
• PP share ~50% of GMV
Gross margin • ZFS share ~75% of PP items
• ZMS revenue 3-4% of GMV
Fulfillment costs
• Operating leverage and fixed cost
degression
Marketing costs
• Cash Flow: WC neutral and
CapEx slightly above D&A
Admin expense
Adj. EBIT margin 6-8% 20-25% 10-13%
(1) Wholesale includes Offprice and Private label
(2) Trend vs. 2018 cost lines
17Financial profile during transition to platform model
2019 Transition Phase 2019 – 2021 Years Following Target Model
Continued high GMV growth of 20-25% until 2023/24 Growth in line with /
GROWTH slightly above online
market
Margins between 2-4%, driven by Margins start to Target margin of
growth investments and platform increase as platform 10-13%
PROFITABILITY
transition transition progresses
(e.g. impact of ZMS)
● Cash flow negative Target margin leading
CASH ● NWC neutral to a strong cash
● Capex of 4-5% of revenue generation
18Investment Highlights - The Starting Point for Fashion
Our vision is to become the Starting Point for Fashion, the destination that consumers gravitate to for
1 all their fashion needs.
The number 1 priority is to focus on growth with 20-25% topline CAGR
2
to achieve a scale of 20bn EUR GMV by 2023/24.
3 The most important building block on that journey is to transition our business towards
a true platform business.
At scale our strategy will result in an attractive financial profile, characterized by
4
double-digit margin profile and strong cash generation.
To become the starting point we aim to invest our economic surplus in our customer experience
5
across assortment, digital experience and convenience to drive customer satisfaction and retention.
19Agenda Our vision: The Starting Point for Fashion Platform as key lever to become the Starting Point Our business model of the future Executing our strategy in times of Covid-19 Q1/20 Results 20
Our #1 priority is to ensure the safety of our employees

            All colleagues who can work from home are in home office

            For colleagues who cannot work from home, we do everything possible
            to create a safe working environment.

            We are focused on ensuring business continuity despite high absence rates
            and struggling carrier networks.

21
Our #2 priority is to safeguard our financial success
Daily GMV development
(in % YoY)
Mid-Season Demand Developed different demand scenarios for the year
Italy lockdown and stress-tested our financial health
Sale recovery
Initiated cost savings and drew our revolving credit
facility to remain flexible also in worst case
-8% YoY GMV
growth between Adjusted our trading routines to the new environment
Mar 9-30 (preponed mid-season sale, adjusted marketing
steering and messaging to customers)
7-Mar 16-Mar 25-Mar 3-Apr
22Our #3 priority is to find the right strategic response
Opportunity to be part of the solution for the fashion industry
Accelerate our Starting Point strategy, specifically platform transition
1 …
2 … Adjust our priorities for the year accordingly
3 …
23We see first signs that customers may shift to online even faster: highest number of new
customers ever achieved in month of April
New customer groups Growing new customer Starting Point
discover e-commerce numbers strategy
Shift towards social first Accelerating new customer growth
in # new customers in April for each year
+39%
2017 2018 2019 2020
24Brands need to shift towards digital even faster - and we are supporting them by accelerating
the platform transition
Brands requiring additional Promote Partner Program Starting Point
sources of demand and supporting services strategy
Our offer to the brands Accelerating Partner Program growth
Items shipped (in m)
• Faster integration
• Early pay-out to support cash needs
+94%
• Matching ZMS investments
ZFS items:
• Increased visibility in shop +140% YoY
• Dedicated partner sales event on May 10-12
Signing-up new brands 8.0
4.1 4.6
+50
partners in
last 3 weeks Feb Mar Apr
25We are supporting bricks and mortar retail by accelerating our Connected Retail program,
driving offline/online convergence
Promote Connected Retail
Bricks and mortar store Starting Point
Program and increase
revenues suffer significantly strategy
visibility
Our offer to the stores
• Zero commission for April and May
• Weekly pay-out of revenues
• Accelerated integration speed
• High visibility onsite
Connected Retail items shipped (in #k)
+413%
Up to ~5%
GMV share in
DE
114 110
32 48
21
CW 13 CW 14 CW 15 CW 16 CW 17
26We have the right assets and the right strategy to grow stronger throughout this crisis
We have the right assets… …and the right strategy…
Customer Reach EUR 1bn Our Vision:
32m Active Customers to become the Starting Point for Fashion
Strong Partnerships
2500+ brand relationships
+
European Logistics
Network
11 sites in 4 countries
Cash Balance
>1bn EUR >2k Tech FTE
…to grow stronger throughout this crisis.
Confident to finish 2020 with strong growth and profitability,
remaining on track to our targets 2023/2024
27Agenda Our vision: The Starting Point for Fashion Platform as key lever to become the Starting Point Our business model of the future Executing our strategy in times of Covid-19 Q1/20 Results 28
Continued double digit growth in a highly challenging environment

                                  Revenue: Group (Q1)                                                                                 Fashion Store – DACH (Q1)

          Fashion Store                                                  GMV
          Offprice                                                      +13.9%                                                                                    GMV
          Other²                                                                                                                        622            664        +9.9%
 (in €m and %)            1,378¹                               1,5241

                                                                                                                                       Q1/19          Q1/20

                          1,269                                1,392                                                        Fashion Store – Rest of Europe (Q1)

                                                                                                                                                       728         GMV
                                                                                                                                        647
                                                                                                                                                                  +14.3%
                            137
                                                                 185
                            103                                   37
                          Q1/19                                Q1/20                                                                   Q1/19          Q1/20

 1) Q1/20 (Q1/19) contains -€89.6m (-€129.7m) reconciliation of internal revenues
 2) Other segments including various emerging businesses; private label offering zLabels no longer presented as separate unit since Q2/19

29
Underlying customer metrics largely proven to be resilient
Active customers
(in #m) Average orders
per active 4.5 4.7
customer
Q1 Traffic
(LTM in #)
+23.1% Q1/19 Q1/20
Average basket
size after returns1 57.0 56.1
31.9
27.2 (LTM in €)
Q1/19 Q1/20
GMV per active
Q1/19 Q1/20
customer2 255.7 264.8
(LTM in €)
Q1/19 Q1/20
1) Defined as GMV divided by the number of orders
2) Defined as GMV divided by the number of active customers
30Short-term adjustments in commercial steering and continued improvements in overhead
efficiency could not compensate for the deterioration in gross margin
Costs and savings
Q1
(in % of revenue, unadjusted)
2019 2020 Delta
Cost of sales (60.1%) (64.7%) 4.6pp
SS20 inventory write-off
Gross profit 39.9% 35.3% (4.6pp)
and price investments
Lower utilization and
Fulfillment costs (28.7%) (29.9%) 1.2pp
higher sickness rate
Elevated ROI based
Marketing costs (7.0%) (8.1%) 1.1pp
marketing investment
Administrative expenses & Other (5.4%) (4.7%) (0.7pp)
EBIT (1.3%) (7.4)% (6.2pp)
Adj. EBIT1 0.5% (6.5%) (6.9pp)
1) Excluding equity-settled share-based payment expense (“SBC”), restructuring costs and non-operating one-time effects
31Our strong cash position allows us to navigate confidently through this challenging time
(in €m) Includes RCF
draw of €375m
(25)
(261) 360
(42)
1059 1034
1002
Q4/19 Liquidity1 Operating CF Investing CF2 Other Changes3 Q1/20 Liquidity Short-term Q1/20 Cash &
investments cash equivalents
Free cash flow: €(303)m
(1) Both Q1/20 and Q4/19 liquidity include investments into short-term deposits with maturity of more than 3 and less than 12 months of €25m, respectively.
(2) Includes investments in fixed and intangible assets and payments for acquisitions and change in restricted cash (+€0.0m)
(3) Includes financing cash flow (€359.6m) and effect of exchange rate on cash and cash equivalents (+€0.5m).
32Updated FY/2020 outlook
GMV and Revenue growth of 10-20%
Adj. EBIT1: €100 – 200m
Negative net working capital and €230-280m in Capex2
1) Excluding equity-settled share-based payment expense (“SBC”) of ~€50m, restructuring costs and non-operating one-time effects for FY/20E
2) Excludes M&A transactions
33Appendix Management Board The Zalando Share Zalando Investor Relations Team 34
Management Board

 Robert Gentz                     David Schneider              Rubin Ritter   Jim Freeman      David Schröder
 Co-CEO                           Co-CEO                       Co-CEO         CTO              CFO

 •   Marketing / Sales            •   Fashion Offer            •   Strategy   •   Product      •   Finance
 •   Human Resources                  (Assortment)                            •   Technology   •   Operations

35      Month, Year      Presentation Title // Document info
The Zalando Share

                              Shareholder structure1,2                                                             Share information1

                                                                                                                                           Ordinary bearer shares
Treasury shares. 1.65%                                                                      Type of Shares
                                                                                                                                   with no-par value (Stückaktien)

                                                               Kinnevik AB (publ): 25.82%   Stock Exchange                              Frankfurt Stock Exchange
                                                                                            Market Segment                     Regulated Market (Prime Standard)
                                                                                            Index Listings                      MDAX, STOXX600, FTSE4Goods
                                                                                            First day of trading                                  October 1, 2014

                                                                                            Issue price                                                EUR 21.50
                                                                                            Total Number of
                                                                                                                                                     254,109,220
                                                                                            Shares Outstanding
                                                            Anders Holch Povlsen 10.14%     Issued Share capital                                EUR 254,109,220

 Other shareholders (free float) 62.38%

 36        Month, Year          Presentation Title // Document info
Zalando Investor Relations Team
Patrick Kofler Dorothee Schultz
Head of IR Junior Manager IR
Patrick.Kofler@zalando.de Dorothee.Schultz@zalando.de
Team Contact
T: +49 3020 9681 584
Zalando Tamara-Danz-Straße 1
Nils Pöppinghaus Jan Edelmann 10243 Berlin
Manager IR Manager IR
investor.relations@zalando.de
Nils.Poeppinghaus@zalando.de Jan.Edelmann@zalando.de https://corporate.zalando.com/en
37 Month, Year Presentation Title // Document infoUpcoming events
Date Event
All events
Wednesday, May 13 UBS Pan European Small and Mid-Cap Conference 2020 are virtual
Thursday, May 14 Exane BNP Paribas Frankfurt E-Commerce Day
Thursday, May 14 Roadshow Frankfurt, Hamburg & Austria
Monday/Tuesday, May 18-19 US-Roadshow
Monday/Tuesday, May 18-19 Roadshow Scandinavia
Wednesday, May 20 Roadshow Zurich
Thursday, May 28 Morgan Stanley Annual Berlin Internet Field Trip
Tuesday, June 2 Roadshow Paris
Monday, June 15 Barclays Internet Day
Tuesday/Wednesday, June 16-17 Erste Consumer Conference
Tuesday, June 23 Annual General Meeting
Tuesday, August 11 Q2/2020 Results
38 Month, Year Presentation Title // Document infoDisclaimer Certain statements in this communication may constitute forward looking statements. These statements are based on assumptions that are believed to be reasonable at the time they are made, and are subject to significant risks and uncertainties. You should not rely on these forward-looking statements as predictions of future events and we undertake no obligation to update or revise these statements. Our actual results may differ materially and adversely from any forward-looking statements discussed on this call due to a number of factors, including without limitation, risks from macroeconomic developments, external fraud, inefficient processes at fulfillment centers, inaccurate personnel and capacity forecasts for fulfillment centers, hazardous material / conditions in production with regard to private labels, lack of innovation capabilities, inadequate data security, lack of market knowledge, risk of strike and changes in competition levels. 39
You can also read