Exports of Australian waste and recovered materials in March 2021
←
→
Page content transcription
If your browser does not render page correctly, please read the page content below
Exports of Australian waste and recovered materials in March 2021
                                                                                    21 June 2021, Sally Donovan and Joe Pickin
                                                                                 ©The Department of Agriculture, Water and the Environment

Blue Environment is commissioned by the Department of Agriculture, Water and the Environment to
produce, analyse and report on monthly exports of waste and recovered materials1. The original data is
provided by the Australian Bureau of Statistics (ABS), and comprises monthly data and updates to
previously reported data2,3,4. The ABS data is transformed to account for issues such as trade codes
covering a mixture of wastes and non-wastes, and to make it consistent with national waste data methods.
On a tonnage basis nearly all these exports are materials recovered from waste streams for recycling5 or
energy recovery, but a small portion is hazardous waste sent for treatment. Monthly data is highly variable,
and trends are best observed through the annual reports produced in this series.

Summary
In March 2021, Australia exported about 442,000 tonnes of waste and recovered materials with a reported
value of $321 million6. This represents an increase of 34% in tonnage and 27% in value compared to the
previous month. The exports included 386,000 tonnes (87%) within the scope of national waste reporting
(‘core waste plus ash’).
About 130,000 tonnes were exported in March in codes that could be affected by Australia’s export bans.
This is 29% of the total exports of waste and recovered materials. New AHECC codes for glass exports were
introduced to distinguish between processed and unprocessed waste glass from 1 January 2021. A small
amount of material was exported under one of these new codes in March. No impact of the forthcoming
ban on export of mixed plastic scrap (scheduled for 1 July 2021) is apparent in the data.

Comparison by destination
The top 10 recipients of Australian waste and recovered materials between July 2019 and March 2021, in
order, were Indonesia, India, Bangladesh, Vietnam, Malaysia, China (including Hong Kong and Macau),
Thailand, Taiwan, the Republic of Korea and Pakistan. In March 2021, 88% by weight of Australia’s exported
waste and recovered materials was sent to these destinations.
Table 1 (overleaf) compares exports of waste and recovered materials to these top 10 destinations in
January and February 2021 and includes each destination’s 2019-20 monthly average. Exports increased to
all destinations except Malaysia and China. The largest increases were to Taiwan and Thailand, due to
increased scrap metal exports, and to Vietnam due to metals and a shipment of brewing or distilling dregs
from Sydney.
Scrap metals were the main export to Bangladesh (100%), Taiwan (99%), Vietnam (81%), Pakistan (80%)
and China (80%). Metals accounted for just over half of the exports to India (54%) followed by paper and
cardboard (27%) and tyres (17%). The main export to Indonesia was scrap paper and cardboard (76%)
followed by metals (18%). Exports to the Republic of Korea included metals (52%), agricultural
organics (23%), hazardous waste (11%) and paper and cardboard (10%). Exports to Malaysia were also
mixed including paper and cardboard (37%), metals (26%) and plastics (25%).

1The export codes mapped to waste and recovered materials in 2020-21 differ slightly from those in 2019-20. Details are given in
the accompanying workbook (under ‘Ref lists’). The historical data presented here has been updated.
2Data in these summaries is originally entered by exporters or their agents. It cannot be guaranteed that exporters use the correct
codes or values for their exports, so this data should be used with caution.
3Data may be revised for up to six months after initial publication as customs declarations are amended by individual traders. Due
to these revisions, there may be discrepancies between this and preceding reports.
4The data presented is gross weight, including packaging but excluding shipping containers. This value is used for consistency
because the quantities of exported materials are presented in varied units, including numbers of items.
5Some of these recovered materials contain a proportion of contamination (or ‘off-spec’ content) that needs to be extracted
before the material can be used.
6   Dollar values refer to Australian dollars. Historical values are inflated based on the annualised consumer price index.

                                                                  Page 1
Table 1 Comparison of month-to-month exports of waste and recovered materials by destination
Mar-21 Feb-21 2019-20 Mar-21 Feb-21 2019-20
Export destination
monthly monthly
(ranked by tonnes since
% of % avg % avg
July 2019)
tonnes total tonnes change tonnes $ mil $ mil change $ mil
1 Indonesia 93,000 21% 86,000 8% 52,000 $29.0 $25.9 12% $16.1
2 India 35,000 8% 31,000 13% 48,000 $23.3 $23.0 1% $27.4
3 Bangladesh 33,000 7% 30,000 8% 52,000 $13.8 $12.9 7% $20.6
4 Vietnam 103,000 23% 62,000 67% 35,000 $57.1 $28.4 101% $14.3
5 Malaysia 25,000 6% 30,000 -17% 32,000 $17.8 $18.9 -6% $13.2
6 China 8,400 2% 8,500 -1% 27,000 $33.6 $23.8 41% $28.3
7 Thailand 29,000 7% 16,000 78% 22,000 $15.1 $9.28 63% $7.62
8 Taiwan 28,000 6% 12,000 127% 17,000 $13.5 $5.92 128% $9.32
9 Korea, Republic of 19,000 4% 12,000 60% 15,000 $31.5 $13.9 127% $39.4
10 Pakistan 15,000 3% 10,000 46% 9,100 $8.32 $6.25 33% $5.01
Top 10 total 388,000 88% 298,000 30% 309,000 $243.0 $168.3 44% $181.3
Monthly total 442,000 - 329,000 34% 354,000 $320.7 $253.1 27% $237.7
Figure 1 presents the trend in tonnes of exports of waste and recovered materials from Australia by
destination between July 2017 and March 2021. Monthly exports are volatile and no overall trend is
evident over the 45-month timeframe. Exports of waste and recovered materials to Indonesia and Vietnam
have grown during this financial year, while those to India, Malaysia, China, Taiwan, the Republic of Korea
and Pakistan have fallen. Exports to Bangladesh, Thailand and other destinations in the top 10 have levelled
off.
Figure 1 Monthly exports of waste and recovered materials from Australia by destination
The reported value of exports for March 2021 was $321 million, up from $253 million in February and
greater than the 2019-20 monthly average of $238 million. The monthly rise in value was similar to the rise
in tonnes.
Comparison by material
Table 2 compares March 2021 export tonnages and values with February and with the 2019-20 monthly
average, by material type. Around 87% falls within the ‘core waste plus ash’ scope of national waste
reporting7.
7 See the National Waste Report 2020 on the Department of Agriculture, Water and the Environment website.
Page 2Table 2 Comparison of export tonnage and value by material
2019-20 2019-20
Mar-21 Feb-21 Mar-21 Feb-21
monthly avg monthly avg
tonnes % of total tonnes % change tonnes $ mil % of total $ mil % change $ mil
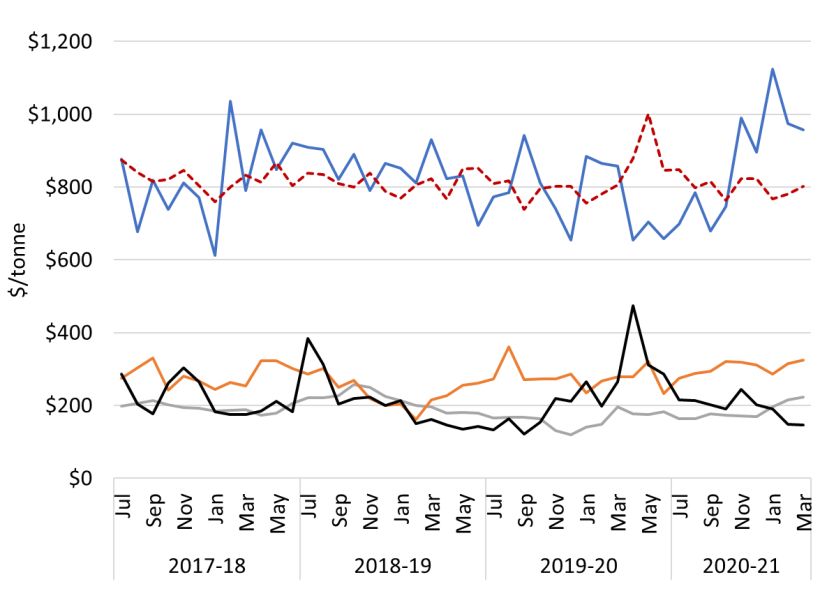
Glass 40Trends in tonnage and unit value
Figure 2 presents the monthly Figure 2 Monthly exports of waste and recovered materials
trend in exports of waste from from Australia by material type, July 2017 to
Australia in tonnes by material March 2021
type between July 2017 and
March 2021. Scrap metal exports
climbed after dropping to their Metals
lowest value over the analysis
period in January 2021. Exports Paper &
of scrap paper and cardboard fell cardboard
for much of the period but grew
Other
in recent months. Monthly
exports of scrap tyres fell
steadily over 2019-20 to reach
their lowest level in April but Plastics
subsequently increased9. Exports
Tyres
of recovered plastics fell in early
2017-18, recovered to peak in Textiles
early 2019, then fell to a low in
August. They have grown during Hazardous
2020-21. Glass
Figure 3 presents monthly trends
in the average reported value
per tonne of key waste exports
from July 2017 to March 2021. Figure 3 Comparison of unit values by material (in $/t), July
Reported values for: 2017 to March 2021
• metals declined gradually
from July 2018 but have been
increasing in recent months
Metals
• paper and cardboard had
been on a gently declining Textiles
trend but have risen steadily
since December 2020
• plastics fell steadily during
2018 due to China’s
Plastics
restrictions, but recovered as
Paper & card.
exports of low-grade mixed Tyres
materials fell while higher
value streams remained
consistent
• textiles were consistently
between $740 and $1,000/t
but towards the low end of
that range in 2020-21
• tyres dipped in 2019, peaked in April 2020 and have been declining since
• glass are not shown as, since the export ban began, low tonnages have resulted in erratic unit values.
Page 4Port of loading and state of origin
Between January 202010 and March 2021 about 81% of Australia’s waste and recovered materials were
exported from four ports: Melbourne (25%); Sydney (20%); Brisbane (19%); and Fremantle (16%). Figure 4
shows the average monthly tonnes exported by material group between January 2020 and February 2021,
and the March 2021 tonnes from each of the top four ports and from all other ports combined. Exports
from Fremantle were below average in March, mainly due to a drop in metal exports. Brisbane and
Melbourne both exported above average metals and paper and cardboard. Exports from Sydney were
relatively high for paper and cardboard and ‘other’. Until September 2020 exports in the ‘other’ category
from Sydney mainly consisted of brans, sharps and residues of milling but since then, exports of brewing or
distilling dregs have grown steadily to reach over 19,000 tonnes this month. Exports from all other ports
were substantially above average due to three large shipments of ferrous waste and scrap to Vietnam and a
large shipment of sawdust from Albany to Japan.
Figure 4 Monthly exports by material from port of loading – latest month compared with average
Most waste and recovered materials are exported from a port in the jurisdiction where they are generated,
but Tasmania exports more than half of its waste via Melbourne and it is understood that materials from
the Australian Capital Territory are exported from Sydney.
Australian waste export ban
A March 2020 meeting of the then Council of Australian Governments agreed to a timetable for
implementing bans on exporting waste glass, paper, plastics, and tyres not processed into a value-added
material. The relevant materials, dates and main export codes are shown in Table 3.
In March 2021, about 130,000 tonnes of waste and recovered materials were exported within the codes
listed, up from 127,000 tonnes in February. This represents about 29% of the total quantity of waste and
recovered materials exported for the month, and 34% of all exports within the ‘core waste + ash’ scope of
national waste reporting.
An impending key milestone is the ban on exports of mixed polymer scrap plastics, which is due to come
into force on 1 July 2021. Government and industry are dealing with the challenge of ensuring that
sufficient local sorting capacity is available for mixed rigid packaging plastic from kerbside collections, which
has previously been exported. About 6,600 tonnes of material were exported under the relevant code in
March 2021.
10 Earlier data were unavailable.
Page 5Table 3 Material types facing export bans
Mar 21 exports in Estimated %
Ban AHECC11 this code (rounded of tonnes to
Material date code AHECC description tonnes) be banned12
Glass in the mass, cullet and other waste and scrap of
Glass Jan 2021 7001009113 0 Ban in effect
glass, not elsewhere specified
Recovered (waste and scrap), unbleached, kraft paper or
47071000 69,000
paperboard or corrugated paper or paperboard
Recovered (waste and scrap) paper or paperboard, made
47072000 mainly of bleached chemical pulp, not coloured in the 90
mass
Paper and Recovered (waste and scrap) paper or paperboard, made
Jul 2024 47073000 1,400 47% 14
cardboard mainly of mechanical pulp (e.g. newspapers, journals)
Waste and scrap paper or paperboard (incl. unsorted
waste & scrap) (excl. unbleached kraft or corrugated
47079000 (470710); that made mainly from bleached chemical pulp, 37,000
not coloured in the mass; or made mainly of mechanical
pulp)
39151000 Waste, parings and scrap, of polymers of ethylene 4,900
Jul 2022 39152000 Waste, parings and scrap, of polymers of styrene 40 100% 15
Plastics 39153000 Waste, parings and scrap, of polymers of vinyl chloride 20
Waste, parings and scrap, of plastics (excl. those of
Jul 2021 39159092 6,600 83% 16
polymers of ethylene, styrene or vinyl chloride)
Waste, parings and scrap of rubber (excl. of hard rubber)
40040000 8,300 44% 9
and powders and granules obtained therefrom
Whole Dec Used pneumatic rubber tyres, whether or not subject to
40122000 1,700 100% 9
tyres 2021 recutting or regrooving
Solid or cushion rubber tyres, rubber tyre treads (incl.
40129000 1,200 6% 9
interchangeable tyre treads) and rubber tyre flaps
Restrictions on waste imports – latest news
India’s Ministry of Environment and Forests established a committee to review imports of many waste
types including tyres, textiles and paper and cardboard, but it has not produced a report after more than a
year17. On 27 January, the Indian government announced that its previous ban on the import of plastics
waste to export-oriented units and special economic zones will be lifted18. This is apparently to ensure
sufficient supplies for the plastics reprocessing industry, which provides significant employment. Imports
must comply with the new amendments to the Basel Convention regarding plastics waste.
Malaysia recently flagged its intention to apply the plastic waste amendment to the Basel Convention by
returning a shipment from Los Angeles19 – a particular concern as the US is not a Convention signatory.
However, the shipment was found to be clean, homogenous polyethylene and was ultimately accepted20.
No updates were found on restrictions in Australia’s other major export destinations.
11 Australian Harmonized Export Commodity Classification.
12 Based on the 2018-19 characteristics of these materials.
13 Previously 70010000
14 Comprises the proportion of material in AHECC code 47079000, but significant miscoding is apparent in the data.
15 Assumes no material was sorted and processed to the extent that will be required for future export.
16 Excludes fuels.
17 The Economic Times (13 January 2021) NGT raps govt over delay in report on import of hazardous waste
18 Scrap News (8 February 2021) India reopens access to recovered polyethylene
19 Waste Advantage Magazine (2021) Malaysia to return US plastic waste shipment under new UN rules
https://wasteadvantagemag.com/malaysia-to-return-u-s-plastic-waste-shipment-under-new-u-n-rules/
20 Reuters (2021) Malaysia permits import of US plastic waste shipment after it passes new UN treaty test
https://www.reuters.com/article/us-malaysia-environment-plastic-idUSKBN2BG0ZL
Page 6Restrictions on waste import – overview
The current status of import restrictions to Australia’s top 10 waste and recovered materials destinations is summarised in Table 4, while
Table 5 provides details of the import restriction policies, their dates and amount of waste potentially impacted by the bans.
Table 4 Summary of import restrictions by material and top 10 destination
Haz. waste Paper &
Glass Metals Plastics Tyres Textiles
(excl. tyres) cardboard
Indonesia Restricted Restricted Restricted Restricted Restricted Restricted Key
India Restricted Considering Restricted Restrictions are in place
Bangladesh Restricted Announced Restrictions announced but not yet implemented
Vietnam Restricted Restricted Restricted Considering Restrictions are under consideration
China Restricted Restricted Restricted
Malaysia Restricted
Thailand Restricted
Taiwan Restricted Restricted
Republic of Korea Restricted Restricted Announced
Pakistan Restricted
Table 5 Status of waste import restrictions
Announced & Associated exports (tonnes)
Destination Scope of restrictions implemented Types 2019-20 Mar 21 Impact and uncertainties
Indonesia On 27 May 2020 the Indonesian Government published a decree on the Ann.: Apr-19 Plastics, 627,000 93,000 Imports reduced from 61,000
implementation of import of non-hazardous and toxic material waste21. This limits Imp.: Nov-19 Paper and (52,000 per per month in 2018-19 to
contamination of imported scrap plastic and paper to 2% and announces the cardboard, month) 52,000 in 2019-20.
metals,
formation of a task force to develop a road map accelerating the availability of
glass,
domestic raw materials. This will include a staged reduction of import quotas. On 15 hazardous
October 2020, they further announced exporters will need to complete a registration waste,
process, described as cumbersome and lengthy, to continue exporting to Indonesia, tyres,
which came into force in January 202122. other.
21 Minister of Trade, Minister of Environment and Forestry, Minister of Trade Industry and Head of State Policy, Republic of Indonesia (May 2020), Implementation of import of non hazardous and
toxic material waste as raw material industry.
22 EU-WID Pulp and paper (16 October 2020) Indonesia postpones introduction of exporter registration to 1 January 2021.
Page 7Announced & Associated exports (tonnes)
Destination Scope of restrictions implemented Types 2019-20 Mar 21 Impact and uncertainties
India In 2016 India banned the import of scrap plastics with an exemption for special Ann.: Mar-19 Plastics 60 30 Plastics imports reduced from
economic zones (SEZ) and export-oriented units (EOU). In August 201923 the ban was Imp.: Mar-19 to (5 per month) 60 to 5 tonnes per month from
expanded to cover these zones, however, on 27 January 2021 this expansion was Aug-19 2018-19 to 2019-20.
revoked meaning waste plastics can again be imported to these areas. The ban Lifted: Jan-21
excludes electrical/electronic assemblies or components that are defective which can
be imported within a year of export. India also has a contamination limit of 1% for
recovered paper, which it enforces by randomly inspecting five mixed paper bales per
container 24.
Bangladesh The Bangladesh Ministry of Commerce Import Policy Order 2015-2018 includes Imp: Feb-16 Plastics 0 None
details of waste import regulations25. Metals and glass are allowed for bona fide
industrial units, paper and cardboard is unrestricted and textiles are allowed with
some restrictions. The regulations also mention exemptions for other waste types
that would fall under the waste groups hazardous and ‘other’.
Vietnam On 24 September 2020 Vietnam published26 ‘Promulgation of the list of waste Ann. in Sep-20. Plastic, 420,000 89,000 Imports reduced from 61,000
permitted for import as production materials’, overriding previous relevant Mixed metal paper, to 35,000 tonnes per month
(35,000 per
regulations. Unsorted scrap paper imports and granulated slag from the manufacture waste restricted metals between 2018-19 and 2019-20.
month)
of iron or steel are scheduled to be banned by the end of 2021. This builds on a range from Oct 2018.
of restrictions regulated in 2018 that allow waste imports only if e.g., shipments meet
specified environmental standards and there is capacity to process the materials.
These covered scrap iron and steel, plastic, paper, glass, non-ferrous metal and blast
furnace slag dust27. Under new national standard QCVN 32: 2019/BTNMT, import of
e-waste plastics (e.g. cases of TVs and computers) would be forbidden 28. Scrap metal
waste needs to be 99% metal to be allowed in29.
Malaysia Malaysia continues its crackdown on plastic waste imports with renewed support Jul-18. Plastic, 49,000 6,300 No impact apparent.
from the Basel Convention amendment on plastic waste, which came into force in metals
(4,100 per
January 2021. Recently a large shipment of plastic waste was accepted only after month)
inspection showed it contained clean homogenous polyethylene20. The Basel Action
23 Business Today, (24 June 2019) India bans import of plastic waste from August this year to curb pollution.
24 Waste Dive, (15 January 2020), India to enforce 1% contamination rate on paper imports, conduct random inspections.
25 Ministry of Commerce, Government of the People’s Republic of Bangladesh (2016) Import Policy Order 2015-2018
26 Prime Minister of Vietnam (24 September 2020) Promulgation of the list of waste permitted for import as production materials. Unofficial translation.
27 Vietnam - National Technical Regulations on Wastes (18 November 2019), https://www.cciclondon.com/portal/article/index/cat_id/35/id/286.html
28 Ministry of Natural Resources and Environment of the Socialist Republic of Vietnam (2018) Vietnam to ban imports of plastic from used electronics.
29 S&P Global Platts (2019) Vietnam’s Jan scrap imports plunge amid stricter government rules.
Page 8Announced & Associated exports (tonnes)
Destination Scope of restrictions implemented Types 2019-20 Mar 21 Impact and uncertainties
Network encouraged the Malaysian government to similarly inspect all shipments of
plastics waste coming into the country to ensure continued compliance30.
China From 1 January 2021, China has implemented a ban on the import of all solid waste31. Ann.: Apr-20 All solid 328,000 8,400 Imports gradually reduced
However, certain materials such as scrap metals are defined as resources rather than wastes (27,000 per from over 100,000 tonnes per
waste under the new legislation and can continue to be imported Imp.: Jan 1, 2021 month) month in 2016-17 to 27,000 in
2018-19.
Thailand Thailand announced its intention to implement a ban on the import of all plastic Ann. Aug-18, Plastic 9,500 290 Plastics imports reduced from
wastes by 202232. However, this is still under debate due to uncertainty that locally plastic imp. Aug- (800 per 900 to 800 tonnes per month
18, e-wasteYou can also read