Exports of Australian waste-derived products and wastes in April 2020 - Environment.gov.au
←
→
Page content transcription
If your browser does not render page correctly, please read the page content below
Exports of Australian waste-derived products and wastes in April 2020
                                                                     29 June 2020        Joe Pickin and Sally Donovan
Blue Environment is commissioned by the Department of Agriculture, Water and the Environment to
analyse and report on monthly exports of waste-derived products (e.g. recycled plastic chip) and
materials that are still wastes. The data is provided by the Australian Bureau of Statistics1, and
comprises monthly data covering the previous six months, including any updates to previously
reported data. On a tonnage basis nearly all these exports are materials recovered from waste
streams for recycling or energy recovery2, but a small portion is hazardous waste sent for treatment.

Summary
In April 2020, Australia exported about 423,000 tonnes of waste-derived products and wastes with a
value of $261 million3. This represents a decrease of 1% in tonnage and 22% in value compared to
the previous month. The exported quantity of material in the category ‘other’, comprising mostly
organic residues, more than doubled to 43,000 tonnes from 20,000 tonnes in March. Hazardous
waste exports also increased modestly, while exports of all other categories decreased.

About 113,000 tonnes were exported in April in codes that could be affected by the COAG export
bans. This is 27% of the total exports of waste-derived products and waste.

No obvious effects of the COVID-19 pandemic are apparent in the data.

Comparison by destination
The top 10 recipients of Australian waste-derived products and wastes between July 2018 and
April 2020 were Indonesia, India, Vietnam, China (including Hong Kong and Macau), Bangladesh,
Malaysia, Thailand, the Republic of Korea, Taiwan and Pakistan. In April 2020, 82% by weight of
Australia’s exported waste-derived products and wastes were sent to these countries.

Table 1 (overleaf) compares exports of waste-derived products and wastes to these top 10 countries
in March and April 2020 and includes each country’s 2018-19 monthly average. April 2020 exports to
Bangladesh, Malaysia, Thailand, Taiwan and Pakistan were higher than their 2018-19 monthly
averages. Exports to the other countries were lower. Bangladesh received the largest increase in
exports, up to 100,000 tonnes from 68,000 tonnes in March.

April 2020 exports of waste-derived products and wastes to Bangladesh, Taiwan and Pakistan were
dominated by scrap metals (100%, 97% and 98% respectively). Metals also made up the majority of
exports received by Vietnam (75%), the Republic of Korea (63%) and India (61%). The remainder to
Republic of Korea was mainly hazardous waste (24%), while paper and cardboard was the next
largest export to India (37%) and Vietnam (24%). Exports to Indonesia, China and Thailand were split
between paper and cardboard (74%, 57% and 56% respectively) and metals (26%, 32% and 38%).
Exports to Malaysia were more varied, with 40% paper and cardboard, 18% metals and 25% ‘other’.

No obvious effects of the COVID-19 pandemic are apparent in the data.

1Data in these summaries is sourced from the Australian Bureau of Statistics and is originally entered by exporters or their
agents. It cannot be guaranteed that exporters use the correct codes or values for their exports, so this data should be
used with caution. Data may be revised for up to six months after initial publication as customs declarations are amended
by individual traders. Due to these revisions, there may be discrepancies between this and preceding reports.
2Some of these recovered materials contain a proportion of contamination (or ‘off-spec’ content) that needs to be
extracted before the material can be used.
3   Dollar values refer to Australian dollars.

                                                           Page 1
Table 1 Comparison of month-to-month exports of waste-derived products and wastes by
destination
Tonnes Value
Apr-20 Mar-20 Apr-20 Mar-20
Export destination 2018-19 2018-19
(ranked by tonnes % of % monthly % monthly
since July 2018) Tonnes total Tonnes change avg $ mil $ mil change avg
1 Indonesia 48,000 11% 71,000 -32% 60,000 $12.8 $22.7 -43% $23.7
2 India 37,000 9% 91,000 -59% 49,000 $17.1 $54.2 -68% $33.5
3 Vietnam 42,000 10% 25,000 67% 61,000 $17.2 $11.5 50% $29.8
4 China 20,000 5% 21,000 -4% 54,000 $29.1 $32.9 -12% $41.6
5 Bangladesh 100,000 24% 68,000 47% 25,000 $41.5 $34.4 21% $11.2
6 Malaysia 29,000 7% 37,000 -20% 27,000 $10.1 $15.5 -35% $10.4
7 Thailand 28,000 7% 17,000 61% 20,000 $10.0 $7.7 30% $7.9
8 Korea, Republic of 11,000 3% 9,000 29% 15,000 $52.4 $19.1 175% $32.6
9 Taiwan 17,000 4% 16,000 12% 13,000 $9.4 $9.2 3% $8.3
10 Pakistan 15,000 4% 19,000 -23% 5,000 $7.0 $10.4 -33% $3.3
Top 10 total 349,000 82% 374,000 -7% 329,000 $206.7 $217.4 -5% $202.1
Monthly total 423,000 - 428,000 -1% 369,000 $261.3 $334.1 -22% $258.8
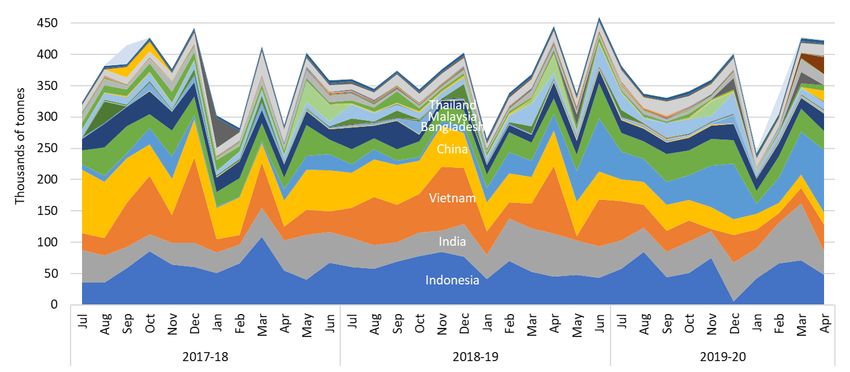
Figure 1 presents the monthly trend in tonnes of exports of waste-derived products and waste from
Australia by destination between July 2017 and April 2020. Exports to Indonesia dropped to a low of
5,600 tonnes in December 2019 but have since climbed back to mid-2019 levels. Exports to India fell
from 91,000 tonnes in March to 37,000 tonnes in April 2020, their lowest level since November
2018. Exports to Vietnam continued to increase (to 42,000 tonnes) after dropping to 15,000 tonnes
in February 2020, but remain well below the six-figure levels seen in some months during 2018.
Exports to China remained steady at 20,000 tonnes after reaching a low of 17,000 tonnes in
February. Exports to Bangladesh continued to climb from 68,000 tonnes in March to 100,000 tonnes.
Overall, no clear trend is apparent in the overall quantity of waste exports over the 30-month
timeframe.
Figure 1 Monthly exports of waste-derived products and waste from Australia by destination,
ranked by total quantity received, July 2018 to April 2020
The reported value of exports for April 2020 was $261 million, decreasing from $334 million in
March and close to 2018-19 monthly average of $258 million. The fall in value is proportionally much
greater than the decline in tonnes due to lower values per tonne of many waste-derived product
categories including metals, hazardous and ‘other’.
Page 2Comparison by material
Table 2 compares April 2020 export tonnages and values with March and with the 2018-19 monthly
average, by material type.
Table 2 Comparison of export tonnage and value by material
2018-19 2018-19
Apr-20 Mar-20 monthly avg Apr-20 Mar-20 monthly avg
% of % % of %
tonnes total tonnes change tonnes $ mil total $ mil change $ mil
Glass 1,600 0% 4,200 -60% 1,300 $0.08Figure 2 presents the monthly Figure 2 Monthly exports of waste-derived products and
trend in exports of waste from wastes from Australia by material type, July 2017 –
Australia in tonnes by material April 2020
type between July 2017 and
April 2020. Scrap metal exports
remain volatile. Exports of scrap
paper and cardboard have
increased in recent months but
are relatively stable. Monthly
scrap tyre exports have fallen
strongly over the past year to
reach their lowest level in the
monthly data set from July 2017.
Exports of recovered plastics fell
in early 2017-18, recovered to
peak in early 2019, then fell to a
low in August. They remain
below the 2018-19 monthly
average.
Figure 3 presents monthly trends
in the average reported value per
tonne of key waste exports
between July 2017 and
April 2020. Over this timeframe
reported values for:
• metals have been volatile and Figure 3 Comparison of unit values by material (in $/t), July
fell in April to their lowest 2017 – April 2020
value since January 2018
• paper and cardboard have
been fairly stable, but
declined in late 2019 then
recovered in early 2020 to
$191/tonne in April 2020
• glass have oscillated, but
were stable for much of 2019
before dropping late in the
year then rising to their
current relatively stable level
• plastics have been driven by
low-grade mixed materials
that comprise most of the
exported tonnes – reported
values for this grade fell from
an average of $263/t over
2017-18 to a low of $137/t in
February 2019 then climbed
back, standing at $290/t in
April 2020.
Page 4COAG waste export ban
A March 2020 meeting of the Council of Australian Governments agreed to a timetable for
implementing bans on exporting waste glass, paper, plastics and tyres not processed into a value-
added material. The relevant materials, dates and main export codes are shown in Table 3.
Table 3 Material types facing export bans
Apr-20 exports in Estimated %
Ban AHECC this code of tonnes to
Material date code AHECC description (rounded tonnes) be banned4
Jul Cullet and other waste and scrap of glass; glass
Glass 70010000 1,600 100% 5
2020 in the mass
Recovered (waste and scrap), unbleached, kraft
47071000 paper or paperboard or corrugated paper or 44,000
paperboard
Recovered (waste and scrap) paper or
47072000 paperboard, made mainly of bleached chemical 80
pulp, not coloured in the mass
Paper and Jul Recovered (waste and scrap) paper or 32% 6
cardboard 2024 47073000 paperboard, made mainly of mechanical pulp 6,900
(e.g. newspapers, journals and similar)
Waste and scrap paper or paperboard (incl.
unsorted waste & scrap) (excl. unbleached
47079000 kraft or corrugated (470710); that made mainly 48,000
from bleached chemical pulp, not coloured in
the mass; or made mainly of mechanical pulp)
Waste, parings and scrap, of polymers of
39151000 2,600
ethylene
Jul Waste, parings and scrap, of polymers of
39152000 0 100% 7
2022 styrene
Plastics Waste, parings and scrap, of polymers of vinyl
39153000 20
chloride
Waste, parings and scrap, of plastics (excl.
Jul
39159092 those of polymers of ethylene, styrene or vinyl 4,900 83%
2021
chloride)
Waste, parings and scrap of rubber (excl. of
40040000 hard rubber) and powders and granules 1,500 44% 8
obtained therefrom
Whole Dec Used pneumatic rubber tyres, whether or not
40122000 1,100 100% 8
tyres 2021 subject to recutting or regrooving
Solid or cushion rubber tyres, rubber tyre
40129000 treads (incl. Interchangeable tyre treads) and 1,100 6% 8
rubber tyre flaps
In April 2020, about 113,000 tonnes of waste-derived products and wastes were exported within the
codes listed above, down from 136,000 in March. This represents about 27% of the total quantity of
waste-derived products and waste exported for the month.
4 Based on the 2018-19 characteristics of these materials.
5 It is believed that most or all of this product is derived from municipal recycling collections.
6 Comprises the proportion of material in AHECC code 47079000. However, significant miscoding is apparent in the data.
7 Assumes no material was sorted and processed to the extent that will be required for future export.
8 2018-19 Australian Border Force data on tyres exports differed from the equivalent ABS data, and neither were consistent
with industry-reported export quantities.
Page 5The current status of waste import restrictions
Following China’s lead, various Asian countries have flagged or implemented restrictions on the import of waste-derived products and wastes. These are described
in Table 4 for the top 10 export countries in the same order as in Table 1. The information presented has been compiled based on publicly available sources,
sometimes translated from languages other than English.
Table 4 Status of waste import restrictions
Announced & Associated exports (tonnes)
Country Scope of restrictions implemented Types 2018-19 Apr 20 Impact and uncertainties
Temporary moratorium on all waste scrap imports commenced 23 November 2019 as the new Ann.: Apr-19 Plastics, 725,700 48,000 Impact uncertain.
Ministerial Regulation No. 84/2019 on the Provisions on the import of non-hazardous and non- Imp.: Nov-19 Paper and
toxic waste for industrial purposes is implemented9. All shipments subject to inspection dates cardboard, (60,500 per
after 22 November 2019 have been stopped. Under the new regulation, transhipments are metals, month)
banned. Only direct shipments from exporters that have obtained a permit (which would be glass,
subject to occasional verification) and have inspected containers prior to shipment would be hazardous
allowed. Scrap imports to be restricted to arrive at eight ports only in Jakarta, Semarang, waste,
Indonesia Surabaya (2), Makassar, Medan, Batam and Cilegon. The set contamination thresholds are tyres,
unclear with industry interpretation suggesting it could be 0% which contradicts the previous other.
suggestion of 2% with a two-year transition to 0.5%. Illegally imported plastic waste to be
returned back to exporters10. Reportedly rejected eight containers of ‘contaminated’ paper
and plastic material in July 2019. In September 2019, Indonesia announced it would send 100
containers of contaminated material (particularly plastics) back to Australia, but to date only a
small number have been returned11. Determined in February 2020 to ease the rules on metal
scrap imports due to mill supply shortages12.
Import of scrap plastics banned from August 201913. Also covers areas previously exempt Ann.: Mar-19 Plastics 700 0 Impact uncertain.
under the 2016 ban such as special economic zones (SEZ) and export-oriented units (EOU)14. Imp.: Mar-19,
Excludes electrical/electronic assemblies or components that are defective which can be Aug-19 for (60 per
India imported within a year of export. A six-month extension has been granted to three SEZs which importers month)
allows plastic scrap to be imported until May 31 202015. India set a contamination limit of 1% currently exempt
for recovered paper years ago. It now intends to enforce this by randomly inspecting 5 mixed under SEZs and
paper bales per container16. EOUs.
9 Argus (21 November 2019), Indonesia suspends scrap imports amid new policy
10 VOA news (2019) Indonesia vows to send back illegal plastic waste
11 Inside Indonesia (2020) Buried under the weight of the recycling crisis
12 Indonesia will ease rules on scrap metal imports, https://www.wastetodaymagazine.com/article/indonesia-will-ease-rules-on-import-of-scrap-metal/
13 Business Today, (24 June 2019) India bans import of plastic waste from August this year to curb pollution
14 Ministry of Environment, Forest and Climate Change (2019) Amendment in Hazardous Waste (Management & Transboundary Movement Rules, 2016)
15 Business Standard, (2 December 2019) Govt grants six month extension to plastic scrap imports in three SEZs
16 Waste Dive, (15 January 2020), India to enforce 1% contamination rate on paper imports, conduct random inspections
Page 6Announced & Associated exports (tonnes)
Country Scope of restrictions implemented Types 2018-19 Apr 20 Impact and uncertainties
India’s Central Pollution Control Board has been reviewing the pyrolysis industry and has
ordered the closure of 270 plants that were not compliant with environmental regulations 17. It
is expected this will lead to a subsequent restriction on the import of waste tyres in the near
future18.
Tighter controls over imports of plastic, paper and metals. Accepted only if importers prove Ann. in Aug-18 Plastic, 732,600 42,000 Has apparently affected
their shipment meets specified environmental standards and there is capacity to process the apparently paper, imports of scrap plastic and
materials19. No new licences issued for waste imports31. Plastic scrap imports to be banned by implemented. metals (61,100 per metal from Australia.
202520. Under new national standard QCVN 32: 2019/BTNMT, import of e-waste plastics (e.g. Mixed metal month) Environmental reference
Vietnam
cases of TVs and computers) would be forbidden21. From 22 February 2019, all imports through waste restricted standards are unavailable in
road and railway border gates banned22. Import of mixed metal waste (containing any plastic, from Oct 2018. English.
paper, other non-metallic metals) now understood to be restricted. Composition of metal
waste needs to be 99% metal to be allowed in23.
Declared restrictions and then, in April 2018, a ban on 32 types of waste-derived products24. Ann.: Jul & Nov- Plastic, 643,000 20,000 Impact evident (2016-17
From 1 July 2019, import restrictions were placed on eight solid waste codes pertaining to 17, Apr-18, Jul- paper, exports averaged
19, Dec-19, Jan- metals, (53,600 per 105,300/month and averaged
metals25. China is now reported to have enshrined in law its intention to stop all imports of
20 other month) 62,000/month in 2017-18).
China waste, with the aim of full implementation by the end of 202026. In the meantime, it continues
to issue permits for imports of waste fibre and will allow 4.5 million tonnes to be imported this
year. Quotas are also still being issued for metals27 28 29. Imp.: Jan & Mar-
18, Dec-18, Dec-
19
No apparent waste import restrictions. Received only metals and hazardous wastes from 0 None
Bangladesh
Australia during this financial year, which are not subject to export bans.
17 India legal, (6 January 2020), NGT calls for review of CPCB’s report on pyrolysis units.
18 Tyre and Rubber recycling, (22 September 2019), Near total ban on waste tyre imports imminent in India
19 Vietnam Briefing (2018) Vietnam to Restrict Surging Scrap Imports
20 VN Express International (2019) Vietnam to end plastic scrap imports from 2025
21 Ministry of Natural Resources and Environment of the Socialist Republic of Vietnam (2018) Vietnam to ban imports of plastic from used electronics
22 VietnamPlus (2019) Scrap imports through road, railway border gates to be banned, Ministry of Information and Communications
23 S&P Global Platts (2019) Vietnam’s Jan scrap imports plunge amid stricter government rules
24 Ministry of Commerce, State Development & Reform Commission (incl. former State Development Planning Commission), General Administration of Customs (2018) Announcement No. 6 [2018] of
the Ministry of Ecology and Environment, the Ministry of Commerce, the National Development and Reform Commission and the General Administration of Customs
25 Ministry of Ecology and Environment of the People’s Republic of China (2018) Announcement on adjusting the catalogue of imported waste management
26 Resource Recycling (5 May 2020) China moves closer to complete import ban
27 Bureau of International Recycling (24 December 2019) Chinese quotas for waste & scrap imports: full list of 1st batch 2020
28 Bureau of International Recycling (8 January 2020) Chinese quotas for waste & scrap imports: full list of 2nd batch 2020
29 Recycling Today (10 January 2020) China issues second batch of scrap import quotas
Page 7Announced & Associated exports (tonnes)
Country Scope of restrictions implemented Types 2018-19 Apr 20 Impact and uncertainties
Import permits revoked from 114 factories that process imported plastic waste30,31.Import of Jul-18. Plastic 55,200 2,500 No impact apparent.
non-recyclable plastic waste to be banned by 202132. Contaminated, mislabelled or illegally
imported plastic waste loads to be sent back to source33 34. Malaysia has continued returning (4,600 per
Malaysia
contaminated containers of plastic waste to countries of origin with 150 returned and another month)
110 to be sent back by midyear. Enforcement at ports has improved and over 200 illegal plastic
recycling facilities closed down in a bid to crackdown on illegal waste imports35.
Revoked a broad plastic scrap import allowance, meaning plastic waste and scrap is banned Ann. Aug-18, Plastic 11,200 300 No impact apparent
from import by 202136,37,38. Looking to ban e-waste imports within 2 years31. In January 2020, a plastic imp. Aug- Announcement available in
Thailand (900 per
new subcommittee was set up to ensure the proposed bans can be achieved, and will not be 18, e-wasteYou can also read