Non-Alcoholic Beverage Industry Summary White Paper
←
→
Page content transcription
If your browser does not render page correctly, please read the page content below
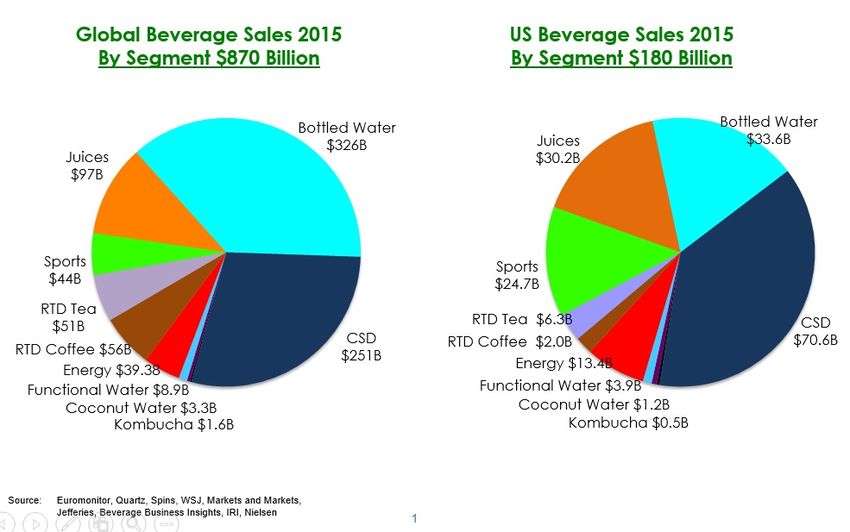
Non-Alcoholic Beverage Industry Summary White Paper

November 2016

Overview of the Non-Alcoholic Beverage Market
The US market for non-alcoholic beverages in 2015 was roughly $170 billion and is projected to
grow to roughly $190 billion by 2020.1 On a global basis the market is approaching US$900
billion. (The chart below suggests that the domestic 2015 market was closer to $180 billion. All
of these figures are imperfect and also depend on which smaller sub-categories were included or
were not included by different sources when they aggregated the sales volume estimates).
According to Transparency Research, if one includes milk and dairy, the global non-alcoholic
beverage industry is expected to reach $1937.73 billion (nearly two trillion dollars) by 2020.2
The industry is comprised of several large sub-categories including carbonated soft drinks (CSD)
or “soda,” energy drinks, juices, bottled and enhanced water, ready to drink (RTD) coffee and
tea, probiotics and sports drinks. Carbonated soft drinks represent the largest portion of the
category’s domestic market size with $70.6 billion, followed by bottled water, juices, energy
drinks.1

Sales of bottled water in the US topped $33 billion in 2015, which was a 6% growth over the
prior year. 1 Mintel suggests that innovation in flavors is driving the success in this category—
with 48% of bottled water consumers saying that are replacing sugary drinks with flavored
water. Another trend in this industry is the interest in functional waters. According to Mintel,
43% of consumers said that they are interested in bottled waters enhanced with vitamins.4

The juice segment of the non-alcoholic beverage space is expected to surpass the $13 billion
mark by the end of 2016.5 This number is expected to grow slowly but steadily throughout the
years leading up to 2022 where it is projected that revenues from juice will be over $14.4 billion.
5
  However, the projected growth rate of juice during this time period is not expected to exceed
1.4% per year.5 While juice sales in the US and Europe have seen stagnant growth rates in recent
years, global juice sales have been reliant on emerging markets for growth. As of 2014, global
juice was valued at $146 USD.6

Migration from CSDs to healthier alternatives
Despite being the largest sub-category in the space, the market share of CSDs (soda) has been
steadily declining for a decade1. The US per capita consumption for CSDs is expected to
continue to decline through 2018 with a negative 5-year CAGR of -3.1%. 3 Conversely, during
the same period, the entire non-alcoholic beverage category as a whole to is expected to grow at
a CAGR of 2.8%.3

The decline in the CSD market presents a substantial opportunity for growth for the healthier
sub-categories in this space. In the US the bottled water category is the second largest non-
alcoholic beverage category. The bottled water segment is expected to capitalize on the growing
health consciousness of consumers. By 2018 the global bottled water market is expected to grow
to $195 billion and enjoy a five year CAGR of 10.7%.7 This figure is expected to rise even
further up to $279.65 Billion (and 465.12 billion liters by Volume) in 2020— an 8.3% CAGR
during the period of 2014-2020.8

The global market for probiotics is expected to reach $23.9 billion by 2017 with a CAGR of
6.8% from 2012-2017.9 The largest probiotic market is Asia Pacific with estimated of $14.55
billion in 2017.9 The second largest probiotic market is Europe which is expected to be
US$11.87 billion in 2017.9 The market in North America is relatively smaller but is expected to
grow, at over 6.5% CAGR and account for over $6.5 billion by 2023.10

Growth in energy drinks and other functional beverages
In addition to declining CSD sales being absorbed by healthier alternatives, the beverage market
is seeing a shift to more functional offerings as well. These trends are not mutually exclusive,
and some view RTD coffee as a “natural energy drink.” According to Euromonitor, global sales
of energy drinks exceeded US$40 billion in 2015 and with compounded annual growth of 5.5%26
(approximately double that of the overall non-alcoholic beverage market) is anticipated to reach
approximately US$58 billion in 2020.11

In 2015 the US market for energy drinks reached nearly $13 billion. Asia Pacific market
accounted for nearly US$11 billion.11 The functional drink category (of which, energy drinks
account for approximately 59%) has also been growing at the fastest rate in Europe. In Europe
the functional drink market grew by 7.1% in 2013 to reach a value of $13.7 billion.12

Shift in the consumer preferences for non-alcoholic beverages
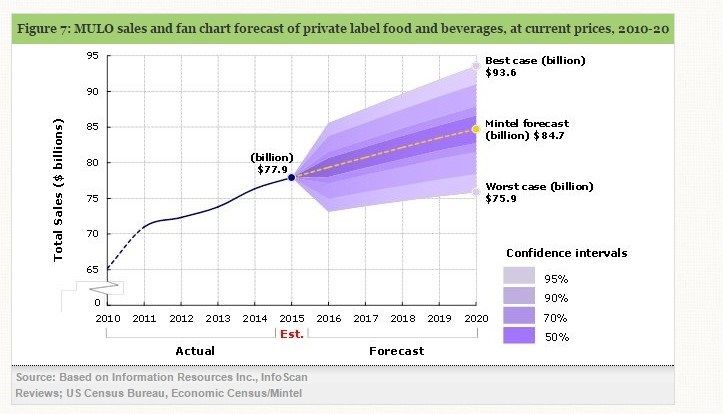
The US is currently witnessing the largest consumer demographic transformation in its history.
The portion of the overall population comprised of millennials is growing, in contrast portion of
“baby boomers” which is beginning to decline. Overall consumer attitudes are changing
commensurately. Millennials now represent roughly 80 million people or 25% of the US
population. Millennials’ spending is expected to reach 1.4 trillion by 2020, and they currently
represent 30% of retail purchases.13 Millennials seek brands with authentic stories, and are more
connected to their products. In the beverage space, they tend to seek out more genuine brands
and healthier offerings.

Notably, small brands which totaled approximately $60 billion in revenues in 2008, made up
roughly 1/3 of the non-alcoholic beverage market, are expected to grow into half of the segment,
representing a $95 billion market by 2020.1

This shift in consumer preferences is being felt by many of the leaders in CSD space. The
Associated Press reported that PepsiCo’s CEO, Indra Nooyi, said that only 25% of the
company’s global sales are from soda. When speaking to investors, Noovi emphasized that the
non-carbonated soft drinks are driving all the growth in the industry. Nooyi told analysts that
Pepsi intends to “future proof” their portfolio to capitalize on consumers’ interest in health in
wellness. We have also seen attempts by retailers to adapt to these changes in consumer
preferences. For example, Target released their “made to matter- handpicked by Target” lines
which include “natural, organic and sustainable products.”

“Private label” is no longer a stigma in food and beverage categories as products are
enjoying significant growth and traction and leading retailers build “brands”
In many Consumer verticals the phrase “private label” is sometimes construed to connote lower
quality and/or lower margins for manufacturers. In recent years this is being turned on its head
in the food and beverage industries. Leading grocers like Whole Foods (with their 360 line of
products) and Trader Joes (where the majority of products are ALL private label) have long
embraced a strategy of improving their own margins by utilizing private label offerings in their
retail network. Recently, this trend has expanded to major national chains like Kroger (with their
natural and organic Simple Truth brand) and Target (with Simply Balanced and Archer Farms)
and many others. In an August 2016 article for Marketplace, Amanda Irish, vice president of
Owned Brand Food and Essentials for Target said that Target’s strategy for spiffing up grocery
includes strengthening its three private-label food brands.14 That same article states that: “Kantar
Retail analyst Amy Koo said other big retailers, like Trader Joe's and Costco, have had great
success with their in-house brands, which some people may even prefer to name brands.” 14

According to Euromonitor in 2013 89% of global shoppers bought private label products
products and the market for them exceeded $352 billion. 15 According to Nielsen, the US market
for private label products exceeded $115 billion in 201516, of which food and beverages
accounted for $77.9 billion.17 Mintel projects that to rise to $84.7 billion in 2020.17 Mintel also
points out that the market for private label beverages in the US was $17.1 billion in 2015.17
Mintel projects that this number will continue to rise and surpass 18 billion in 2018 and 19.2
billion in 2020.17
Ready To Drink coffee growth rate leads the industry
Coffee is an essential part of the office culture in the US. A recent survey taken by Mintel,
found that 72% of the respondents drank coffee in the past 6 months, while 43% do so daily. The
largest consumers of iced coffee are millennials, consuming iced coffee more than twice as much
as Generation X.18 Millennials are also much more likely to drink cold lattes; more than half of
millennials drink cold lattes compared to one in five among Generation X and only one in ten of
baby boomers.18

The ready to drink coffee category has been enjoying explosive double-digit growth since 2011
(currently estimated to be 14% CAGR). In the US, where the market is presently estimated to be
$1.5 billion, the category has been dominated by Starbucks products, produced and distributed
through a joint venture with PepsiCo North America since 1994.19 However, very recently—in
October of 2016—Coca Cola and Dunkin Donuts announced a joint venture to manufacture and
distribute RTD coffee products that will compete directly with those of the Starbucks/Pepsi
North America partnership. Euromonitor states that the global market in 2015 was worth $18
billion and projects the US market alone to grow to approximately $3.6 billion by 2020.20
According to Mintel, young adults are willing to buy RTD coffees despite higher price points,
fueled by their interest in specialty coffee drinks and flavor variations. The quality of coffee,
accessibility, and the speed of service are the most important factors in their purchase decisions,
presenting opportunity for high quality shelf-stable and RTD coffee products. The rise of the
“smart” consumer is also affecting the current market. The smart consumer is shifting away from
drinks with artificial sweeteners to low-sugar, non-GMO products. As consumers shift from
products that use artificial sweeteners, opportunities arise for coffee products such as Cold Brew
which naturally taste smoother and less acidic because of the brewing process.

In the US, for the 52 weeks ended August 7, 2016, refrigerated RTD coffee sales jumped 13.9%
to $209.5 million, and unit sales increased 13.7% to 54.7 million. Among the top 10, Starbucks
Iced Espresso Classics saw dollar sales jump 107.5% and unit sales climbed 111.1% (see table).
Starbucks dollar sales were up 27.3% and unit sales rose 27.9%. Caribou Coffee’s recently-
introduced RTD products’ dollar and unit sales skyrocketed 435.5% and 443.9%, respectively.
Dollar sales for Califia Farms rose 194.9% and unit sales improved 182.3%.22

Multi-Sponsor Surveys interviewed 1,500 U.S. adult coffee drinkers in 2014. According to their
survey:

• Three out of four (75%) coffee drinkers now drink both hot and cold coffee beverages.23

• Nearly seven in 10 (69%) are cold coffee drinkers23
• Weekly consumption of RTD canned/bottled coffee was up from 15% in 2012 to 20% in 2014
among all cold coffee drinkers, but increased by the widest margins among Hispanics (up from
17% to 36%) and Millennials (up from 22% to 31%). We can only assume that the penetration
has grown between 2014 and 2016, and probably accelerated.23

This document is for information only. It is not an offering for sale of any securities. This
document may not be disclosed, distributed, or reproduced without the express written
permission of Green Circle Capital Partners LLC.

Sources cited in this paper may include:

   1. BevNet
   2. Transparency Market Research, May 12, 2016 04:49 , https://globenewswire.com/news-
       release/2016/05/12/839294/0/en/Non-Alcoholic-Drinks-Market-to-reach-US-1937-73-billion-by-
       2020-Global-Industry-Research-Review-2015-2016-Outlook-2020.html
   3. Jeffries
   4. Mintel, “U.S. Bottled water market grows 6.4 percent in 2015,” February 26, 2016,
       http://www.bevindustry.com/articles/89123-us-bottled-water-market-grows-64-percent-in-2015
   5. IBISWorld Industry Report 31211c Juice Production in the US. IBIS World, n.d. Web. 21 Oct. 2016
   6. Euromonitor
   7. BCC Research, July 15, 2014, http://www.bccresearch.com/pressroom/fod/global-bottled-water-
       market-reach-$195-billion-2018
   8. Transparency Market Research, January 16, 2015 07:16 , https://globenewswire.com/news-
       release/2015/01/16/697945/10115836/en/Global-Bottled-Water-Market-is-Expected-to-Reach-
       USD-279-65-billion-in-2020-By-Volume-Global-Bottled-Water-Market-is-Expected-to-Reach-465-
       12-Billion-Liters-in-2020-Transparency-Ma.html
   9. MarketsandMarkets, Dec 13, 2013, 08:30, http://www.prnewswire.com/news-releases/probiotics-
       market-worth-2393-billion-by-2017-235724141.html
   10. Global Market Insights Inc., May 10, 2016, 07:00 , http://www.prnewswire.com/news-
       releases/probiotics-market-size-to-exceed-usd-64-billion-by-2023-global-market-insights-inc-
       578769201.html
   11. Euromonitor, “The world’s unquenchable thirst for energy drinks”, Shane Starling, June 14, 2016,
       http://www.beveragedaily.com/Markets/The-world-s-unquenchable-thirst-for-energy-drinks
   12. Marketline
   13. Accenture, “Who are the Millennial shoppers? And what do they really want?”, Christopher
       Donnelly, Renato Scaff, https://www.accenture.com/us-en/insight-outlook-who-are-millennial-
       shoppers-what-do-they-really-want-retail
   14. Marketplace, “Target seeks grocery lift from private-label foods”, Annie Baxter, August 16, 2016,
       http://www.marketplace.org/2016/08/12/world/target
   15. Euromonitor International.The New Face of Private Label: Global Market Trends to 2018.
   16. Nielsen, “PLMA: Store Brands Expected To Grow As Shoppers Want More Fresh Options In
       DDB”, Kristen Cloud, July 30, 2015, http://www.theshelbyreport.com/2015/07/30/plma-store-
       brands-expected-to-grow-as-shoppers-want-more-fresh-options-in-ddb/
   17. Mintel Research database. Bonnett, M. (2016, February). Private label food trends -- US.
   18. Mintel, “Millennials drive growth of “fourth wave” iced coffee, but where do we go from here?”,
       Jonny Forsyth, June 14, 2016, http://www.mintel.com/blog/drink-market-news/millennials-drive-
       growth-of-fourth-wave-iced-coffee-but-where-do-we-go-from-here
19. 9CNBC, “Watch out, Starbucks! Dunkin' to sell ready-to-drink coffee”, Sarah Whitten, September 26,
2016, http://www.cnbc.com/2016/09/29/dunkin-to-challenge-starbucks-with-ready-to-drink-
coffee.html
20. EuroMonitor, “Cold Coffee Is Booming in the U.S.”, Jennifer Kaplan, May 23, 2016,
http://www.bloomberg.com/news/articles/2016-05-23/cold-coffee-is-booming-in-the-u-s-now-
everyone-is-piling-in
21. Gerry Kehrmouch, Beverage Business Insights, October 20, 2016
22. Information Resources Inc. (IRI), “RTD coffee and tea sales are energized”, Sarah Kennedy, October
10, 2016, http://www.dairyfoods.com/articles/91985-rtd-coffee-and-tea-sales-are-energized
23. Multi-sponsor surveys, October 7, 2014 , http://www.prnewswire.com/news-releases/growing-
interest-in-cold-rtd-coffee-278400061.html
24. Mintel, “The strength of Cold Brew”, Elizabeth Sisel, July 29, 2016,
http://www.mintel.com/blog/drink-market-news/the-strength-of-cold-brew
25. Mintel, “Peet’s Coffee Unveils Super Premium Ready-to-Drink Cold Brew”, July 25, 2016,
http://www.businesswire.com/news/home/20160725005240/en/Peet%E2%80%99s-Coffee-
Unveils-Super-Premium-Ready-to-Drink-Cold
26. IbisWorld
Stu Strumwasser
Managing Director
Green Circle Capital Partners
111 John St., Suite 630
New York, NY 10038
Tel: (646) 875-4870
Email: stu@greencirclecap.comYou can also read