Mobile Phone Sales Forecast Based on Support Vector Machine
←
→
Page content transcription
If your browser does not render page correctly, please read the page content below

Journal of Physics: Conference Series

PAPER • OPEN ACCESS

Mobile Phone Sales Forecast Based on Support Vector Machine
To cite this article: Zekun Duan et al 2019 J. Phys.: Conf. Ser. 1229 012061

View the article online for updates and enhancements.

                                This content was downloaded from IP address 176.9.8.24 on 10/09/2020 at 03:42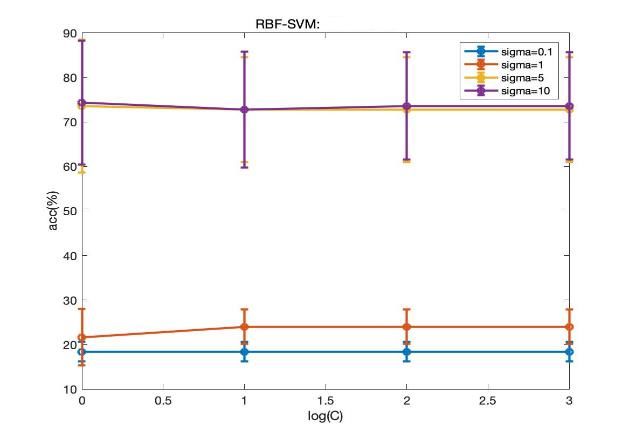
CMVIT2019                                                                                                       IOP Publishing
IOP Conf. Series: Journal of Physics: Conf. Series 1229 (2019) 012061                     doi:10.1088/1742-6596/1229/1/012061

Mobile Phone Sales Forecast Based on Support Vector
Machine

                     Zekun Duan1, 2 , Yanqiu Liu1 and Kunyuan Huang1
                     1.
                          College of Computer Science, Inner Mongolia University, Hohhot 010021, China
                     2.
                          E-mail: 18603582530@163.com

                     Abstract: In this paper, we select price, wear resistance, resistance to fall, charging interval,
                     battery life, communication stability, photo effect, appearance design, memory size and
                     whether to buy again as input variables, take different mobile phone sales foreground grade as
                     output variables based on the survey data of all kinds of mobile phone users in the current
                     Chinese market, using support vector machine regression algorithm (SVMR) 、BP Neural
                     Network Algorithms and K-Nearest Neighbor Algorithms to establish models and predict the
                     sales prospects of various kinds of mobile phones in China. The prediction results show that
                     the predicted value of the mobile phone sales prediction model constructed by SVMR is
                     basically consistent with the actual sales of all kinds of mobile phones in the market, which can
                     provide some guidance for the manufacture and sale of various of mobile phones.

1.Introduction
With the improvement of science and technology and the rapid development of information
technology in countries of the world, communication (mobile phone) industry has become an
important part of national economic development[1]. China alone sold 455.93 million smartphones in
2017, up 1.1% from 2016, according to “Analysis Data”. China's smartphone sales are expected to be
around 437.99 million units by 2020, indicating that the mobile phone industry has a huge market
value[2]. The broad market prospect and billions of mobile phone users have made mobile phone
R&D, manufacturing and sales a strategic high ground for all the major handset manufacturers to
compete with each other[3].Once there is a problem in a certain link, it may affect the sales of the
whole brand and even the sustainable development of the whole enterprise. Selling is not only selling
products, but also contacting the market while selling, understanding the development trends of
various mobile phone brands in the market, and the general needs of the vast number of users in the
market. So as to provide reference suggestions and guidance for mobile phone R&D, and promote the
new generation of products to have a broader market and sales prospects[4].Therefore, through the
research of users' feedback on the use of all kinds of mobile phones, we can predict the market
prospects of all kinds of mobile phones, which have important practical significance for the strategic
deployment and product upgrading of products.
   In recent years, artificial intelligence and big data mining technology have been widely used in
various prediction models, such as mathematical statistics, grey theory, linear regression, neural
network, genetic algorithm and support vector machine. Many scholars have also used this method to
study the current situation and development trend of various kinds of products, and obtained a lot of
research results[5-8].The examples based on mathematical statistics and linear regression algorithm

              Content from this work may be used under the terms of the Creative Commons Attribution 3.0 licence. Any further distribution
              of this work must maintain attribution to the author(s) and the title of the work, journal citation and DOI.
Published under licence by IOP Publishing Ltd                          1
CMVIT2019 IOP Publishing
IOP Conf. Series: Journal of Physics: Conf. Series 1229 (2019) 012061 doi:10.1088/1742-6596/1229/1/012061
are the most among these research results, including the annual forecast of all kinds of mobile phone
sales by major media. However, most of these predictions are based on the manufacturer's sales
volume and related information to judge the next year's sales volume, and don’t fully consider the
subjective judgment and specific usage of users.
Support Vector Machine (SVM) [9-12]was first proposed by Corinna Cortes and Vapnik in 1995.
This algorithm is a sample data processing method based on statistical theory, referring to kernel
function and following the principle of structural risk minimization, especially has many unique
advantages in solving the small sample, nonlinear and high-dimensional pattern recognition, can
effectively improve the accuracy of model prediction, avoid the problems such as BP neural network
local optimum and long convergence time, etc.
In view of these conditions, we based on support vector machine (SVM) to predict the sales
prospects of all kinds of mobile phones in this paper.
2. Data Processing and Research Ideas
2.1 Data Acquisition
We take all kinds of mobile phone users in the current market as the research object, collects more
than 50,000 comment data from JD.COM by using Octopus Collector. At the same time, the python
compiler is used to de-duplicate and delete redundant data. Besides, the mobile phone comment
features are extracted to use in this paper. Finally, the 10 dimensions of market price, wear resistance,
fall resistance, charging time, battery life time, communication stability, photographic effect,
appearance design, memory size and whether to buy again are used for statistics, and we get more than
5000 valid data. Among them, 1026 items were randomly selected as the experimental data in this
paper.
For achieving the unified operation of the data, this experiment take data in the Excel table for
processing, then imported into the MySQL5.5 database for processing. After completing the above
operations, in order to improve operational efficiency, we used Heidi SQL 9.5 (a software of
management database by graphical approach), we can make data processing is achieved by
Standardized and integrated approach.
2.2 Data Transformation
In the setting of the comments, most of the data answer are determined by the user's subjective
judgment, so in the subsequent processing, it is necessary to quantify the corresponding different
contents, for meeting the requirement of further experiments. For example, the battery life of mobile
phone is divided into five levels, which are set as I={1,2,3,4,5}. Individually: 3 hours should be grade
1, 6 hours should be grade 2, 9 hours should be grade 3, 12 hours should be grade 4, 12 hours or more
should be grade 5.
2.3 Research Ideas
In general, The sales prospects of mobile phones are the result of the interaction and synergy of
various factors about the market. The relationship of mobile phones is complex and has
multidimensional non-linear characteristics. At the same time, there is also a typical non-linear
relationship between the sales prospects of mobile phones and their various influencing factors. So,
Support vector machine can map related data to the high-latitude feature space through non-linear
manner, and constructs linear regression in the high-latitude feature space, so as to obtain the non-
linear regression effect in the low-dimensional space. After consulting the relevant literature, I found
there is only one class of samples in support vector machine regression (SVMR) model. The optimal
plane to be sought is to minimize the "total deviation" of all sample points from the hyperplane, and
the sample points are between two boundaries, which is equivalent to Find the problem of maximum
separation. The model consists of three parts: input layer of dependent variable, intermediate
processing layer and final output layer. The specific model is shown in Figure 1.
2CMVIT2019 IOP Publishing
IOP Conf. Series: Journal of Physics: Conf. Series 1229 (2019) 012061 doi:10.1088/1742-6596/1229/1/012061
Figure 1. Support vector machine model
Figures in parts In the above model, where x1-xn are low-dimensional input vectors, Xi=(x1,
x2, ... xn); < > is a kernel function, is a support vector, is a function of
high-latitude space mapping. The linear combination function ) is obtained by concatenating the
input vector and the kernel function by the Lagrangian coefficients ( )of the corresponding
support vectors[13-16].
(1)
At present, the kernel functions referenced in the support vector machine regression model mainly
include linear kernel function, polynomial kernel function, Sigmoid kernel function, RBF kernel
function, etc. In this study, we consider the different performance and computational convenience of
different kernels. So, we mainly use grid search to select the optimal parameters.
3.SVMR Prediction Model Contrast Test
3.1 Parameter Selection
After investigation, I finally fully consider the sales of various types of mobile phones in the market
and the actual value of users' attention. So this paper from the market price of various types of mobile
phones, wear resistance, drop resistance, charging time, battery life, communication stability, photo
effects, design, memory size, and purchase again, total Ten dimensions.
Then, I decided quantitative statistical analysis about 1218 valid data obtained, for example,
according to the strong degree, take whether to purchase again of the user's wishes classification by
rank: will definitely buy is 5, will buy is 4, may buy is 3, uncertain is 2, no purchase is 1;Besides, for
wear resistance, resistance, design, communication stability, etc. according to special satisfaction,
satisfaction, satisfactory, okay, unsatisfied are divided into: 5, 4, 3, 2, 1 ,it’s five levels .
3.2 Sample determination
After we preprocess the effective data, the normalized new matrix is used as the input data of SVMR,
and the sales prospects of mobile phones are sorted according to quantitative analysis, which is
divided into 10 grades, the output data corresponding to SVMR. In this paper, a one-to-one
classification method is used to form a two-classification problem. That is to say, if there are N
classes, we need to train n*(n-1)/2 classifiers and use each classifier to verify the samples, so that we
can get the corresponding prediction results.
In the experiment, three different machine learning methods, Support Vector Machine Regression
(SVMR), Back Propagation Neural Network (BP Neural Network) and K-Nearest Neighbor (K-
Nearest Neighbor) algorithm, are compared on the platform of Matlab R2017a.
3CMVIT2019 IOP Publishing
IOP Conf. Series: Journal of Physics: Conf. Series 1229 (2019) 012061 doi:10.1088/1742-6596/1229/1/012061
After many experiments, it is found that 10% data is better for training. At the same time, 3 fold
cross validation method is used to compare the results. The results are shown in Figure 2 and Figure 3.
Figure 2. Effect diagram of BP neural network
Figure 3. K-Nearest Neighbor Model Effect Chart
After that, the effect of support vector machine using RBF kernel function is obviously better than
the other two methods. Finally, when the Sigma value is 10, the effect is the best, which can reach
84.97%. The results are shown in Figure 4.
Figure 4. Support Vector Machine Model Effectiveness Diagram
The other corresponding parameters are default values, and take the originally data training set and
verification set into the above prediction model, and take the output values are denormalized, to obtain
the sales prospect level corresponding to different product names, and combine them with the select
data, and the proportion of users of different brands, through various factors predicted to be the
proportion of the brand in the market. The specific forecast results, the market ratio and actual value of
4CMVIT2019 IOP Publishing
IOP Conf. Series: Journal of Physics: Conf. Series 1229 (2019) 012061 doi:10.1088/1742-6596/1229/1/012061
various types of mobile phone sales in the world from 2014 to 2016, and compared with the predicted
values of the SVMR model as shown in Table 1, Table 2 and Figure 5 below:
Table 1. Experiments predict sales prospects of 10 brands of mobile phones
Sales Prospect brand Occupancy Sales Prospect brand Occupancy
Level rate Level rate
1 Apple 21.63% 6 OPPO 6.82%
2 HUAWEI 19.76% 7 LG 5.34%
3 VIVO 15.47% 8 Lenovo 4.78%
4 xiaomi 14.96% 9 TCL 2.72%
5 Samsung 7.32% 10 ZTE 1.20%
Table 2 .Ratio of Actual Global Sales of Mobile Phones in 2015-2017
2015 2016 2017
Ranki
ng Market Market Market
brand brand brand
share share share
1 Samsung 24.70% Samsung 22.60% Samsung 20.90%
2 Apple 18.20% Apple 15.60% Apple 14.53%
3 HUAWEI 8.30% HUAWEI 11.10% HUAWEI 13.71%
4 Lenovo 5.40% OPPO 8.50% OPPO 9.21%
5 LG 5.20% VIVO 7.10% VIVO 7.92%
6 xiaomi 5.20% LG 5.50% xiaomi 5.43%
7 OPPO 3.80% xiaomi 3.80% LG 5.21%
8 TCL 3.70% Lenovo 3.80% Lenovo 3.11%
9 VIVO 3.60% TCL 3.20% TCL 2.87%
10 ZTE 3.40% ZTE 3.30% ZTE 2.63%
- other 18.50% other 15.50% other 14.48%
Figure 5. Comparison of the actual value with the predicted value of SVMR model
By comparing tables 1 and 2, we can find that SVM is helpful to establish the forecasting model of
mobile phone sales prospects, and the forecasting value is basically consistent with the actual sales
value announced by mobile phone manufacturers. Altogether, it is expected that the sales rankings of
5CMVIT2019 IOP Publishing
IOP Conf. Series: Journal of Physics: Conf. Series 1229 (2019) 012061 doi:10.1088/1742-6596/1229/1/012061
major manufacturers will not change dramatically in recent years, but Huawei is catching up with
Apple step by step, while Xiaomi and Vivo are also developing rapidly.
4.Summary
This article is based on the current market price of various mobile phones, their wear resistance, drop
resistance, charging time, battery life, communication stability, camera effect, design, memory size,
whether to buy again as dependent variables, they are, input variables. The sales forecast levels of
different mobile phones are the output variables in this article. This article also applies SVM to
establish the forecasting model of various mobile phone sales prospects. The predicted value is
basically consistent with the actual sales value announced by each mobile phone manufacturer. This
model can provide guidance for product configuration and sales for various mobile phone
manufacturers, which has certain practical value.
References
[1] S Y Lei 2018 Research on Precision Marketing of OPPO Mobile Phone under the Background
of Big Data(Hubei University of Technology)..
[2] 2018 The global smartphone market is saturated with Huawei's millet against the surge(Screen
printing industry) p60.
[3] H Si and Y J Jiang 2018 Bank Personal Credit Evaluation Based on SVM Optimization
Algorithm (Industry and Technology Forum)pp 70-71.
[4] B WWu 2018 Application of grey forecasting in hand sales(Shandong Industrial
Technology)p240.
[5] L He 2018 Huawei's mobile phone business marketing strategy research(Jilin University).
[6] B. Trafalis 2008 Short term forecasting with support vector machines and application to stock
price prediction(International Journal of General Systems).
[7] Kyoung-jae 2003 Kim Financial time series forecasting using support vector
machines(Neurocomputing).
[8] X J Ma 2018 Price Forecast Based on Support Vector Regression Model(Zhengzhou
University).
[9] Machine Learning 1995 Support-Vector Networks(Corinna Cortes, Vladimir Vapnik)
[10] Christopher J.C. Burges 1998 A Tutorial on Support Vector Machines for Pattern
Recognition(Data Mining and Knowledge Discovery).
[11] Z X Lu and Y D Li 1999 Interactive Support Vector Machine Learning Algorithm and Its
Application (Journal of Tsinghua University (Natural Science Edition).).
[12] X G Zhang 2000 About statistical learning theory and support vector machine(Journal of
Automation)pp36-46.
[13] X B Da N Wang and Y Liu 2018 A BGP anomaly detection method based on improved
Gaussian kernel function(computer engineering)pp1-10.
[14] 2004 Experimentally optimal V in support vector regression for different noise models and
parameter settings(Athanassia Chalimourda. Neural Networks ).
[15] Li X Z Su R G Zhang C S and Shi X Y 2019 Prediction model of chlorophyll a concentration in
the Yangtze River estuary and its adjacent waters based on support vector machine(Journal of
Ocean University of China (Natural Science Edition))pp69-76.
[16] Zhang Y Z and Jia L X 2014 SVR-based house price forecasting model based on grid--taking
Zhengzhou City as an example(Henan Science)pp1659-1663.
6You can also read