Gurit Full Year 2015 Results - Zurich, March 15, 2016

Page created by Ana Moran
 
CONTINUE READING
Gurit Full Year 2015 Results - Zurich, March 15, 2016
Gurit
Full Year 2015 Results

Zurich, March 15, 2016
Gurit Full Year 2015 Results - Zurich, March 15, 2016
This presentation may include forward-looking statements that reflect the
 intentions, beliefs or current expectations and projections of Gurit Holding
 AG about the future results of operations, financial condition, liquidity,
 performance and similar circumstances.

 Such statements are made on the basis of assumptions and expectations
 which may prove to be erroneous, although Gurit Holding AG believes
 them to be reasonable at this time.

Slide 2                                                                         Corporate
Gurit Full Year 2015 Results - Zurich, March 15, 2016
Key Business Performance Reasons FY 2015

          FY 2015 was operationally very successful mainly due to:

           Strong global Wind market growth of some 22% to ca. 63 GW of new WTG

           Market share gains and customer wins in Wind Energy core materials sales
            and a record year in Tooling

           Operational efficiency improvement in sites which had issues in 2014

Slide 3                                                                        Corporate
Gurit Full Year 2015 Results - Zurich, March 15, 2016
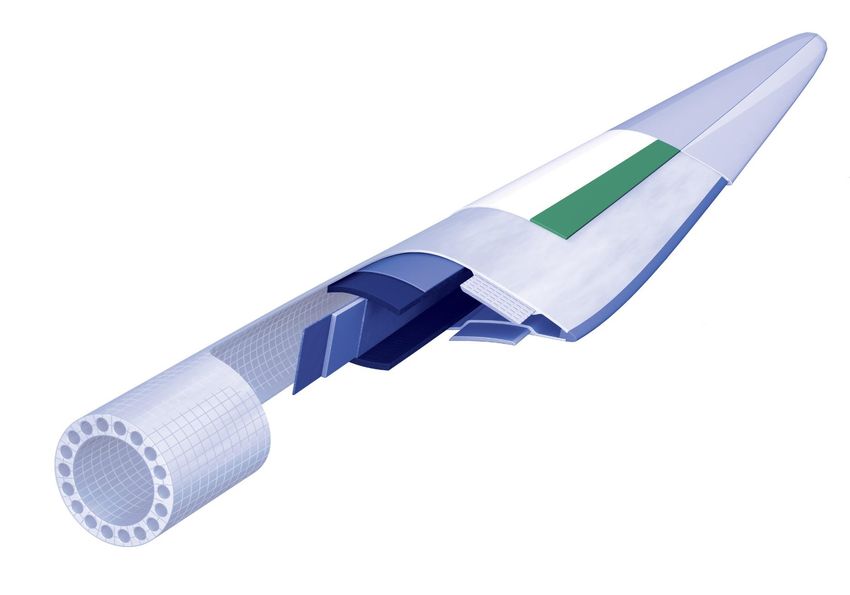
Key Business Results KPI FY 2015

          FY 2015 with significantly improved financial KPI's:

           Growth: Net sales growth of 10.4% to CHF 359.4 m (2014: 335.8 m)

           Operating Profit: Mid of guidance range at 9.2% RoS (2014: 4.2%) and
            CHF 33.0 m (2014: 14.2 m)

           Investment for future growth increased:
               Capex of CHF 16.7 m (2014: 9.2 m): mainly Auto, Aero, Balsa, Tooling
               R&D investment raised by CHF 0.9 m to 1.8% (2014: 1.7%) of net sales

           Balance Sheet and Cash Flow KPI:
              Cash Flow of CHF 37.2 m (2014: 7.6 m)
              Net Cash Position of CHF 20.4 m (2014: 4.2 m)
              Equity Ratio solid at 71.4% (2014: 68.4%)

Slide 4                                                                        Corporate
Gurit Full Year 2015 Results - Zurich, March 15, 2016
Development by Key Markets
Gurit Full Year 2015 Results - Zurich, March 15, 2016
Wind Energy

Slide 6        Corporate
Gurit Full Year 2015 Results - Zurich, March 15, 2016
Wind Energy – Strategy & Achievements

 Strategy                                                        GW Installed Annually*
  Achieve balanced sales split across regions
                                                                 63
     and customers                                 70                     60                       67
                                                                                  59      63
                                                   60                     56                             Americas
  Achieve top 3 market position for entire core         52      54
                                                   50
     materials product range
                                                   40                                                    Asia /
  Develop further cost-efficient, enabling        30                                                    Pacific
     technologies to help reduce cost of KWH       20
                                                   10
                                                                                                         EMEA
                                                    0
 Recent achievements
                                                        2014 2015 2016 2017 2018 2019
  All core material plants fully loaded in 2015        * Source: GWEC 2014 & Update 2016 for 2015 CY

  Balsa wood capacity expansion in Ecuador
    and China in execution                              2015:
                                                         63 GW installed vs 54 GW anticipated
  Balsa wood sourcing in APAC on top of
    Ecuador for growth and feedstock balance            2016:
                                                         China expects drop by -15 to -20%
  Win of 2 significant new customers
                                                         India / US anticipated to grow
  High quality level maintained, operations             We anticipate a total of some 60 GW
    efficiency improved hence growing ca. 40%
                                                        2017ff:
    in core overall (offsetting -16% prepreg
                                                         CAGR of some 4.5% projected
    decline)

Slide 7                                                                                                 Corporate
Gurit Full Year 2015 Results - Zurich, March 15, 2016
Wind Energy – Results & Outlook

 Market environment 2015 – record of 63 GW
  Americas – moderate market development with
    solid demand
                                                             Wind Energy: Quarterly Net Sales
  Asia – strongest growth rates in terms of        MCHF
    installed GW                                    50
                                                                               35.8 39.8 40.8 39.1
                                                                35.5
  Europe – mature market with stable demand        40     31.3      32.2 32.2
                                                    30
                                                    20
 Results FY 2015                                    10
                                                     0
  Net sales of CHF 155.4 million, up 18.4% (FY          Q1-2014 Q2   Q3   Q4 Q1-2015 Q2   Q3     Q4
    2014: 131.2 million)

  Outlook
   Some 60 GW expected globally in 2016: China
    some 15-20% lower than 2015, strong growth in
    India, single-digit growth in Americas and
    EU/MEA
   Deploy Balsa capacity increase in Ecuador and
    China during 2016
   Strong focus on product innovation plans for
    SAN/PVC/PET
Slide 8                                                                                         Corporate
Gurit Full Year 2015 Results - Zurich, March 15, 2016
Aerospace

Slide 9      Corporate
Gurit Full Year 2015 Results - Zurich, March 15, 2016
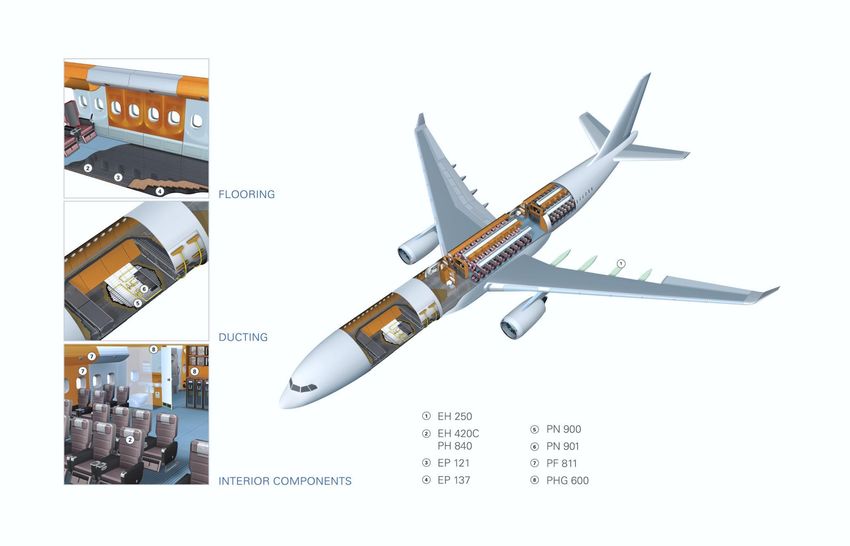
Aerospace – Strategy & Achievements

 Strategy
  Maintain leading position in aircraft interiors
     and certain structural applications at Airbus
  Develop interior material position in Boeing               Aerospace: Accessible Market*
     and others                                      MCHF
                                                     300                                           227
  Enter structural material market for business              185           195   205    216
                                                     200
     and regional jets as well as for nacelles
                                                     100
  Focus on next-generation materials
                                                      0
                                                             2016       2017      2018   2019      2020
 Recent achievements                                        *Own estimate

  Installation and qualification of new prepreg
    tower in Kassel completed
  Successful renewal of contracts with existing
    customers in Europe
  Production qualification program by Boeing
    ongoing and to come to result

Slide 10                                                                                        Corporate
Aerospace – Results & Outlook

 Market environment                                        Airbus Deliveries per Program
  Delays in A350 ramp-up                        units
                                                 700
  Lower A380 build rates                                     30
                                                 600                            24          A380
  Consolidation in the supplier base            500
                                                             108
                                                                                86          A350
    creating opportunities for Gurit in the US   400
                                                 300                                        A330s
                                                             490              436
 Results FY 2015                                 200
                                                 100                                        Single
  Net sales of CHF 42.8 million (2014:                                                     Aisle
                                                   0
    CHF 33.7 million)
                                                           FY 2014        Jan-Nov 2015
  Result affected by FX effect
                                                           Aerospace: Quarterly Net Sales
  Outlook                                        MCHF
   Gain market share in mid-size OEMs            20
   Boeing qualification with significant mid-
                                                         11.8 12.7 11.5              12
    term sales potential to be completed in                             10.4              10.2 11.5 9.2
                                                  10
    1HY 2016
   Acquisitive growth acceleration –
    depending on suitable targets                  0
                                                          Q1 Q2      Q3    Q4     Q1 Q2        Q3       Q4
                                                         2014                    2015
Slide 11                                                                                             Corporate
Other Material Markets

Slide 12                 Corporate
Other Material Markets – Strategy & Achievements

 Strategy                                                               Minimum Size of Industrial
  Further expand in all leisure and commercial                                 Market
     boat sectors                                                            Opportunities*
                                                        MCHF
  Generate additional sales leads and                  250
     qualifications for automotive materials offering                                                         200
                                                        200
  Further advance material qualification for new       150
                                                                                                   150
     application fields (rail, ballistics, etc.)                                    100
                                                        100
                                                                   50
                                                        50
 Recent achievements
  Achieved new qualifications for automotive            0
                                                                   Civil      Other Industrial     Marine   Automotive
    materials for visual carbon and RTM resins with            construction    (e.g. Medical,                Materials
                                                                               Ballistics, etc.)
    many OEM‘s                                                 *Own estimate
  Additional automotive and industrial accounts
    won (civil, prostheses, etc.)
  Further development of automotive materials
    offering developing as planned, beta testing
    achieves positive feedback

Slide 13                                                                                                    Corporate
Other Material Markets – Results & Outlook

 Market environment
  Marine market showing steady development –
    especially in patrol boat sector
                                                                       Other Material Markets:
  Addressable automotive composite material                           Quarterly Net Sales
    market growing                                    MCHF
  Automotive materials showing progress based        30
                                                             18.2 19.4    21   20.7 19.5 19.4           20.4
    on new materials launched                         20                                         16.5

                                                      10
 Results FY 2015
                                                       0
  Net sales of CHF 75.7 million (FY 2014: 79.2
                                                           Q1 2014Q2     Q3    Q4 Q1 2015Q2      Q3     Q4
    million)
  Marine sales volumes showing cyclicality in
    some boat types; 2014 high sales baseline
 Outlook
  Industrial markets expected to continue to
    grow on a moderate level
  Dynamic momentum to set in once the auto-
    motive technology adoption gap has been
    overcome and programs deployed; high single-
    digit million CHF contribution in 2016 expected

Slide 14                                                                                        Corporate
Tooling

Slide 15   Corporate
Tooling – Strategy & Achievements

 Strategy

      USP's:
         Asia: Leader in affordable, quickly available quality moulds for wind turbine blades
         Internationally: Leader in quality, competitive, quickly available, higher-volume
          mould-making and outsourcing partner of choice

      Global Growth: Further penetrated European client base during 2015 also for multi-
       megawatt projects (Blade length >70 m)

      Offering: Continue to develop and sell related equipment (metal structure products) and
       support Composite Components

 Recent achievements

      Growth: Record loading and sales in 2015 – more than 50 mould systems produced

      Efficiency: Production efficiency on a sustained good level

      Capacity: Start of next factory expansion in Taicang (Completion in Q2-2016)

Slide 16                                                                                Corporate
Tooling – Results & Outlook

 Market environment
  Strong demand especially in Asia (Multi
    Megawatt programs)
                                                                 Tooling: Quarterly Net Sales
  Trend to longer, special moulds in small
    series, need for larger series of moulds of   MCHF
    same size (Re-tooling)                        20                                             16.8 15.9
                                                                14.1               14.5
  Ongoing trend to outsource mould                      11.1          10.9 10.7          11.8
    manufacturing by OEMs                         10

                                                   0
 Results FY 2015
                                                       Q1 2014 Q2      Q3   Q4 Q1 2015 Q2        Q3   Q4
  Net sales of CHF 59.0 million, up 26.1%
    (FY 2014: 46.8 million)

 Outlook
  Strong order backlog for first half of 2016
  Some softening of demand expected for
    second half of 2016

Slide 17                                                                                           Corporate
Composite Componets

Slide 18               Corporate
Comp. Components – Strategy & Achievements

 Strategy
                                                                    Size of new Automotive
  Further grow client/project base for unique, complex-            Press Technology Market*
     shaped, smaller series, Class-A, lightweight exterior   MCHF
     car body panels                                         120
                                                             100
  Win additional orders for industrialized press
                                                              80
     manufacturing technology for less complex-shaped,
                                                              60
     higher volume exterior car body panels
                                                              40
  Win orders for bus and other vehicle parts                 20
                                                               0
                                                                    Car Body Panels up to 25,000 upa
 Recent achievements                                                *own estimate

  Major industrialized car part production facility in
    Hungary implemented in time and cost
  Supply of visual carbon roofs produced with the new
    press technology
  First engineered carbon hoods for volume contract
    delivered to South Europe

Slide 19                                                                                         Corporate
Comp. Components – Results & Outlook

 Market environment
  Increasing interest in the automotive market for
    composite solutions – especially for weight,        Composite Components: Quarterly Net Sales
    parts accuracy and visual carbon components
  Interest in composite parts for busses and         MCHF
                                                      20
    other vehicles
                                                                               11.1
                                                      10     6.5   6.5   8.1          7.5   7.4   5.9   5.6
 Results FY 2015
                                                       0
  Net sales of CHF 26.4 million                           Q1 2014 Q2    Q3    Q4 Q1 2015 Q2      Q3    Q4
    (FY 2014: 32.3 m)
  Time gap between projects creates temporary
    dent
  Result also affected by FX effect

 Outlook
  Gain more orders for pressed and manual
    parts for growth

Slide 20                                                                                          Corporate
Financial Results 2015
Net Sales Analysis by Markets

 Net sales in MCHF
                                                                                     •   Strong wind market in Asia
                                                           335.8       359.4
                                                                                         drove significantly increased
       Materials         Components            Tooling
                                                                                         core material sales, more
                                                                                         than offsetting a prepreg
    167.0      168.8      177.8      181.6                                               program end

                                                                                     •   Other material markets
                                                                                         currency-adjusted close to
                                                                                         previous year
   1HY 2014   2HY 2014   1HY 2015   2HY 2015               FY 2014   FY 2015

                                                                                     •   Components sales affected
  Net sales by markets                2015          2014 ∆ 2015 vs ∆ 2015 vs             by regular project
  in MCHF                                                    2014       2014             expirations and the start of
                                                                      FX adj.            production delay for a large
   Wind Energy                        155.4        131.2       18.4%        23.9%        project
   Other Material markets             118.6        125.5       -5.5%         -1.4%
  Composite Materials                 274.0        256.7        6.7%        11.6%
  Composite Components                 26.4         32.3      -18.2%       -16.2%
                                                                                     •   Record setting Tooling
  Tooling                              59.0         46.8       26.1%        21.6%        sales, again driven by a
  Total Net Sales                     359.4        335.8        7.0%        10.4%        strong wind energy market

Slide 22                                                                                                     Corporate
Customer Concentration (Top 5 Customers)

    60%

                  3%

    50%           8%

    40%                              4%
                  12%
                                     5%
                                                        4%
    30%                              9%                 4%                 5%
                  13%
                                                        6%                 5%

    20%                              10%
                                                                           7%
                                                        8%

                                                                           7%
    10%           21%
                                     15%                13%
                                                                           8%

     0%
                  2012               2013               2014               2015

           Customer concentration profile continuously improved over last years

Slide 23                                                                          Corporate
Operating Profit and EBIT Development

              Operating profit (% Net sales)    RONA (incl. Goodwill*)
                                                                            •   Operating profit at medium
                                       14.3%
                                                                 13.7%          term target of 8 - 10% of net
                            12.4%
                                                                                sales, thanks to:
                                                                                • record setting Tooling sales
     6.4%
                                                                                  and high utilization of core
                                                       5.8%
                 5.4%                                                             material capacities
                                                                                • favorable Composite
                                         9.5%

                                                                     9.2%
                              8.9%

                                                                                  Materials product mix
       4.6%

                   3.8%

                                                        4.2%
                                                                                • favorable market conditions
                                                                                  within Wind Energy market
                                                                                • operational improvements
     1HY          2HY        1HY        2HY           FY 2014    FY 2015
     2014         2014       2015       2015

                                                                            •   Significant RONA
                                                                                improvement and trend
                                                                                based on increased
 *Rona of prior periods were recalculated in conformity with the                operating profit development
  revised calculation at Year-End 2015 to improve comparability to              on a stable asset basis
  IFRS financial statements

Slide 24                                                                                             Corporate
Operating Profit Bridge FY 2014 to FY 2015

Slide 25                                      Corporate
Exchange Result and Tax

 Exchange result
                                               •   Exchange result in 2HY
      0.3                 0.4
                                 0.2               2015 improved versus 1HY,
                                                   mainly due to unhedged
            -0.1                        -0.6       portions of net assets
                   -1.1
                                                   exposures in USD and EUR
                                                   – both currencies
                                                   strengthened in 2HY.
     1HY    2HY    1HY    2HY     FY     FY
     2014   2014   2015   2015   2014   2015

 Income Tax Expense

                                               •   Income tax expenses
                                                   burdened primarily by not
                                                   recoverable withholding
                                                   taxes.

                                               •   Unfavorable effects from not
                                                   capitalized tax losses more
                                                   than offset by the utilization
                                                   of available tax losses

Slide 26                                                                  Corporate
Profit and Loss

  Consolidated P&L                                       2015            2014          Variance
                                                      MCHF     % NS   MCHF     % NS   MCHF %-points
  Net sales                                           359.4 100.0%    335.8 100.0%     23.6   0.0%
  Gross margin                                        186.2   51.8%   166.1   49.5%    20.0   2.3%
  Personnel expense                                    -83.8 -23.3%    -89.9 -26.8%      6.1  3.5%
  Other operating expenses                             -69.4 -19.3%    -62.0 -18.5%     -7.3 -0.8%
  Operating profit                                      33.0   9.2%     14.2   4.2%    18.8   5.0%
  Non-operating & e.o. result                            0.0   0.0%      2.0   0.6%     -2.0 -0.6%
  EBIT                                                  33.0   9.2%     16.2   4.8%    16.8   4.4%
  Finance expenses, net                                 -1.3  -0.4%     -1.0  -0.3%     -0.3 -0.1%
  Taxes                                                 -9.1  -2.5%     -4.1  -1.2%     -5.0 -1.3%
  Net result                                            22.6   6.3%     11.1   3.3%    11.5   3.0%
  Earnings per bearer share                           CHF 48.24       CHF 23.74
  Distribution per bearer share (proposed/resolved)   CHF 15.00       CHF 8.50

Slide 27                                                                                 Corporate
Balance Sheet

  CONSOLIDATED ASSETS                   Dec 2015       Dec 2014        Variance

                                        MCHF       %   MCHF       %   MCHF %-points
  Cash and cash equivalents              29.8    12%    29.0    11%     0.8     0%
  Trade receivables                      65.2    26%    67.8    27%    -2.6    -1%
  Inventories                            51.2    20%    54.8    22%    -3.6    -1%
  Other current assets                   20.2     8%    19.6     8%     0.7     0%
  Deferred income tax assets              3.1     1%     2.4     1%     0.7     0%
  Property, plant and equipment          75.4    30%    73.8    29%     1.6     1%
  Intangible assets                       5.9     2%     5.7     2%     0.3     0%
  Other non-current assets                0.3     0%     0.4     0%    -0.1     0%
  TOTAL ASSETS                          251.2   100%   253.4   100%    -2.1     0%

  CONSOLIDATED LIABILITIES AND EQUITY   Dec 2015       Dec 2014        Variance
                                        MCHF       %   MCHF       %   MCHF %-points
  Borrowings                              9.5     4%    24.8    10%    -15.3   -6%
  Trade payables                         25.0    10%    24.4    10%      0.5    0%
  Other current liabilities              30.5    12%    27.1    11%      3.4    1%
  Deferred income tax liabilities         3.5     1%     0.2     0%      3.2    1%
  Provisions                              3.4     1%     2.9     1%      0.5    0%
  Equity                                179.5    71%   173.4    68%      6.1    3%
  TOTAL LIABILITIES AND EQUITY          251.2   100%   253.4   100%     -2.1    0%

 • Working capital reduced by CHF 7m despite sales increase, partly impacted by
   translation effects
 • Solid balance sheet: Net cash of CHF 20m, Equity ratio of 71% and Quick Ratio of 173%
Slide 28                                                                              Corporate
Cash Flow

  Group Consolidated Cash Flow                   2015         2014      Variance

                                                    MCHF        MCHF        MCHF
  EBIT                                                33.0       16.2         16.8
  Depreciation, amortisation, impairment               9.6        9.5          0.1
  Change in working capital                            0.4       -7.6          8.0
  Income tax paid                                     -5.8       -7.3          1.5
  Other cash flow from operating activities            0.0       -3.2          3.2
  Net cash flows from operating activities            37.2        7.6         29.6
  Purchase of PPE and Intangibles                    -16.7       -9.2         -7.5
  Proceeds from sale of PPE                            0.0        2.4         -2.4
  Free Cash Flow                                      20.6        0.8         19.8
  Change in borrowings                               -14.4        7.3        -21.7
  Distribution to shareholders                        -4.0       -3.5         -0.5
  Purchase of treasury shares                         -0.2       -0.5          0.3
  Repayments of loans receivable                       0.2        0.2          0.0
  CHANGE IN CASH AND CASH EQUIVALENTS                  2.2        4.3         -2.2

 • Strong operating cash flow due to strong operating result and net working capital
   improvements
 • Largest investment program in years, mainly related to a new prepreg tower in Kassel and
   the Hungary plant expansion
 • Significant reduction in borrowings, leading to net cash position of CHF 20m at year-end

Slide 29                                                                             Corporate
Financial Results 2015

Conclusion
Strategic Direction and
Outlook 2016
Strategy and Execution 2015-2020

            Key Markets for Gurit Advanced Composites:

               Wind, Aerospace and Automotive – 3 key strategic growth markets

               Marine and Industrial – 2 key niche markets

            Growth Direction and Ambition:

               Grow Aerospace and Automotive together with Wind to 3 strong pillars

               Achieve single digit yoy organic growth; accelerate with M&A where
                suitable technological, geographical or offering complementing
                businesses are available

Slide 32                                                                      Corporate
Strategy Deployment 2015 – Operations Key
 Notes
            HRM
               Senior Leadership Team completion and development
               Organisational Development in growing businesses
               Improvements in Health & Safety in Operations

            Operations Improvement
               Efficiency increases in critical operations improved versus 2014
               Operations capacity enhancements in Balsa, Tooling, Aerospace

            Global Sourcing
               Benefits from a favourable sourcing environment

            Quality
               Product quality progress, marked reduction of issues in critical sites
               TQM project continuing in 2016

Slide 33                                                                          Corporate
Outlook 2016

            Net Sales
               Lower wind energy demand on a global level anticipated
               Low single-digit growth expected for 2016

            Operating Profitability
               Gurit strives to confirm the profitability target level of 8-10% in 2016

Slide 34                                                                            Corporate
Questions & Answers
You can also read