Private Residential Market - REAL ESTATE DATA TRENDS AND ANALYTICS Q2 2021 - Private Residential Market Report for Q2 2021
←
→
Page content transcription
If your browser does not render page correctly, please read the page content below
Private Residential Market
REAL ESTATE DATA TRENDS AND ANALYTICS Q2 2021
▪ The overall price index for
private residential
properties rose a fifth
consecutive quarter by 0.8
per cent in Q2 2021, albeit
at a slower pace than the
3.3 per cent growth in Q1.
▪ Sales of private homes
rose 4.3 per cent quarter-
on-quarter despite stricter
measures imposed during
the heightened alert period.
▪ Despite the heightened
last quarter alert period 811 new luxury
condominiums were sold
last quarter. This is the
highest quarterly sales
since Q4 2010
▪ Proportion of resale homes
in suburban areas continue
to rise, making up a higher
percentage of total sales in
OCR amid a supply crunch.
▪ Proportion of non-landed
homes bought by
foreigners rose to 4.1 per
cent. There were
significantly more buyers
from USA, United Kingdom,
Australia, France and
Korea.
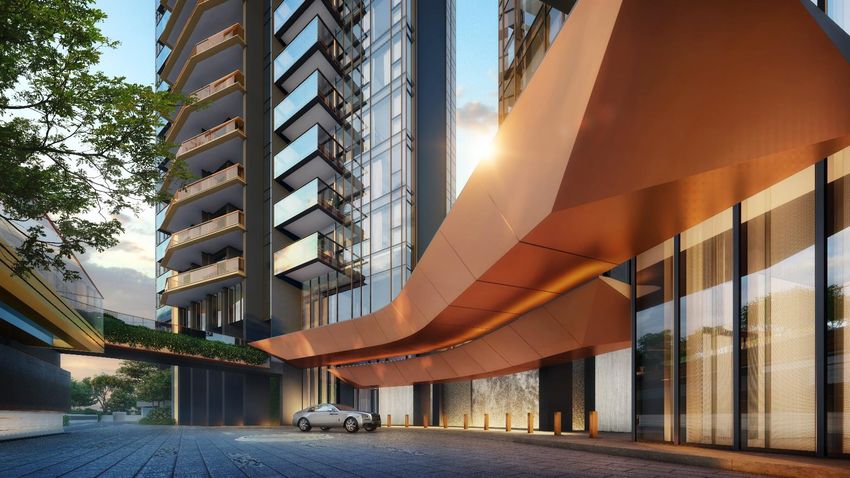
Artist Impression of Klimt Cairnhill
Page | 1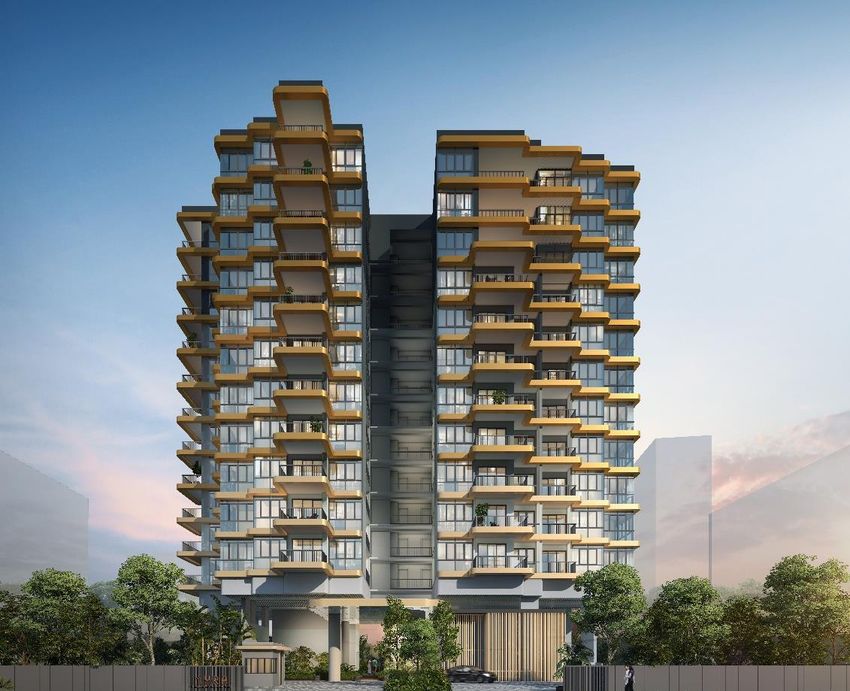
Prices rising at a slower pace amid heightened alert
                         Against the backdrop of a global march                              Chart 1 Market summary
                towards widespread vaccination and gradual
                transition towards normalcy, an economic
                recovery is now in insight. Global growth prospects
                have improved tremendously with the rapid
                vaccination rollouts and the inoculation efforts
                boosted the H2 2021 GDP projections for many
                countries.

                        A number of advanced economies are
                expected to see robust growth expansion and their
                GDP could reach their precrisis levels by 2023. For
                Singapore, our economic growth is estimated to
                exceed the upper end of the official 4 to 6 per cent
                forecast range this year according to a recent
                statement released by the central bank chief at the
                Monetary Authority of Singapore.
                                                                                             Table 1 Average price of non-landed homes
                        The overall price index for private
                residential properties increased by 0.8 per cent in
                Q2 2021, slower than the 3.3 per cent growth in the
                previous quarter, data from the Urban
                Redevelopment Authority (URA) showed (Charts 1
                & 2). This is the fifth consecutive quarterly
                increase. Year-on-year, prices rose 7.1 per cent. In
                comparison, the first quarter of this year saw the
                steepest quarterly price increment since Q2 2018.

                        The price increase in Q2 2021 was mainly
                driven by non-landed homes in the Outside of
                Central Region (OCR) which rose by 1.9 per cent
                quarter-on-quarter (q-o-q). Prices rose the fastest
                for the OCR where supply is leanest. In contrast,
                the price increment was less significant for the                              Source: URA, OrangeTee & Tie Research & Analytics

                Core Central Region (CCR) at 1.1 per cent and 0.1
                per cent in the Rest of Central Region (RCR).                                Chart 2 Prices rose the most in OCR

                       There have been drastic changes in many
                facets of the market. For instance, there is
                enormous demand for completed homes in the
                suburban regions as the supply of new mass-
                market homes have been anaemic. Fewer new
                homes were completed as a result of the
                construction delays and labour crunch.

                          As resale homes formed a higher
                proportion of transactions last quarter the overall
                price index was pulled down by the lower prices. In
                Q2 2021, 63.1 per cent (5,333 units) were resale
                homes, higher than the 55.8 per cent (4,519 units)
                in the first quarter of this year.
Terms of Use: The reproduction or distribution of this publication without the express consent of the author is prohibited. This publication is
provided for general information only and should not be treated as an invitation or recommendation to buy or sell any specific property or as     Page | 2
sales material. Users of this report should consider this publication as one of the many factors in making their investment decision and should
seek specific investment advice. OrangeTee.com Pte Ltd and the authors of this publication shall not accept and hereby disclaim all
responsibilities and liability to all persons and entities for consequences arising out of any use of this publication.
Copyright © OrangeTee & Tie Pte Ltd. All rights reserved.
Chart 3 Sales exceeded the pre-pandemic 2019
                                                                                                       Several factors have contributed to a
                                                                                             relatively slower market in Q2. Movement
                                                                                             restrictions were further tightened during
                                                                                             Singapore’s heightened alert period in May.
                                                                                             Stricter measures were imposed on property
                                                                                             sales galleries and house viewings in response
                                                                                             to a resurgence of virus infections, resuting in
                                                                                             fewer viewings and transactions.

                                                                                                      Moreover, there were fewer launches
                                                                                             last quarter due to Singapore’s heightened
                                                                                             alert period, when movements restrictions were
                                                                                             tightened in sales galleries. Less new homes
                                                                                             were sold and these properties are typically
                                                                                             sold at higher price tags when compared to
                                                                                             private homes in the secondary market.

                       Prices have been bolstered by a flood                                         Further, rising home values have
               of HDB upgraders entering the market, having                                  triggered a slight market slowdown. The
               sold their flats in recent months. Those who                                  pullback in demand was within expectation
               have sold their flats at higher prices will                                   since the overall URA price index has increased
               continue to upgrade to private homes. Local                                   for five consecutive quarters and there are
               and foreign investors will similarly purchase                                 fewer affordable new units launched in the
               homes for long-term rental income.                                            suburban areas.
                         Further, the proportion of bigger home
               transactions rose in Q2. Space has become a                                 Table 2 Best-selling condominiums in Q2 2021
               valued asset as many homeowners saw their
                                                                                                                                                      Median Unit Price
               daily lives suddenly confined to their properties.                           Project Name                            Units Sold           (SS$PSF)
               Many owners were looking for homes with                                                                          New Sale
               outdoor space and additional areas for solitude.                             IRWELL HILL RESIDENCES                             332         $2,630
               Last quarter, 39.2 per cent of private homes                                 TREASURE AT TAMPINES                               194         $1,406
               (landed and non-landed) were at least 1,200                                  NORMANTON PARK                                     190         $1,809
               sqft, higher than the 35.9 per cent in the                                   ONE-NORTH EDEN                                     155         $1,997
                                                                                            THE FLORENCE RESIDENCES                            112         $1,660
               previous quarter. Therefore, the bigger units
                                                                                            MIDWOOD                                            110         $1,646
               probably resulted in lower per square foot                                   AVENUE SOUTH RESIDENCE                              92         $2,216
               prices for some locations.                                                   SENGKANG GRAND RESIDENCES                           86         $1,693
                                                                                            HYLL ON HOLLAND                                     85         $2,389
                       According to the quarterly statistics
                                                                                            PARC CLEMATIS                                       81         $1,666
               released by the Urban Redevelopment Authority                                ONE BERNAM                                          81         $2,471
               (URA), 8,449 private homes excluding EC were                                 AMBER PARK                                          74         $2,469
               sold in Q2 2021, 4.3 per cent higher than the                                                                      Resale
               8,100 units transacted in the preceding quarter                              D'LEEDON                                           24          $1,660
               (Chart 3).                                                                   BARTLEY RIDGE                                      24          $1,452
                                                                                            REFLECTIONS AT KEPPEL BAY                          23          $1,583
                       Last quarter, new home sales dipped                                  THE PANORAMA                                       22          $1,495
               15.1 per cent from 3,493 units in Q1 2021 to                                 PARC ROSEWOOD                                      22          $1,130
               2,966 units last quarter. In contrast, the                                   8 SAINT THOMAS                                     22          $2,560
                                                                                            THE MINTON                                         21          $1,147
               number of resale transactions rose by 18 per
                                                                                            HIGH PARK RESIDENCES                               21          $1,232
               cent quarter-on-quarter (q-o-q) from 4,519 units
                                                                                            LA FIESTA                                          21          $1,264
               in Q1 2021 to 5,333 units in Q2 2021. This is the                            CARIBBEAN AT KEPPEL BAY                            21          $1,622
               highest quarterly resale volume since Q3 2009                               Source: URA, OrangeTee & Tie Research & Analytics
               (5,809 units).

Terms of Use: The reproduction or distribution of this publication without the express consent of the author is prohibited. This publication is
provided for general information only and should not be treated as an invitation or recommendation to buy or sell any specific property or as        Page | 3
sales material. Users of this report should consider this publication as one of the many factors in making their investment decision and should
seek specific investment advice. OrangeTee.com Pte Ltd and the authors of this publication shall not accept and hereby disclaim all
responsibilities and liability to all persons and entities for consequences arising out of any use of this publication.
Copyright © OrangeTee & Tie Pte Ltd. All rights reserved.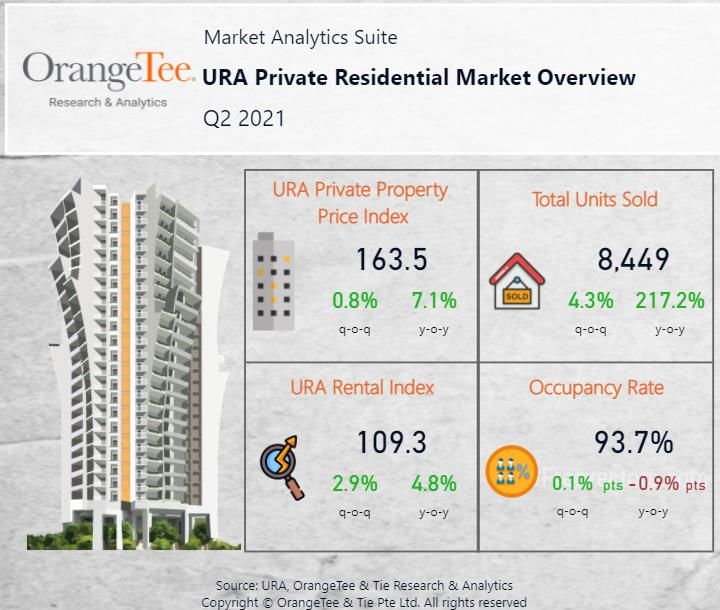
LUXURY SEGMENT                                                      Chart 4 Highest luxury sales since Q4 2010

               Last quarter, quarterly sales of luxury
               homes hit an 11 year high. According to
               URA Realis data, 1,795 luxury homes were
               sold last quarter (Chart 4). This is the
               highest quarterly sales recorded since Q4
               2010 (1,876 units).

                        Despite the heightened alert
               period 811 new luxury condominiums were
               sold last quarter. This is the highest
               quarterly sales since Q4 2010 when 855
               units were transacted. The stellar sales
               could be attributed to a few luxury projects
               being launched in the CCR last quarter,
               including Irwell Hill Residences, One
               Bernam and Park Nova. Moreover, some
               developers conducted sales promotions to
                                                                                    Chart 5 Prices dipped for both resale and new condos
               drive sales for selected units.

                        The best-selling luxury projects
               were Irwell Hill Residences (332 units), Hyll
               on Holland (85 units), One Bernam (81
               units), Leedon Green (54 units), Fourth
               Avenue Residences (46 units), D’Leedon
               (24 units), Pullman Residence Newton (22
               units), 8 Saint Thomas (22 units), Midtown
               Modern (22 units), Royalgreen (21 units)
               and The Avenir (21 units).

                        Last quarter, the overall average
               price of non-landed luxury homes in CCR
               dipped by 1.4 per cent from S$2,347 psf in
               Q1 2021 to S$2,314 psf in Q2 2021. The
               average price of new non-landed homes
               slipped marginally by 2.2 per cent from
               S$2,719 psf in Q1 2021 to S$2,660 psf in                               Chart 6 More luxury homes sold above S$10 million
               Q2 2021. Over the same period, the
               average price of resale non-landed homes
               declined 0.9 per cent from S$1,988 psf to
               S$1,971 psf (Chart 5).

                        For the super-luxury segment, 30
               condominiums were sold for at least S$10
               million in the Q2 2021 while another 21
               units were sold in Q1 of this year (excluding
               bulk purchase) (Chart 6). In H1 2021, 51
               units were transacted, the highest half-year
               sales since H2 2019 (52 units).

Terms of Use: The reproduction or distribution of this publication without the express consent of the author is prohibited. This publication is
provided for general information only and should not be treated as an invitation or recommendation to buy or sell any specific property or as     Page | 4
sales material. Users of this report should consider this publication as one of the many factors in making their investment decision and should
seek specific investment advice. OrangeTee.com Pte Ltd and the authors of this publication shall not accept and hereby disclaim all
responsibilities and liability to all persons and entities for consequences arising out of any use of this publication.
Copyright © OrangeTee & Tie Pte Ltd. All rights reserved.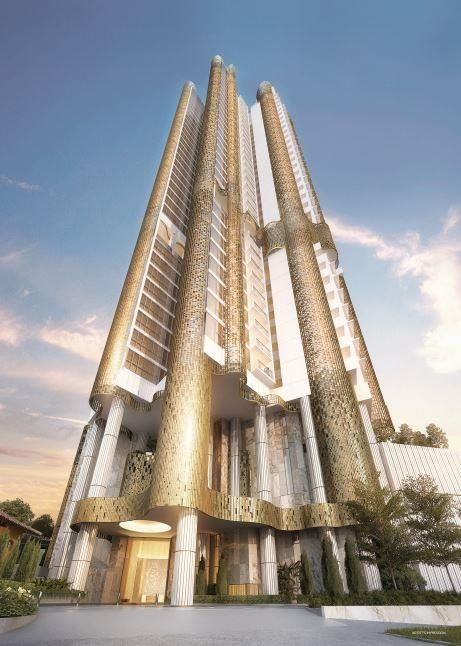
Chart 7 Sales slipped on back of heightened alert measures                                MID-TIER SEGMENT
                                                                                                       Demand for city fringe homes dipped last
                                                                                                       quarter on an absence of major launches and
                                                                                                       heightened alert restrictions. According to
                                                                                                       URA Realis data, 2,388 private homes
                                                                                                       (excluding EC) in RCR were sold, down 23.6
                                                                                                       per cent from the 3,127 units sold in Q1 2021
                                                                                                       (Chart 7).

                                                                                                              Last quarter more resale units were
                                                                                                       sold than new home sales. Resale homes
                                                                                                       made up 52 per cent (1,241 units) of the total
                                                                                                       private homes (excluding ECs) sold in the
                                                                                                       RCR.

                                                                                                                The best-selling projects were
             Chart 8 Prices of resale and new condominiums rose                                        Normanton Park (190 units), One-North Eden
                                                                                                       (155 units), Avenue South Residence (92
                                                                                                       units), Amber Park (74 units), The Antares (72
                                                                                                       units), Forett at Bukit Timah (54 units) and
                                                                                                       The Woodleigh Residences (53 units) (Charts
                                                                                                       9 and 10).

                                                                                                              The average price of new non-landed
                                                                                                       homes rose 2.8 per cent from S$1,986 psf in
                                                                                                       Q1 2021 to S$2,042 psf in Q2 2021 (Chart 8).
                                                                                                       The average price of resale homes similarly
                                                                                                       climbed 1.6 per cent from S$1,419 psf to
                                                                                                       S$1,442 psf over the same period.

            Chart 9 Best-selling projects in Q2 2021                                              Chart 10 Best-selling projects in Q2 2021 (S$psf)

Terms of Use: The reproduction or distribution of this publication without the express consent of the author is prohibited. This publication is
provided for general information only and should not be treated as an invitation or recommendation to buy or sell any specific property or as     Page | 5
sales material. Users of this report should consider this publication as one of the many factors in making their investment decision and should
seek specific investment advice. OrangeTee.com Pte Ltd and the authors of this publication shall not accept and hereby disclaim all
responsibilities and liability to all persons and entities for consequences arising out of any use of this publication.
Copyright © OrangeTee & Tie Pte Ltd. All rights reserved.
Chart 11 More mass-market homes were sold
              MASS MARKET SEGMENT
              Due to the lack of new launches and
              viewing restrictions, more mass-market
              private homes were sold (excluding EC)
              last quarter. According to URA Realis
              data, 3,596 private homes excluding EC
              were transacted last quarter, increasing
              by 5.2 per cent from 3,419 units in the
              preceding quarter (Chart 11).

                      The proportion of resale homes
              in the suburban area continue to form
              the bulk of purchases as supply of new
              homes      dwindle.   Resale      homes
              constitute 69.5 percent of total sales in
              OCR (2,500 units) in Q2 2021, as
                                                                                   Chart 12 Prices rose for both new and resale condominiums
              opposed to 28.6 per cent new sales
              (1,028 units).

                       Last quarter, the best-selling
              resale projects were The Paranoma (22
              units), Parc Rosewood (22 units), The
              Minton (21 units), La Fiesta (21 units),
              High Park Residences (21 units) and
              Ripple Bay (20 units).

                       Developers continue to pare
              down their launched units. The
              bestselling new projects were Treasure
              at Tampines (194 units), The Florence
              Residences (112 units), Midwood (110
              units), Sengkang Grand Residences (86
              units), Parc Clematis (81 units), Ki
              Residences at Brookvale (72 units), and                              Chart 13 Best-selling new projects in Q2 2021
              Affinity at Serangoon (58 units) (Chart
              13).

                      The average price of both non-
              landed mass-market new homes and
              resale homes rose last quarter. Prices
              of new non-landed homes increased by
              1.3 per cent from S$1,571 psf in Q1
              2021 to S$1,591 psf in Q2 2021 while
              the average price of resale homes rose
              by 2.2 per cent from S$1,100 psf to
              S$1,124 psf over the same period
              (Chart 12).

Terms of Use: The reproduction or distribution of this publication without the express consent of the author is prohibited. This publication is
provided for general information only and should not be treated as an invitation or recommendation to buy or sell any specific property or as     Page | 6
sales material. Users of this report should consider this publication as one of the many factors in making their investment decision and should
seek specific investment advice. OrangeTee.com Pte Ltd and the authors of this publication shall not accept and hereby disclaim all
responsibilities and liability to all persons and entities for consequences arising out of any use of this publication.
Copyright © OrangeTee & Tie Pte Ltd. All rights reserved.
“         Against the backdrop of a
             global march towards
        widespread vaccination and
         gradual transition towards
            normalcy, an economic
           recovery is now in sight.
                             ~ Christine Sun

                                                                                                                                                  Artist’s Impression of Myra

                                                                                                     “

                                                                                                                                       Artist’s Impression of Perfect Ten

Terms of Use: The reproduction or distribution of this publication without the express consent of the author is prohibited. This publication is
provided for general information only and should not be treated as an invitation or recommendation to buy or sell any specific property or as     Page | 7
sales material. Users of this report should consider this publication as one of the many factors in making their investment decision and should
seek specific investment advice. OrangeTee.com Pte Ltd and the authors of this publication shall not accept and hereby disclaim all
responsibilities and liability to all persons and entities for consequences arising out of any use of this publication.
Copyright © OrangeTee & Tie Pte Ltd. All rights reserved.
Chart 14 Rental volume dipped marginally

                                                                                                             RENTAL
                                                                                                                     The recent tightening of border
                                                                                                             controls and viewing restrictions during
                                                                                                             Singapore’s heightened alert period was
                                                                                                             a setback to a full rental market recovery.

                                                                                                                     According to URA data, rental
                                                                                                             volume excluding EC dipped marginally
                                                                                                             by 0.4 per cent q-o-q to 23,536 units in Q2
                                                                                                             2021 from 23,622 private homes in Q1
                                                                                                             2021 (Chart 14). Compared to a year ago,
                                                                                                             rental volume rose 17.5 per cent y-o-y
                                                                                                             from 20,030 units in Q2 2020.

                                                                                                                      Based on ground observations,
                   Chart 15 Rents rose by 2.9 per cent last quarter
                                                                                                             the market seems to be propped up by
                                                                                                             tenants renewing leases and new tenant
                                                                                                             groups entering the market. For instance,
                                                                                                             many HDB homeowners who have sold
                                                                                                             their   flats    recently     are    renting
                                                                                                             temporarily. They did not find a
                                                                                                             replacement home as they wish to
                                                                                                             offload their units quickly to capitalise on
                                                                                                             the fast-rising prices.

                                                                                                                     More landlords have sold their
                                                                                                             condominiums since private resale
                                                                                                             prices have been recovering. The
                                                                                                             affected tenants have to search for new
                                                                                                             accommodation including those units
                                                                                                             that were sold with tenancy.

                   Chart 16 Overall occupancy rate rose to 93.7 per cent                                             As the available stock continues
                                                                                                             to be limited and the new supply of
                                                                                                             homes      is   being      hampered     by
                                                                                                             construction delays, the supply crunch
                                                                                                             resulted in higher rents in recent months.
                                                                                                             According to URA data, rents rose by 2.9
                                                                                                             per cent last quarter, a steeper rise than
                                                                                                             the 2.2 per cent increase in the previous
                                                                                                             quarter (Chart 15). Occupancy remained
                                                                                                             healthy at 93.7 per cent (Chart 16).

                                                                                                                     If the Covid situation continues
                                                                                                             to improve in Singapore and borders
                                                                                                             gradually reopen, the rental market may
                                                                                                             pick up again in the coming months.

Terms of Use: The reproduction or distribution of this publication without the express consent of the author is prohibited. This publication is
provided for general information only and should not be treated as an invitation or recommendation to buy or sell any specific property or as     Page | 8
sales material. Users of this report should consider this publication as one of the many factors in making their investment decision and should
seek specific investment advice. OrangeTee.com Pte Ltd and the authors of this publication shall not accept and hereby disclaim all
responsibilities and liability to all persons and entities for consequences arising out of any use of this publication.
Copyright © OrangeTee & Tie Pte Ltd. All rights reserved.
NATIONALITY                                                           Chart 17 Higher proportion of homes bought by non-PRs

               The proportion of non-landed homes
               bought by foreigners (excluding ECs) rose
               further last quarter, although the absolute
               number has dipped when compared to the
               preceding quarter (Chart 18). The
               proportion of non-landed home purchases
               by non-permanent residents (NPR) rose to
               4.1 per cent (284 units), from 4 per cent
               (292 units) in Q1 2021 and 3.3 per cent
               (198 units) in Q4 2020.

                        In contrast, the percentage of non-
               landed homes bought by PRs held steady
               at 16.7 per cent (1,145 units) in Q2 2021
               (Chart 17). The proportion of Singaporean                              Chart 18 Non-PR and PR purchases slipped slightly
               purchases fell to 78.8 per cent last quarter
               from 79.1 per cent in the preceding
               quarter.

                       Mainland Chinese (Non-PRs and
               PRs) remained as the top foreign buyer.
               They purchased 320 non-landed homes
               in Q2 2021, followed by buyers from
               Malaysia (230 units), India (162 units)
               and Indonesia (82 units) (Chart 19). All
               these numbers are expected to be higher
               as 314 units are still pending
               reclassification when caveats are being
               lodged and are currently stated as
               Foreign Unspecified.

                        There were significantly more                               Chart 19 Mainland Chinese are the top foreign buyers in Q2 2021
               buyers from USA who bought 67 units
               last quarter, higher than the past two year
               quarterly average of 44 units recorded
               between Q2 2019 to Q1 2021. Similarly,
               there were more homes bought by buyers
               from United Kingdom (42 units in Q2
               2021, above 2-year average of 19 units),
               Australia (35 units, average 15 units),
               France (20 units, average 9 units) and
               Korea (20 units, average 15 units). The
               sales increase could be in tandem with a
               broad-based economic recovery for
               some of these countries or strengthening
               of foreign currencies, which led to more
               foreigners purchasing homes here.

Terms of Use: The reproduction or distribution of this publication without the express consent of the author is prohibited. This publication is
provided for general information only and should not be treated as an invitation or recommendation to buy or sell any specific property or as     Page | 9
sales material. Users of this report should consider this publication as one of the many factors in making their investment decision and should
seek specific investment advice. OrangeTee.com Pte Ltd and the authors of this publication shall not accept and hereby disclaim all
responsibilities and liability to all persons and entities for consequences arising out of any use of this publication.
Copyright © OrangeTee & Tie Pte Ltd. All rights reserved.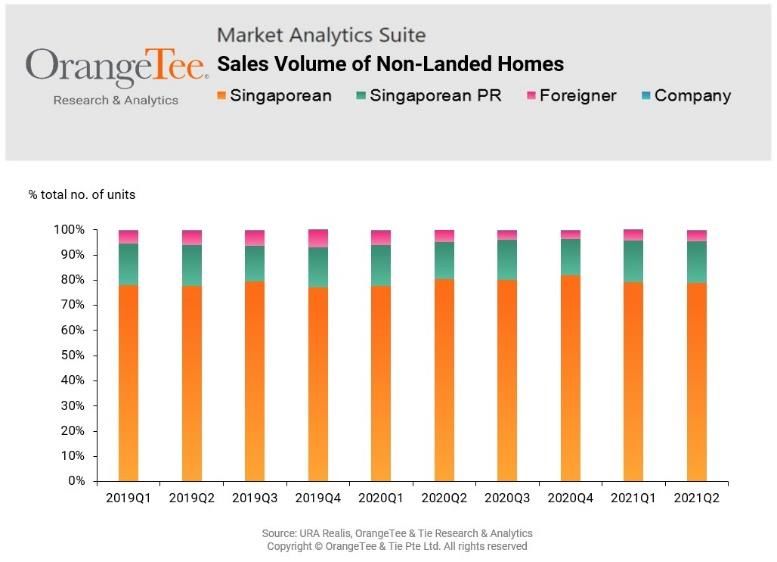
OUTLOOK
                                                                                                    Q2 2021          H1 2021           Projection for
           Indicators                                          2018      2019           2020
                                                                                                    (Q-o-Q)                                 2021
           Overall
           URA PPI Price Change                                 7.9%     2.7%           2.2%          0.8%             4.1%               6% to 9%
           Sales Volume (excl.EC) (units)                      22,139   19,150         20,909         8,449           16,549          27,000 to 29,000
           New Sale (excl. EC)
           Price Change                                        10.8%     7.6%          0.7%           2.0%            10.4%             11% to 14%
           Sales Volume (units)                                8,795     9,912         9,982          2,966           6,459           10,000 to 11,000
           Resale (excl. EC)
           Price Change                                         2.7%     3.6%           -3.8%         1.6%             6.6%              8% to 11%
           Sales volume (units)                                13,009    8,949         10,729         5,333            9,852          17,000 to 18,000
           Rental (excl. EC)
           URA Rental Index                                     0.6%     1.4%           -0.6%         2.9%             5.2%               5% to 8%
           Leasing volume (units)                              89,904   93,960         92,537        23,536           47,158          85,000 to 95,000
           Source: URA, OrangeTee & Tie Research & Analytics

                          The property market is currently propelled                               According to the central bank chief of
             by strong upgrader demand, a recovering economy                               The Monetary Authority of Singapore, it
             and low mortgage rates. There was strong job                                  appears that the probability of property curbs
           Source: Data.gov.sg, HDB, OrangeTee & Tie Research & Consultancy
             creation
           Copyright        in the
                     © OrangeTee  & Tiefirst
                                        Pte Ltd.half    ofreserved.
                                                 All rights this year and the hiring       being implemented in the near future may not
             prospects are expected to brighten further.                                   be high since they do not deem the market to
                                                                                           be overheated.
                      The housing market may experience
                                                                                                The information may help to reassure
              countervailing forces of a higher push from a global
                                                                                           buyers and stabilise the market as there is now
              economic recovery, but a pull back of rising
                                                                                           more clarity. Earlier speculations of new
              mortgage rates. Mortgage rates have been creeping
                                                                                           cooling measures resulted in some panic
              up gradually after hitting record lows last year. Most
                                                                                           buying and nudged on-the-fence buyers to take
              economists are expecting rates to inch higher which
                                                                                           action before new buying criteria or borrowing
              may augur a slight demand slowdown from 2022.
                                                                                           limits are changed.
                       However, many longer-term trends are at                                      Barring unforeseen circumstances, the
              play which may sustain the property market even                              overall home prices may rise by 6 to 9 per cent
              after the pandemic-driven boom fades. Singapore,                             for the whole of 2021. Buyers looking for
              as a magnet to the super-rich and foreign investors,                         affordable homes may continue to turn to the
              will continue to pull in strong investments year after                       resale market in the suburban regions or
              year. As most mass-market projects have been                                 selected city fringe areas. Therefore, this year’s
              launched, the supply of new mass-market homes                                resale volume is estimated to hit 17,000 to
              will remain limited. The scarcity of suburban homes                          18,000 units, which will surpass the total resale
              may keep resale properties attractive.                                       volume in 2019 and 2020.

                  Please contact us for research inquiries

Terms of Use: The reproduction or distribution of this publication without the express consent of the author is prohibited. This publication is
provided for general information only and should not be treated as an invitation or recommendation to buy or sell any specific property or as     Page | 10
sales material. Users of this report should consider this publication as one of the many factors in making their investment decision and should
seek specific investment advice. OrangeTee.com Pte Ltd and the authors of this publication shall not accept and hereby disclaim all
responsibilities and liability to all persons and entities for consequences arising out of any use of this publication.
Copyright © OrangeTee & Tie Pte Ltd. All rights reserved.
You can also read


