Federal Reserve Policy - Gary R. Evans
←
→
Page content transcription
If your browser does not render page correctly, please read the page content below
Federal Reserve Policy
                                                        Part 1
             Money, credit, and its creation

     .. introduction to the Federal
   Reserve System ... and money!

© 2020 Gary R. Evans. This slide set by Gary R. Evans
is licensed under a Creative Commons Attribution-
NonCommercial-ShareAlike 4.0 International License.
The objective of this multi-part video lecture series

•   Structure and Mandate of the Federal Reserve System
•   Money, Credit and Velocity (and the connection)
•   Open Market Operations [OMOs] (simple)
•   Open Market Operations [OMOs] (advanced - 2020)
•   OMOs and interest rates and interest rate targets
•   Details and complications of 2007 - 2019 FRS policy.
•   Current FRS policy (2020)
•   The long-term dangers of short-term policy

The Federal Reserve System (FRS)
•   The Federal Reserve System is our nation’s central banking authority.
•   All nations have an equivalent (see http://www.bis.org/cbanks.htm)
    and the European Union has European Central Bank.
•   The present Chair of the FRS is Jerome H. Powell, who replaced Janet
    Yellen, who replaced Ben S. Bernanke, who replaced Alan
    Greenspan.
•   Primary policy decisions are determined by the Board of Governors
    in Washington, DC.
•   The operational branch of the FRS, responsible for controlling the
    money supply and influencing interest rates, is the Federal Open
    Market Committee (FOMC), located at the Federal Reserve Bank of
    New York, one of 12 district banks. They conduct open market
    operations.
•   The FRS has the multiple and sometimes conflicting mandate
    (explained in a couple of slides)
Jerome Powell, February 2018, 16th chair

       FRS organizational chart
                    Board of Governors
                     (Washington DC)

                                            Federal Open Market
12 District Banks                          Committee (FOMC - NY)

                                               FRBNY System
                                              Account Supervisor

                                            Open Market Trading
                                                  Desk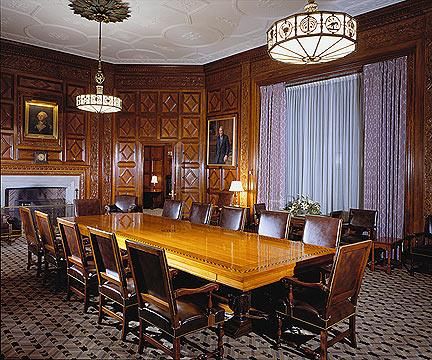
The FRS Mandate
from their 1913 charter
• Promote bank and financial institution stability
• Promote price stability (anti-inflation)
• Promote interest rate stability (and low interest
rates)
• Promote international financial stability (and
stable exchange rates)
• Promote full employment
.. save the economy
.. save the stock market
… sometime mutually exclusive!!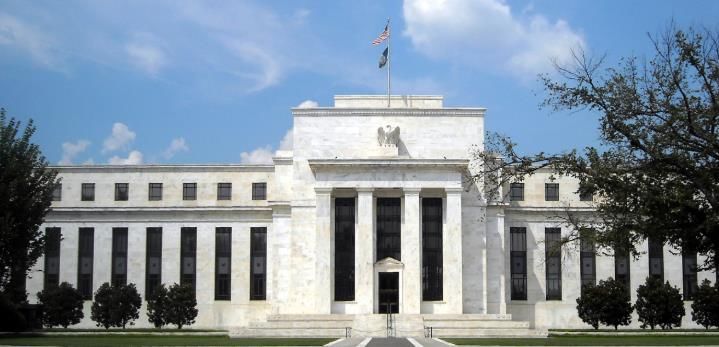
The FRS toolkit

1. Discount Window lending
  •   Used mostly for emergencies now
2. Changing the Reserve Requirement
  •   Seldom done
3. OPEN MARKET OPERATIONS
  •   Done many times per week throughout year.

What is money???
Money doesn’t exist, really .....                                Uncomfortably
                                                                            (comfortably?)
Economics ... is an information science,                                    close to Bitcoin?
now that money itself is completing a
development arc from matter to bits,
stored to computer memory and magnetic
strips, world finance coursing through the
global nervous system. Even when money
seems to be material treasure, heavy in
pockets and ships holds and bank vaults, it
always was information. Coins and notes,      The Brain (from Pinky
                                              and the Brain) knows that
shekels and cowries were all just short-      the ruler of the world will
lived technologies for tokenizing             control his empire from a
information about who owns what.              smartphone (running an
                                              algo).

James Gleick, The Information.
The textbook definition of "money"

   Any financial asset that can be used as
   1. a stable medium of exchange
   2. a store of value
   3. a means to settle debt (through payment)

"Legal tender" refers to circulating money that can be used to pay
obligations to the government. In U.S. law, coins are not included.

Most money today is in the form of bookkeeping transactions.
The official money supply, FRS definitions

• M1: Sum of currency
  (Federal Reserve Notes),
  checking deposits, travelers
  checks, and other checkable
  deposits (OCDs)

• M2: M1 plus retail
  MMMF balances, savings
  deposits (including
  MMDAs), and small time
  deposits

Source: Federal Reserve Money
Stock and Debt Measures - H.6     ..about $4.02T
release, April 9, 2020.
                                                   ..about $15.5T
                                 (6.8% growth!)    (7.4% growth)
Money Stock Measures, 1/1998 – 2/2020
M2 (monthly, $ billions, SA)
M1
18,000 4,500
16,000 4,000
M1: Sum of currency,
14,000 demand deposits, travelers 3,500
checks, and other checkable
12,000 deposits (OCDs) 3,000
10,000 2,500
8,000 2,000
6,000 1,500
M2: M1 plus retail MMMF
4,000 1,000
balances, savings deposits
(including MMDAs), and
2,000 500
small time deposits
0 0
2011-01
1998-01
1999-01
2000-01
2001-01
2002-01
2003-01
2004-01
2005-01
2006-01
2007-01
2008-01
2009-01
2010-01
2012-01
2013-01
2014-01
2015-01
2016-01
2017-01
2018-01
2019-01
2020-01
M2 M1
Source: Federal Reserve Statistical Release H.6 Money Stock MeasuresMoney Supply Growth Rates
Jan 1999 – Feb 2020, monthly, annualized previous 12 months, LN continuous, SA
0.25
% Spec expansion Bad recession Spec expansion Bad recession Tepid growth
0.20
Did we have inflation here?
0.15
Or here?
0.10
0.05
0.00
No meaningful correlation to inflation is visible here – this is more the effect
-0.05
of things (like recessions) that matter than the cause of anything. Likewise,
these current numbers have no capacity to predict inflation.
-0.10
1999-01 2001-01 2003-01 2005-01 2007-01 2009-01 2011-01 2013-01 2015-01 2017-01 2019-01
M1 M2 12 per. Mov. Avg. (M1) 12 per. Mov. Avg. (M2)
Source: Federal Reserve Statistical Release H.6 Money Stock MeasuresMoney Velocity
(The equation of exchange)
MV = PY or V = GDP/M
(Money, Velocity, Price Level, Y= real GDP)
This antiquated (from the classics) but useful concept viewed money
as circulating through the economy at a rate of “velocity,” which once
determined, would determine the level of GDP, or the price level
times real national output. Classical monetary theorists argued that if
velocity was stable, then to control the rate of nominal economic
growth the monetary authorities needed only to control the rate of
growth of the “money supply.”
But for monetary growth (however money is defined) to be an
effective policy instrument to either stimulate the economy or cool
inflation, velocity has to be a constant, or if trending, stable and
predictable.V1
Velocity: relatively unstable and trending V2
12 2.4
Calculated as the ratio of
annualized quarterly GDP
11 divided by M1 and M2 SA
2.2
for each quarter, 2000Q1 to
10 2019Q4.
2.0
9
1.8
8
1.6
7
1.4
M1 is too 6 volatile and trending to be of much use in policy. M2 is
also unstable and trending down, a confirmation that traditional
money doesn’t matter so much anymore. Also, this is as much effect 1.2
5
as it is cause (the state of the economy affects how people hold their
assets, including monetary assets).
4 1.0
2000 2001 2002 2003 2004 2005 2006 2007 2008 2009 2010 2011 2012 2013 2014 2015 2016 2017 2018 2019
M1 Velocity M2 VelocityThe connection between money,
credit, and debt
It has become increasingly apparent in recent years that efforts to control the
"money supply" are less and less effective for at least three reasons: (1) it is
very hard to define what constitutes money, (2) consumers and businesses rely
less and less on their monetary holdings to finance their spending and in fact
are reducing their monetary holdings in exchange for non-monetary financial
assets and because they can use credit, and related to this, (3) the statistical
correlation between money and spending, or deltas in money and spending,
has largely vanished.
Increasingly credit and debt are seen as more strongly correlated with
consumer and business spending.
Credit is borrowed money. Credit is a flow variable and debt is the stock
variable the results from credit accumulating over time. Mathematically, the
net delta (change) in debt is equal to credit extended over any time period,
such as one month. Debt is the balance, credit is the addition to the balance.Domestic Non-financial Debt / National Income
1962-2019
3.5
This is the total net indebtedness of all parties
in the U.S. economy (non-financial eliminates
3.0 double counting) divided by National Income.
This is a national proxy for our debt divided
by our capacity to pay it.
Millennium
2.5
craziness
The 80s
2.0
discover
credit
1.5
Stability
1.0
1963 1967 1971 1975 1979 1983 1987 1991 1995 1999 2003 2007 2011 2015
Source (debt): Federal Reserve Flow of Funds Accounts, Z1 statistical releaseMemo: Whom owes what?? (2020 Q4)
$T Total: $54.347 Trillion
20 19.1 I want this!!
18
16
14 Home Mortgage Debt
10.6 Consumer Credit
12 10.1 Corporate Debt 2020 Koenigsegg Gemera Electric Hybrid
Noncorporate Business
10 State and Local Government
Federal Government
8 5.9
6 4.2
3.1
4
2
0
Source: Federal Reserve Flow of Funds Accounts, Z1 statistical release, Mar 2020Indirect controls
Economic Goals
Intermediate (Target)
Variables
Control Variables
???Candidate Variables
• Goal
– Price targets This channel is called the
"transmission mechanism."
– Real GDP growth
Note the multiple target variables.
– Unemployment
With goals, the real objective is to
• Target prevent or mitigate abnormalities or
excesses, like high inflation,
– Moneys (M1, M2)
recession, or high interest rates.
– Credit/Debt Measures
An enduring question for the FRS:
– Interest rates (FFR) How strong and reliable are these
connections?
• Control
– Bank reserves
– Monetary baseThat’s it ... © 2020 Gary R. Evans. This video and slide set by Gary R. Evans is licensed under a Creative Commons Attribution-NonCommercial-ShareAlike 4.0 International License.
Federal Reserve Policy
                             Part 2
Open Market Operations (simple)
                                                        A boardroom at the Federal
                                                        Reserve Bank of New York,
                                                        where Open Market Operations
                                                        are conducted. This photograph
                                                        is by Oleg March.

© 2020 Gary R. Evans. This slide set by Gary R. Evans
is licensed under a Creative Commons Attribution-
NonCommercial-ShareAlike 4.0 International License.
The objective of this lecture is to explain ... • ... how Open Market Operations are conducted (simple version). • ... the effect of a successful OMO. • ... the connection between OMOs and money supply / credit growth rates. Later lectures will explain: • ... adding mortgages, REPOs, and other complications. • ... temporary OMOs (with REPOs), why they are necessary. • ... the impact of OMOs upon interest rates. • ... the role played by primary dealers • ... the changes forced by the 2008-2009 recession • ... the changes forced by the pandemic of 2020
Some useful background facts ...
• The FRS is supposed to be autonomous from the Congress
  and the President (FRS is self-funded)
• Monetary policy, including OMO policy, is determined by
  the Federal Reserve System Board of Governors (BOG) in
  Washington DC.
• Actual Open Market Operations are conducted by the
  Open Market Trading Desk of the Federal Reserve Bank      This is what the Federal Reserve Bank of New York looks like ...

  of New York
• There are two types of OMOs, temporary (seasonal),
  which are used largely to help seasonal U.S. Treasury
  operations (and which use Repurchase Agreements, or
  REPOs), and permanent, which have a lasting effect.
  Here we are describing permanent.
What is meant by "Open Market"?
Typically two or three times per week throughout the year, the
Trading Desk of the FRB New York indirectly* enters the market
for U.S. Treasury Securities by making a bid, in competition with
other buyers, for a given amount of some security, such as a 13-
week U.S. Treasury Bill for $10 million. At this point, the FRS is
just another player in that market.
They will buy (directly and indirectly*) from any trader making an
offer (ask) or accepting their bid, including but not restricted to, a
private bank. In the example that follows, we will assume that
they buy from a private bank, but that is not necessary for the open
market operation to have its desired effect.

 *this   has to be substantially qualified, which happen in a later video.
How Open Market Operations create money and credit

1.     FRBNY buys U.S. Treasury Securities in the open market
2.     … and pays for them with reserves*
3.     … which allows banks on net to increase their lending,
       which creates credit** (debt)
4.     … which creates new checkable deposits
5.     … and new checkable deposits are, by definition, money*
       (included in all definitions)

*...
  we can’t explain what reserves are quite yet, but these are not
what people call required Tier1 or Tier2 reserves!
Key take-aways that you should understand ...
1. The FRS historical mandate
• ... especially the two which are at times mutually exclusive
• ... which you don’t yet understand but eventually will
2. The “indirect controls” of the transmission mechanism Video 1
• ... and the connection between the control, target, and goal variables.
3. Why “money” is no longer regarded as an important “target variable”
• What evidence is there?
• What is velocity and what role does it play?
4. The general importance of Open Market Operations in the FRS toolkit
• ... which you don’t yet understand but eventually will
5. Where the major decisions are made (BOG) but where critical operations and policy
execution decisions are made (generally, FRBNY but specifically Federal Open
Market Committee (FOMC).
6. The distinction between temporary (seasonal) OMOs and permanent
• ... which you don’t yet understand but eventually will
• ... and involve REPOs.That’s it ... © 2020 Gary R. Evans. This video and slide set by Gary R. Evans is licensed under a Creative Commons Attribution-NonCommercial-ShareAlike 4.0 International License.
Part 3
 Doing an Open Market Operation
© 2020 Gary R. Evans. This slide set by Gary R. Evans
is licensed under a Creative Commons Attribution-
NonCommercial-ShareAlike 4.0 International License.
Let’s start with the Babylonian method ...

                    Financial Entity
A                                                     L&E

         ASSETS                        LIABILITIES

                                             EQUITY
Liabilities (Debt) &
Assets Sarah Equity (Net Worth)
$3,000 cash $180,000 home loan
$37,000 401-K $4,000 car loan
$260,000 home $12,000 student loan
$12,000 car $1,000 credit card debt
$2,000 misc. Equity
$117,000 net worth!Bank of Claremont
A L&E
$500 checkable
$50 vault cash deposits
$100 reserves ??? $300 time deposits
$200 certificates of
$350 govt bills deposit
$1,000 loans $200 federal funds ???
$300 equityAll private banks ($billions)
A L&E
$100 Checkable
$10 Reserves deposits
$80 Loans $10 Equity
$20 Govt Bills (checkable deposits
are money)Federal Reserve System
A L&E
$30 Govt Bills $10 Reserves
$20 Equity
Go to the current federal reserve H41 statistics release to
show how this is not much of a simplification:
http://www.federalreserve.gov/releases/h41/current/h41.htmThe starting point ...
Federal Reserve System All private banks ($billions)
A L&E A L&E
$100 Checkable
$30 Govt Bills $10 Reserves $10 Reserves deposits
$20 Equity $80 Loans $10 Equity
$20 Govt Bills (checkable deposits
are money)
one and the sameHow money is created
PBS
A L&E
+ 50 Checkable
+ 50 Loans DepositsThe Reserve Requirement
… it's the law!!
All federally insured financial institutions are
required to keep an amount equal to a specified
percentage of their deposit liabilities at a Federal
Reserve District Bank (or equivalent) in the
form of reserves.
(Vault cash counts as reserves).
This is called the Reserve Requirement.Example …
Reserve requirement = 10%
Reserves are technically
If Deposit Liabilities = 200, then “deposits” that these banks
have at the Federal Reserve
district banks ...
Required Reserves = 200 X .10 = 20
(actual effective early 2015)The starting point …..
Federal Reserve System All private banks ($billions)
A L&E A L&E
$30 Govt Bills $10 Reserves $100 Checkable
$10 Reserves deposits
$20 Equity
$80 Loans $10 Equity
$20 Govt Bills (checkable deposits
are money)
Question: Can this banking system presently undertake any net
new lending, given the reserve requirement?The Open Market Operation (OMO)
… what you are about to see
The Federal Reserve System will
purchase $5 in government bills from the
banking system (PBS) and will pay for
them with reserves. This is done at the
Federal Reserve Bank of New York.
This will give the PBS Free Reserves.... and note that
The open market operation ….. we have created
excess reserves!
Federal Reserve System All private banks ($billions)
A L&E A L&E
$30 Govt Bills $10 Reserves $100 Checkable
35 15 $10 Reserves deposits
$20 Equity 15
$80 Loans $10 Equity
$20 Govt Bills (checkable deposits
15 are money)
The FRS buys $5 in Bills and pays
for them with $5 in reserves.All private banks ($billions)
A L&E
$10 Reserves $100 Ch. Deposits
$15 $150
... and now the banks, with
$80 Loans $10 Equity free reserves, can lend.
$130
$20 Govt Bills $50 in new money
$15 has been created.
$50 in new money and $50 new credit has been createdThe Money/Credit Multiplier
Money Supply k Reserves
and
Debt Credit k Reserves
where
k 1 Reserve Requirement
example:
k 1010
. 10
when the reserve
requirement is 10%The open market operation …..
Federal Reserve System All private banks ($billions)
A L&E A L&E
$30 Govt Bills $10 Reserves $100 Checkable
35 15 $10 Reserves deposits
$20 Equity 15
$80 Loans $10 Equity
$20 Govt Bills (checkable deposits
15 are money)
The FRS buys $5 in Bills and pays
for them with $5 in reserves.All private banks ($billions)
A L&E
$10 Reserves $100 Ch. Deposits
$15 $150
... and now the banks, with
$80 Loans $10 Equity free reserves, can lend.
$130
$20 Govt Bills $50 in new money
$15 has been created.
$50 in new money and $50 new credit has been createdKey take-aways that you should understand ...
1. The key to following the logic is the T-account and its arrangement.
2. Reserves are account deposits at a Federal Reserve district bank
3. Bank loans, reserves and securities (T-securities) are assets.
4. Bank deposit accounts, although an asset for you, is a bank liability.
5. When there are no free reserves, the system as a whole can’t lend on net!
6. All reserves are created from nothing by the FRS through OMOs.
7. After the OMO, free reserves allow banks to extend their lending on net.
8. The resulting lending activity results in a net new increase of both money and
credit.
9. ... Note! I always have a fill-in question about OMOs on the exam!That’s it ... © 2020 Gary R. Evans. This video and slide set by Gary R. Evans is licensed under a Creative Commons Attribution-NonCommercial-ShareAlike 4.0 International License.
You can also read


