Exhibit 99.1 April 2015 Investor Presentation - CFO Jon Faulkner The Dixie Group Phone: 706-876-5814 - SEC.gov
←
→
Page content transcription
If your browser does not render page correctly, please read the page content below
Exhibit 99.1

      April 2015
       Investor
     Presentation

       Contact:
     Jon Faulkner
         CFO
    The Dixie Group

  Phone: 706-876-5814

jon.faulkner@dixiegroup.com
Forward Looking Statements
The Dixie Group, Inc.
• Statements in this presentation which relate to the future, are subject to risk
  factors and uncertainties that could cause actual results to differ materially
  from those indicated in such forward-looking statements. Such factors include
  the levels of demand for the products produced by the Company. Other
  factors that could affect the Company’s results include, but are not limited to,
  raw material and transportation costs related to petroleum prices, the cost
  and availability of capital, and general economic and competitive conditions
  related to the Company’s business. Issues related to the availability and price
  of energy may adversely affect the Company’s operations. Additional
  information regarding these and other factors and uncertainties may be found
  in the Company’s filings with the Securities and Exchange Commission.
• General information set forth in this presentation concerning market
  conditions, sales data and trends in the U.S. carpet and rug markets are
  derived from various public and, in some cases, non-public sources. Although
  we believe such data and information to be accurate, we have not attempted
  to independently verify such information.
                                                                               2
Dixie History

•   1920     Began as Dixie Mercerizing in Chattanooga, TN
•   1990’s   Transitioned from textiles to floorcovering
•   2003     Refined focus on upper- end floorcovering market
•   2003     Launched Dixie Home - upper end residential line
•   2005     Launched modular tile carpet line – new product category
•   2007     Launched wool products in Masland & Fabrica – high-end designers
•   2010     Residential “soft products” growth strategy
•   2012     New Masland Contract management – performance tile strategy
•   2012     Purchased Colormaster dye house – lower cost
•   2012     Purchased Crown rugs – wool rugs
•   2013     Purchased Robertex - wool carpet mill
•   2014     Expanded and realigned manufacturing to increase capacity
•   2014     Purchased Atlas Carpet Mills – high-end commercial business
•   2014     Purchased Burtco - computerized yarn placement for hospitality 3
Dixie Today

              • Commitment to brands in the upper-
                end market with strong growth
                potential

              • Diversified between Commercial and
                Residential markets

              • Diversified customer base
                                        (TTM Basis, excludes Atlas)

                 – Top 10 carpet customers
                    • 13% of sales
                 – Top 100 carpet customers
                    • 26% of sales

                                                               4
Dixie Group Drivers
What affects our business?

 The market dynamics:
 • Residentially
    • The market is driven by home sales and remodeling
       • New construction is a smaller effect
    • Dixie is driven by the wealth effect
       • The stock market and consumer confidence
 • Commercially
    • The market is driven by remodeling of offices,
      schools, retail and hospitality as demonstrated by
      the investment in non-residential fixed structures
    • Dixie is driven by upper-end remodeling in offices,
      retail remodeling, higher education, and upper-end
      hospitality that primarily involves a designer
                                                            5
New and Existing Home Sales
  Seasonally Adjusted Annual Rate
                                                                                •     “Insufficient supply appears
    New 1,000                                                  Existing 1,000         to be hampering prospective
   600                                                                  5,500         buyers in several areas of
                                                                                      the country and is hiking
                                                                                      prices to near unsuitable
   550
                                                                                      levels.
                                                                        5,000   •     “Stronger price growth is a
                                                                                      boon for homeowners
   500                                                                                looking to build additional
                                                                                      equity, but it continues to be
                                                                        4,500         an obstacle for current
   450                                                                                buyers looking to close
                                                                                      before rates rise.
   400                                                                          •     “With all indications pointing
                                                                        4,000
                                                                                      to a rate increase from the
                                                                                      Federal Reserve this year –
   350                                                                                perhaps as early as this
                                                                                      summer – affordability
                                                                        3,500         concerns could heighten as
   300                                                                                home prices and rents both
                                                                                      continue to exceed wages
                                                                                Lawrence Yun,
   250                                                                  3,000
     Jan '10     Jan '11     Jan '12     Jan '13     Jan '14
                                                                                Chief Economist
                                                                                National Association of Realtors
                                                                                March 23, 2015               6
Source: National Association of Realtors (existing) and census.gov/const/c25 (new).
Residential and Commercial
Fixed Investment

                             Rebound in
                             residential
                               activity

                             Rebound in
                             commercial
                               activity

                              We expect
                                2015 to
                             continue the
                                trend of
                               continuing
                             the rebound
                                of fixed
                              investment
                             as a percent
                                of GDP
                                     7
The Industry as
  compared to The Dixie Group

Source: U.S. Bureau of Economic Analysis and Company estimates
                                                                 8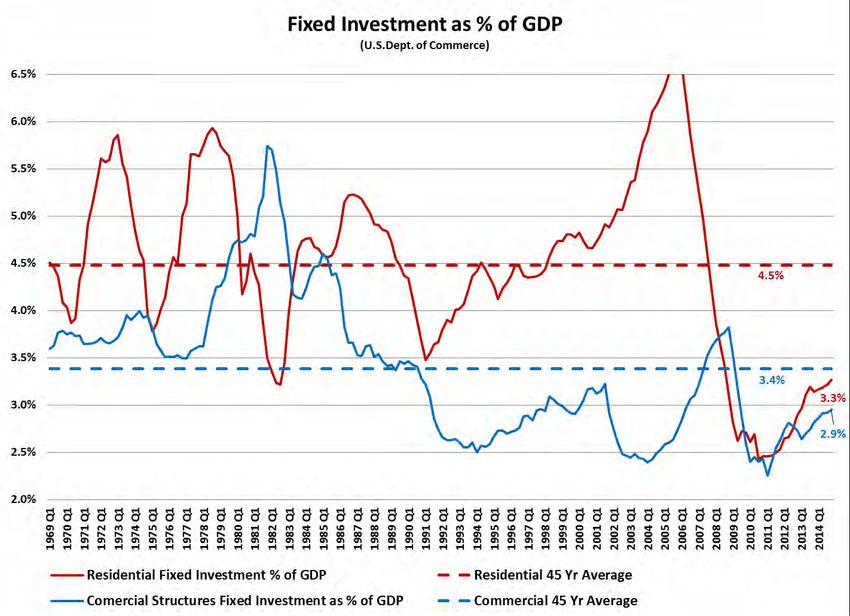
2013 U.S. Carpet & Rug
   Manufacturers

                                                   Dollars in
           Carpet Leaders                          Millions         % Total
Shaw (Berkshire Hathaway)                      $         3,110         27.7%          Residential & Commercial
Mohawk (MHK)                                   $         2,521         22.4%          Residential & Commercial
Beaulieu (Private)                             $           625          5.6%          Residential & Commercial
Interface (TILE)                               $           459          4.1%              Commercial Only
Engineered Floors (Private)                    $           385          3.4%              Residential Only
Dixie (DXYN)                                   $           342          3.0%          Residential & Commercial
Other                                          $         3,806         33.8%          Residential & Commercial
Market                                         $       11,248        100.0%

 Source: Floor Focus – includes carpet as broadloom and modular tile, and rug sales                          9
Dixie versus the Industry

           TTM Q1 2015 Dixie sales                                  U.S. 2014 Carpet Market of $8.7
                                                                                  billion

Source: Floor Focus – Broadloom & Carpet Tile and Dixie Group estimate                            10
Carpet Dollar Sales
Indexed to 2009 (includes Atlas Carpet Mills from date of acquisition)
11Carpet Unit Sales
Indexed to 2009 (includes Atlas Carpet Mills from date of acquisition)
12Industry Positioning
The Dixie Group
• Strategically, our residential and
commercial businesses are driven by
our relationship to the upper-end
consumer and the design community
• This leads us to:
– Have a sales force that is attuned to
design and customer solutions
– Be a “product driven company”
with emphasis on the most beautiful
and up-to-date styling and design
– Be quality focused with excellent
reputation for building excellent
products and standing behind what
we make
– And, unlike much of the industry,
not manufacturing driven 13Residential Market Positioning
The Dixie Group
ESTIMATED TOTAL WHOLESALE MARKET
FOR CARPETS AND RUGS:
VOLUME AND PRICE POINTS
Positioning of Dixie Brands by Price Point Segment
TOTAL MARKET: SQUARE YARDS
OR SALES DOLLARS
BROADLOOM RESIDENTIAL SALES
FOCUSED NATIONAL SUPPLIER IN THE UPPER
END OF THE SOFT FLOOR COVERING MARKET
Masland
Dixie Home Fabrica
$0 $8 $14 $21 $28 $35 $42 $49
INDUSTRY PRICE/ SQ YD
AVERAGE
Note: Industry average price is based on sales reported through industry sources.
14
Excerpt from KSA Study dated May 2004, Titled "KSA Assessment of Dixie's Residential and Contract Carpet Businesses", commissioned by The Dixie Group, Inc.Dixie Group High-End Residential Sales
All Residential Brands
Sales by Brand for TTM Q1 2015
15Dixie Group High-End Residential Sales
All Brands
Sales by Channel for TTM Q1 2015
Specialty -
Commercial, OEM, 2%
1%
Builder, 4%
Mass
Merchant, 13%
Designer, 16% Retailer, 64%
The company believes that a significant portion of retail sales also involve a designer
16• Well-styled moderate to upper priced
residential broadloom line
– Known for differentiated pattern
and color selection
• Dixie Home provides a “full line” to
retailers
– Sells Specialty and Mass Merchant
retailers
• Growth initiatives
– Stainmaster® Tru Soft TM Fiber
Technology
– Stainmaster® SolarMax ® Fiber
Technology
– Durasilk Polyester
17• Leading high-end brand with
reputation for innovative styling,
design and color
• High-end retail / designer driven
– Approximately 26% of sales
directly involve a designer
• Hand crafted and imported rugs
• Growth initiative
– Stainmaster® TruSoft™ Fiber
Technology
– Wool products in both tufted and
woven constructions
18• Premium high-end brand
– “Quality without Compromise”
• Designer focused
– Approximately 34% of sales directly
involve a designer
• Hand crafted and imported rugs
• Growth initiatives
– Stainmaster® TruSoft™ Fiber
Technology
– Fabrica Permaset dyeing process
“unlimited color selection in wool”
19Commercial Market Positioning
The Dixie Group
• We focus on the “high-end specified
soft floorcovering contract market”
• Our Atlas brand
– Designer driven focused on the
fashion oriented market space
• Our Masland Contract brand
– Broad product line for diverse
commercial markets
• Our Masland Hospitality brand
– Custom products for the hospitality
industry
• Our Masland Residential sales force
– Sells “main street commercial”
through retailers 20• Atlas is our premium
commercial brand
• Dedicated to serving the
architect and designer needing
finer goods
• Focus is on the corporate
market through high fashion
broadloom and modular carpet
tile offerings
• With state-of-the-art tufting
machines Atlas can quickly
manufacture both custom and
running line products
21• Upper-end brand in the specified
commercial marketplace
– Corporate, End User, Store Planning,
Hospitality, Health Care,
Government and Education markets
• Designer focused
• Strong national account base
• Growth initiatives
– Market specific modular carpet tile
collections
– Masland Hospitality using
“computerized yarn placement”
technology
22Sales by Channel for TTM Q1 2015
Channels: Interior Design Specifier and Commercial End User
23• Avant is a forward
thinking brand that has
an Artisan’s theme
• Dedicated to servicing
the designer through
the multi-line interior
finishes sales agent
• Focus is on the
corporate market
through high fashion
broadloom and
modular carpet tile
offerings
24Dixie Group Sales
$ in millions
$407 $417
Net Sales (millions)
$331 $345
$321
$283 $270 $266
$231
$205
2006 2007 2008 2009 2010 2011 2012 2013 2014 TTM
Q1
2015
Includes Atlas Carpet Mills since March 2014 and Burtco since September 2014 25Sales & Operating Income
$ in millions
Y 2007 Y 2008 Y 2009 Y 2010 Y 2011 Y 2012 Y 2013 Y 2014
Net Sales 320.8 283 203 231 270 266 344 407
Net Income (Loss) 6.2 (31.5) (42.2) (4.7) 1.0 (0.9) 5.3 (1.4)
Non-GAAP Adjusted Op. Income 16.7 (28.5) (45.4) (2.6) 5.7 3.5 16.4 4.7
Non-GAAP Adjusted EBITDA 29.7 15.5 5.3 10.3 14.5 13.2 26.5 17.7
Q2 2013 Q3 2013 Q4 2013 Q1 2014 Q2 2014 Q3 2014 Q4 2014 Q1 2014
Net Sales 83.6 89.9 95.4 85.1 107.9 109.0 104.6 95.9
Net Income (Loss) 1.6 1.4 1.6 4.6 (0.6) (0.2) (5.2) (2.5)
Non-GAAP Adjusted Op. Income 4.7 4.7 3.8 (0.9) 2.8 3.4 (0.6) (1.9)
Non-GAAP Adjusted EBITDA 7.2 7.4 6.3 2.1 6.1 6.8 2.8 1.7
Below is the estimated cost to complete the remaining Facility Consolidation Plan:
Facility Consolidation Plan Summary Q1 2015 Q2 2015 Q3 2015 Q4 2015 2016 Est
East Coast Facility consolidation 605 595 - 227 165
East Coast Asset write off - - - - -
West Coast Facility consolidation 170 100 109 - -
Total facility consolidation and asset write off's 775 695 109 227 165
Note: Non-GAAP reconciliation starting on slide 33 262014 - 2015 Restructuring
$ in millions
To present an order of magnitude impact on Dixie due to the restructuring,
we recast the 2014 numbers using our 2013 experience in manufacturing
and claims as well as removed the impacts from the acquisitions and
restructuring. This does not include planned savings from the restructuring.
The Company has recast the numbers for 2014 in the following ways:
• Note 1 - Using the actual experience in claims and allowances in adjusting sales
• Note 2 - Using the manufacturing variances in line with the actual experience achieved in 2013 in adjusting Cost of Sales
• Note 3 - Eliminating the restructuring expense in Operating Income
• Note 4 - Removing the Atlas and Burtco transaction expenses in adjusting Cost of Sales & General and Administrative costs
• Note 4 - Removing the gain on purchase of Atlas and Burtco as a result of the write up of assets under fair value accounting
• Note 5 - Removing the operating loss and loss on asset disposal in Discontinued Operations due to the closure of the Carousel
line of business
• Results do include results of Atlas Carpet Mills from March 2014 and Burtco from September 2014 27Current Business Conditions
2015 Activity
• We continue to outperform the industry in sales growth
• Operationally we continue to create advantages for the future:
• We have launched Masland Hospitality
• We have expanded our product offerings:
• New wool products plus “Permaset” unlimited wool color
selection
• Stainmaster® TruSoft™ and PetProtect™ broadloom products
• Utilizing investments in ColorPoint™, iTuft™ and computerized
yarn placement (CYP) tufting technologies
• We have expanded our capacity:
• $350 million in 2013 to $550 to $600 million depending on mix
• We completed approximately 90% of our restructuring as of Q1 2015
• We have increased headcount by 53% since the beginning of 2013
28Current Business Conditions
2015 Initiatives
• We are now streamlining the operational changes of the past year with a
focus on training, yields, waste and process efficiencies
• We are growing our new Masland Hospitality brand, building on our
purchase of Burtco and its expertise in custom computerized yarn
placement (CYP) product offerings to the hospitality market
• We are launching a significant number of new products in 2015 through
our Atlas Carpet Mills division, a premium supplier to the specified
commercial marketplace
• We are taking advantage of our new capacity in custom machine tufted
rugs to increase our presence in both the residential and commercial
“specified designer” markets
• First 4 weeks of the second quarter carpet sales are up over 6%.
29Outlook for 2015
The housing & commercial markets are still growing:
• Our upper-end residential market is continuing to grow with an
improved economy and consumer confidence:
Masland and Fabrica Wool growth opportunities
New Stainmaster® PetProtect™ and TruSoft™ products
Stainmaster ® partnership to expand retail coverage
• Commercial market is growing, especially in the hospitality market:
Masland Hospitality growth opportunities with both new tufted and
custom computerized yarn placement offerings
Atlas growth opportunities with new products using ColorPoint™
technology and new modular tile offerings
Masland Contract has expanded modular tile collections
• Leveraging our previously expanded sales forces
• Internal operations are beginning to show the benefits of our
restructuring 30Non-GAAP Information Use of Non-GAAP Financial Information: The Company believes that non-GAAP performance measures, which management uses in evaluating the Company's business, may provide users of the Company's financial information with additional meaningful bases for comparing the Company's current results and results in a prior period, as these measures reflect factors that are unique to one period relative to the comparable period. However, the non-GAAP performance measures should be viewed in addition to, not as an alternative for, the Company's reported results under accounting principles generally accepted in the United States. The Company defines Adjusted Gross Profit as Gross Profit plus manufacturing integration expenses of new or expanded operations, plus acquisition expense related to the fair market write up of inventories, plus one-time items so defined (Note 1) The Company defines Adjusted S,G&A as S,G&A less manufacturing integration expenses included in selling, general and administrative, less direct acquisition expenses, less one-time items so defined. (Note 2) The Company defines Adjusted Operating Income as Operating Income plus manufacturing integration expenses of new or expanded operations, plus acquisition expense related to the fair market write up of inventories, plus facility consolidation and severance expenses, plus acquisition related expenses, plus impairment of assets, plus impairment of goodwill, plus one-time items so defined. (Note 3) The company defines Adjusted Income from Continuing Operations as net income plus loss from discontinued operations net of tax, plus manufacturing integration expenses of new or expanded operations, plus facility consolidation and severance expenses, plus acquisition related expenses, plus impairment of assets, plus impairment of goodwill, plus one-time items so defined, all tax effected. (Note 4) The Company defines Adjusted EBIT as net income plus taxes and plus interest. The Company defines Adjusted EBITDA as Adjusted EBIT plus depreciation and amortization, plus manufacturing in integration expenses of new or expanded operations, plus facility consolidation and severance expenses, plus acquisition related expenses, plus impairment of assets, plus impairment of goodwill, plus one-time items so defined. (Note 5) The company defines Free Cash Flow as Net Income plus interest plus depreciation plus non-cash impairment of assets and goodwill minus the net change in working capital minus the tax shield on interest minus capital expenditures net of asset sales. The change in net working capital is the change in current assets less current liabilities between periods. (Note 6) 32
Non-GAAP Gross Profit                                   2007 (a) 2008 (a) 2009 (a)     2010      2011      2012      2013      2014   Q1 2015
Net Sales                                               320,795 282,710 203,480       231,322   270,110   266,372   344,374   406,588  95,855
Gross Profit                                             97,217   78,089   52,105      56,651    65,506    65,372    85,569    95,497  23,339
Plus: Business integration expense                          -        -        -           -         -       1,383     4,738       445     -
Plus: Amortization of inventory step up                     -        -        -           -         -         -         367       606     -
Non-GAAP Adj. Gross Profit (Note 1)                      97,217   78,089   52,105      56,651    65,506    66,755    90,674    96,548  23,339

Gross Profit as % of Net Sales                            30.3%    27.6%      25.6%     24.5%     24.3%     24.5%     24.8%     23.5%   24.3%
Non-GAAP Adj. Gross Profit % of Net Sales                 30.3%    27.6%      25.6%     24.5%     24.3%     25.1%     26.3%     23.7%   24.3%

Non-GAAP S,G&A                                          2007 (a) 2008 (a) 2009 (a)     2010      2011      2012    2013    2014    Q1 2015
Net Sales                                               320,795 282,710 203,480       231,322   270,110   266,372 344,374 406,588   95,855
Selling and Administrative Expense                       78,789   76,115   60,542      57,362    60,667    63,489  76,221  93,182   24,757
Plus: Business integration expense                          -        -        -           -         -         -    (1,706) (1,429)     -
Less: Acquisition expenses                                  -        -        -           -         -        (318)   (350)   (790)     -
Non-GAAP Adj. Selling and Administrative Expense         78,789   76,115   60,542      57,362    60,667    63,171  74,164  90,963   24,757

S,G&A as % of Net Sales                                   24.6%    26.9%      29.8%     24.8%     22.5%     23.8%     22.1%     22.9%   25.8%
Non-GAAP Selling and Admin as % of Net Sales (Note 2)     24.6%    26.9%      29.8%     24.8%     22.5%     23.7%     21.5%     22.4%   25.8%

Non-GAAP Operating Income                               2007 (a) 2008 (a)   2009 (a)  2010    2011         2012      2013      2014   Q1 2015
Net Sales                                               320,795 282,710     203,480 231,322 270,110       266,372   344,374   406,588  95,855
Operating income (loss)                                  16,707 (28,460)     (45,390) (2,570)  5,668        1,815     8,855    (5,236) (2,683)
Plus: Acquisition expenses                                  -        -           -       -       -            318       350       790     -
Plus: Amortization of inventory step up                     -        -           -       -       -            -         367       606     -
Plus: Business integration expense                          -        -           -       -       -          1,383     6,616     1,874     -
Plus: Facility consolidation expense                        -        -           -       -       -            -         -       5,514     775
Plus: Impairment of assets                                  -        -           -       -       -            -         195     1,133     -
Plus: Impairment of goodwill                                -        -           -       -       -            -         -         -       -
Non-GAAP Adj. Operating Income (Loss) (Note 3)           16,707 (28,460)     (45,390) (2,570)  5,668        3,516    16,384     4,682  (1,908)

Operating income as % of net sales                         5.2%    -10.1%    -22.3%     -1.1%      2.1%      0.7%      2.6%     -1.3%    -2.8%
Adjusted operating income as a % of net sales              5.2%    -10.1%    -22.3%     -1.1%      2.1%      1.3%      4.8%      1.2%    -2.0%

                                                                                                                                          33
Non-GAAP EBIT and EBITDA 2007 (a) 2008 (a) 2009 (a) 2010 2011 2012 2013 2014 Q1 2015
Net income (loss) as reported 6,247 (31,481) (42,241) (4,654) 986 (927) 5,291 (1,402) (2,468)
Less: (Loss) from discontinued, net tax (521) (313) (382) (280) (286) (275) (266) (2,075) (88)
Plus: Taxes 3,686 (2,932) (8,870) (2,604) 684 (401) (576) 1,054 (1,490)
Plus: Interest 6,347 5,965 5,521 4,124 3,470 3,146 3,756 4,302 1,177
Non-GAAP Adjusted EBIT (Note 5) 16,801 (28,134) (45,208) (2,854) 5,426 2,092 8,737 6,029 (2,693)
Plus: Depreciation and amortization 12,941 13,752 13,504 11,575 9,650 9,396 10,263 12,908 3,637
EBITDA 29,742 (14,382) (31,704) 8,721 15,075 11,488 18,999 18,937 944
Plus: Acquisition expenses - - - - - 318 350 790 -
Plus: Amortization of inventory step up - - - - - - 367 606 -
Less: Gain on purchase of business - - - - - - - (11,110) -
Plus: Business integration expense - - - - - 1,383 6,616 1,874 -
Plus: Facility consolidation expense - 2,317 4,091 1,556 (563) - - 5,514 775
Plus: Impairment of assets - 4,478 1,459 - - - 195 1,133 -
Non-GAAP Adj. EBITDA (Note 5) 29,742 15,534 5,252 10,277 14,512 13,189 26,528 17,745 1,719
Non-GAAP Adj. EBITDA as % of Net Sales 9.3% 5.5% 2.6% 4.4% 5.4% 5.0% 7.7% 4.4% 1.8%
Management estimate of severe weather (not in above) - - - - - - - 1,054 -
Non-GAAP Free Cash Flow 2007 (a) 2008 (a) 2009 (a) 2010 2011 2012 2013 2014 Q1 2015
Non-GAAP Adjusted EBIT (from above) 16,801 (28,134) (45,208) (2,854) 5,426 2,092 8,737 6,029 (2,693)
Times: 1 - Tax Rate = EBIAT 10,416 (17,443) (28,029) (1,769) 3,364 1,297 5,417 3,738 (1,670)
Plus: Depreciation and amortization 12,941 13,752 13,504 11,575 9,650 9,396 10,263 12,908 3,637
Plus: Non Cash Impairment of Assets and Goodwill - 27,599 32,865 - - - 195 1,133 -
Minus: Net change in Working Capital 2,211 2,147 (24,868) 3,880 9,921 10,541 18,721 17,645 546
Non-GAAP Cash from Operations 21,146 21,761 43,208 5,926 3,093 152 (2,847) 134 1,421
Minus: Capital Expenditures net of Asset Sales 16,638 8,871 511 1,761 6,735 4,052 13,257 32,825 5,704
Minus: Business / Capital acquisitions - - - - - 6,961 1,863 9,279 -
Non-GAAP Free Cash Flow (Note 6) 4,508 12,890 42,697 4,165 (3,642) (10,861) (17,967) (41,970) (4,283)
Current Assets 119,804 117,011 88,933 96,853 100,999 115,055 149,789 173,817 183,209
Current Liabilities 44,467 39,527 36,317 40,357 34,582 38,097 54,110 60,493 69,339
Net Working Capital 75,337 77,484 52,616 56,496 66,417 76,958 95,679 113,324 113,870
Change in Net Working Capital 2,211 2,147 (24,868) 3,880 9,921 10,541 18,721 17,645 546
34Recast Non-GAAP Information Year 2014
Use of Non-GAAP Financial Information:
The Company believes that non-GAAP performance measures, which management uses in evaluating the Company's business, may
provide users of the Company's financial information with additional meaningful bases for comparing the Company's current results
and results in a prior period, as these measures reflect factors that are unique to one period relative to the comparable period.
However, the non-GAAP performance measures should be viewed in addition to, not as an alternative for, the Company's reported
results under accounting principles generally accepted in the United States.
The Company has recast the numbers for 2014 in the following ways:
• Note 1 - Using the actual experience in claims and allowances in adjusting sales
• Note 2 - Using the manufacturing variances in line with the actual experience achieved in 2013 in adjusting Cost of Sales
• Note 3 - Eliminating the restructuring expense in Operating Income
• Note 4 - Removing the Atlas and Burtco transaction expenses in adjusting Cost of Sales & General and Administrative costs
• Note 4 - Removing the gain on purchase of Atlas and Burtco as a result of the write up of assets under fair value accounting
• Note 5 - Removing the operating loss and loss on asset disposal in Discontinued Operations due to the closure of the Carousel
line of business
• Results do include results of Atlas Carpet Mills from March 2014 and Burtco from September 2014
Prior Year Actual Recast Non-GAAP
December 28, December 27, December 27, Recast
Summary 2013 2014 2014 Notes
(1)
Net Sales 344 407 408
(2)
Operating Margin 85.6 95.5 107.2
Operating Margin % 24.8% 23.5% 26.3%
(3) (4)
Operating Income (Loss) 8.9 (5.2) 13.9
Operating Income as % of Sales 2.6% -1.3% 3.4%
(5)
EBITDA Cont Op's (2014 Recast Non-GAAP) 19.0 18.9 27.0
35Facility Consolidation Information
Facility Consolidation Plan Summary Q1 2015 Q2 2015 Q3 2015 Q4 2015 2016 Est
East Coast Facility consolidation 605 595 - 227 165
East Coast Asset write off - - - - -
West Coast Facility consolidation 170 100 109 - -
Total facility consolidation and asset write off's 775 695 109 227 165
36You can also read