Bilfinger SE Company Presentation

Page created by Kent Cobb
 
CONTINUE READING
Bilfinger SE Company Presentation
Bilfinger SE

Bilfinger SE Company Presentation
Christina Johansson, CFO
UniCredit Kepler Chevreux GCC, Frankfurt
January 22, 2019
Bilfinger SE Company Presentation
Overview
Bilfinger SE Company Presentation
Bilfinger at a glance

     
                                                                                                €4bn revenue
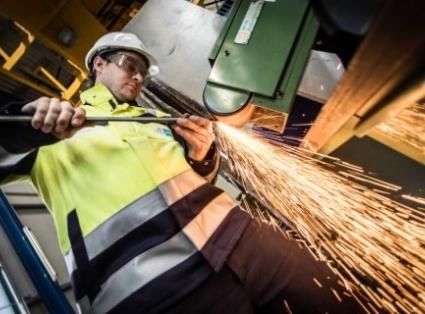
           Leading international industrial services provider

          Efficiency enhancement of assets, ensuring a high level of availability
           and reducing maintenance costs

          Clear 2-4-6 strategy with two service lines, four regions and six focus
                                                                                     thereof
                                                                                     recurring business >60%
           industries

          Combination of CAPEX-driven (E&T) and OPEX-driven business (MMO)
                                                                                       Orders Received*   +13%
          Large share of business with long-term frame contracts and high

                                                                                          €3.0m EBITA adjusted
           retention rates

          Well-established customer base with focus on process industries

          Highly recognized safety and quality performance
                                                                                     Approx.   36,000 employees
          Digital pioneer for the process industry                                                   based on FY 2017 and *9m 2018
Bilfinger SE | Company Presentation | January 2019                                                                            page 3
Bilfinger SE Company Presentation
Back to Profitable Growth
    2 Service Lines, 4 Regions, 6 Industries

   Our ambition                                                          We engineer and deliver
                                                                        process plant performance

                                                     2 Service Lines                   4 Regions                        6 Industries
                                         • E&T – Engineering &             •   Continental Europe               • Chemicals &    • Pharma &
   Where to play                           Technologies                    •   Northwest Europe                   Petrochem        Biopharma
                                         • MMO – Maintenance,              •   North America                    • Energy &       • Metallurgy
                                           Modifications & Operations                                             Utilities      • Cement
                                                                           •   Middle East
                                                                                                                • Oil & Gas

                                                     People &           Customer &                  Organization &
                                                                                                                                Financials
                                                      Culture           Innovation                    Structures
   How to win

Bilfinger SE | Company Presentation | January 2019                                                                                              page 4
Bilfinger SE Company Presentation
Service Portfolio
    Strong offering for capex and opex driven services

                                                        E&T – Engineering &
                                                           Technologies
                                                                                                          OPEX

         Packaged Units                                                                                              Turnarounds
                                                             Efficiency

                                                                             Modifications
                                                                                             Maintenance
                                                       Expansions

                                                                                             Operations
        Plant Expansions                                     Emissions                                           Maintenance Contracts

                                                     CAPEX

                                                                           MMO – Maintenance,
        De-Sulfurizations
                                                                          Modifications & Operations                  Operations
Bilfinger SE | Company Presentation | January 2019                                                                                  page 5
Bilfinger SE Company Presentation
Compliance and integrity
    Deferred Prosecution Agreement concluded

   Starting Point                                    First Steps                  Effective compliance           World Class Compliance
                                                                                  system                         System

     2003 – 2005                                      2013 – 2015                  2016 – 2018                    2019 onwards

   • Nigeria corruption case                         •   DPA                        • Extended DPA                • Continuous
                                                     •   Start of monitorship       • Strong tone from the top      improvement
                                                     •   Exchange of leadership     • Accelerated BCRP roll-      • Value based
                                                     •   BCRP start                   out                           compliance system
                                                                                    • Build up of compliance      • Sustainable
                                                                                      organisation                  development
                                                                                    • Reduction of complexity     • Compliance as
                                                                                    • Change of Culture             competitive
                                                                                      Program                       advantage
                                                                                    • 12/2018: Compliance
                                                                                      program certified by
                                                                                      monitor

Bilfinger SE | Company Presentation | January 2019
                                                                                    • End of DPA
                                                                                                                                         page 6
Bilfinger SE Company Presentation
Growth potential through digitalization
Bilfinger SE Company Presentation
Market potential
    We see significant market potential in digitalizing the process industry

     Estimated market potential
       • More than 16,000 plants within 2-4-6 in Continental and Northwest
         Europe
       • ~4,000 of these plants are mid-sized type with strong appetite for
         digitalization

       • Varying acceptance rate per industry – highest acceptance
         expected in Chemicals & Petrochem, Energy and Oil & Gas
       • Yearly volume per actual client expected around 1-2 m EUR

       • Total market potential in Europe calculated around 7 bn EUR
       • Market penetration mainly driven by availability of brainpower
       • Additional market potential in Middle East and North America

Bilfinger SE | Company Presentation | January 2019                             page 8
Bilfinger SE Company Presentation
Strategic position
    Bilfinger is well positioned to be the frontrunner in the IoT of process industries

     Process Industry                                Bilfinger                                     IT Industry

        Digitalization hurdles                                   Building digital bridges            Applicability deficits

      • Requirement to                                 • Deep knowledge of customer needs and      • No access to plant
        improve performance                              processes                                   operators
      • Lack of digitalization                         • Comprehensive digitalization know-how     • Challenge to apply IoT
        knowledge                                      • Independent service provider                knowledge to process
                                                       • Nr.1 in conventional services in Europe     industries

                                                          WE MAKE DIGITALIZATION WORK!

Bilfinger SE | Company Presentation | January 2019                                                                            page 9
Bilfinger SE Company Presentation
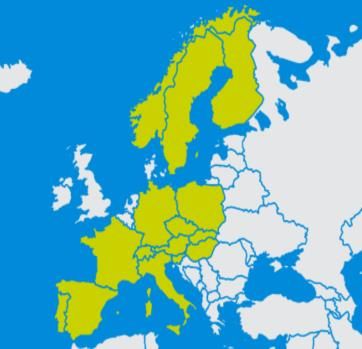
New analysis options
    BCAP® provides a better decision-making basis

                                     What has happened?   What could happen?        What should we do?

                                    Descriptive           Predictive               Prescriptive
                                    Analytics             Analytics                Analytics

                                   Dashboards, reports    Predictive maintenance   Dynamic operation support

Bilfinger SE | Company Presentation | January 2019                                                             page 10
Improving our financial performance
Ambitions will be achieved in three stages

  Value
                                                                Build out

                                                     Build up

                     Stabilization

                                                                            Time
                     What does it mean in numbers?
                     How will we execute?
                     How will we measure and report progress?

Bilfinger SE | Company Presentation | January 2019                                 page 12
We will address all P&L line-items

     GROSS MARGIN

           •      LOA1 process
           •      Project management                    Impact on
                                                      gross margin:
                                                     improvement of
                                                         ~200bps      AMBITION2
     ADDRESSING BOTH LINE ITEMS
                                                                      EBITA margin
           •     Process and IT harmonization                          increase of
           •     Procurement                                            ~500bps
                                                                        by 2020
                                                        Impact on
     SG&A RATIO                                        SG&A ratio:
                                                     Improvement of
           •     Lean headquarters                       ~300bps
           •     Lean structures in the field

    1) Limits of authority   2) Mid-cycle targets
Bilfinger SE | Company Presentation | January 2019                                   page 13
Portfolio rotation 2019 and 2020
    Further margin enhancement while keeping a sound balance sheet

      Funding sources:                                                        Re-Investment:
                                                                  Margin
      1. Disposal Other Operations (OOP)                                      ▪ Strengthening
                                                                  accretion
          4 „accretive“ legal entities to be sold                               growth regions

      2. Potential disposal of selected margin-                               ▪ Strengthening
          dilutive units                                                        growth industries
                                                                              ▪ M&A criteria:
      3. Apleona
                                                                                ▪ EBITA accretive
          Vendor‘s Note
                                                                                  one year after
          €100m, 10% compound interest p.a.
                                                                                  integration, ROCE
          Accrued value 09/2018: €122m
                                                                                  beats WACC two
          Preferred Participation Note
                                                                                  years after
          Book value 09/2018: €233m
                                                                                  integration
           Typical money multiple of owner EQT
          would lead to a significant value upside                              ▪ Immediate start of
                                                     Freeing-up                   comprehensive
           Will receive 49% of sales proceeds
                                                          funds                   integration
          (after repayment of debt) at exit

Bilfinger SE | Company Presentation | January 2019                                                  page 14
Targets 2020 and Wrap-up
Bilfinger 2020 – Company passes three phases
    Stabilization phase completed

   Value
                                Stabilization
                                                                      Build up                                Build out

              • Strategy defined                             •   Top line growth resumed              • Process and System
              • Organization announced                       •   First successes in new growth areas     harmonization fully rolled out
              • Execution master plan                        •                                
                                                                  New organization in full swing        • Performance culture
              • Top Management Team                          •   Consistent project management           established
              • Dividend proposed                                process established                  • Productivity wheel in full swing
              • B TOP rolled out                             •   Net Profit break-even                 • Complexity significantly
              • LOA Process rolled out                       •   Adj. FCF positive latest in FY 2018     reduced
              • SAP roll-ins commenced                       •   Share buyback completed  
              • CRM implementation started                   •   Successfully refinanced                   Financial ambition reached
              • Cash focus in
                incentive system increased            
              • Operating performance improved            
                                                                                                                                             Time
Bilfinger SE | Company Presentation | January 2019                                                                                             page 16
Benefit from 49% of the value creation at Apleona

      Vendor‘s Note: €100m, 10% compound interest p.a. upon maturity (book value 09/2018: €114m)

      Preferred participation note (PPN):

      •     No management involvement
      •     Certain information rights, some further rights
      •     Investment: €195m
      •     Book value 09/2018: €233m
      •     Measured at Fair Value through Profit & Loss

              Will receive 49% of sales proceeds (after repayment of debt) at exit

              Typical money multiple of owner EQT would lead to a significant value upside

Bilfinger SE | Company Presentation | January 2019                                                 page 17
Bilfinger 2020
    Financial ambition

               Organic Growth                                            Profit                                      Cash                                   Return
                                                                                                      • Positive adj. FCF from
                                                           • EBITA adjusted ~5%                                                                             Post-tax
                                                                                                        2018 onwards
                                                           • Gross margin                                                                                ROCE reported:
                 >5% CAGR                                                                             • Over the cycle, from 2018
                                                             improvement by ~200bps                                                                        8 to 10%
          based on revenue FY 2017                                                                      onwards: Cash Conversion
                                                           • SG&A ratio reduction by
                                                                                                        Rate ~ 1 (minus growth
                                                             ~300bps
                                                                                                        adjustment)1

           Capital Structure                                                       Investment Grade (mid-term perspective)

                                                                                   Sustainable dividend stream going forward
           Dividend Policy
                                                                                   Policy: 40 to 60% of adjusted net profit

                                                     1   Cash Conversion Definition: (Adj. EBITA + Depreciation – Change NWC - Net CAPEX) / Adj. EBITA

Bilfinger SE | Company Presentation | January 2019                                                                                                                        page 18
BACKUP
Quarterly Statement Q3 and Guidance FY 2018
Q3 2018
    Stable Quarter, favorable business environment

              Growth in orders received against strong prior year
              Book-to-bill >1

               Revenue growth on track

               EBITA adjusted slightly higher, margin on prior-year level

               Net profit improved

               Free and operating cash flow above prior year

               Outlook 2018 confirmed

Bilfinger SE | Company Presentation | January 2019                          page 20
Current market situation and trends E&T

    Oil & Gas
    • Continuing brownfield investments in Europe, greenfield investments
      developing in gas
    • Increasing up- and mid-stream activities in US Shale, in particular for cryo-
      driven gas strippers

    Chemicals & Petrochem
    • Brownfield investments in Europe
    • Growth in US chemical industry
    • Middle East with continued focus on plants to maintain downstream value-add
      within the region

    Energy & Utilities
    • Growth perspective especially in European nuclear
    • Growing demand on regulatory emissions reduction (in particular IMO)

    Pharma and Biopharma
    • Ongoing strong demand in Europe
    • Increasing interest from Emerging Markets

Bilfinger SE | Company Presentation | January 2019                                    page 21
Current market situation and trends MMO

    Oil & Gas
    • Steady demand for maintenance services,
      but competition remains strong
    • In the North Sea, early signs for reinvestments in exploration

    Chemicals & Petrochem
    • Stable demand in Europe and Middle East for
      maintenance and modifications, evaluation of contracting-out opportunities
    • Turnarounds scheduled for 2019 and already 2020

    Energy & Utilities
    • First steps towards contracting-out of maintenance and operations in Europe
    • Shift from conventional to alternative energy in Middle East

    Metallurgy
    • Ongoing strong demand in Aluminum
    • Signs of recovery in steel industry

Bilfinger SE | Company Presentation | January 2019                                  page 22
Continued positive momentum in orders received
    Book-to-bill >1

                                                                    Development of orders received

                                                                        +5%/+6%
                                                                                                            • Orders received:
                                     1,054              1,085            1,101              1,139   1,105     5% above strong prior year (org.:
                                                                                             696     670      +6%), especially positive in E&T
                                     825                 819              786
          Orders                                                                            (61%)   (61%)
                                    (78%)               (75%)            (76%)                              • Share of orders > €5 million once
        received
      (€ million)                                                                                             again on high level
                                                         266              315                443     435
                                      229
                                     Q3/17              Q4/17            Q1/18              Q2/18   Q3/18
                                                                                                            • Book-to-bill: 1.1

                                       < €5 million   Δ compared with                                       • Order backlog:
                                                                         x/x      organic
                                       > €5 million    previous year                                          +12% above prior year
                                                                                                              (org.: +13%)
         Book-to-
         bill ratio                    1.1                1.0             1.2                1.1     1.1

          Order                      2,536              2,531            2,689
        backlog
                                                                                            2,767   2,828
      (€ million)
Bilfinger SE | Company Presentation | January 2019                                                                                          page 23
Again organic growth in revenue, EBITA margin adj. on prior-year level

                                                               Development of revenue and profitability

                                                                                                             • Revenue:
                                                                       +5%/+8%                                 Increase of +5% (org. +8%) as a
                                       1,001             1,082                               1,058   1,052     result of increased orders
                                       2.1%             3.7%                 929
        Revenue                                                                                      2.1%      received
       (€ million)
                                                                                                             • EBITA adj.:
                                                                                             1.1%
                                                                         -0.6%                                 Slight increase against prior year
                                                                                                               (which was marked by positive
                                       Q3/17             Q4/17           Q1/18               Q2/18   Q3/18     one-off effect in E&T), margin on
                                                     Δ compared with                                           prior-year level
                                        EBITA adj.                     x/x         organic
                                                      previous year
                                        margin (%)                                                           • Special items:
                                                                                                               Decrease in burdens from
       EBITA adj.
                                        21                40                 -6              12      22        special items: €11 million
       (€ million)
                                                                                                               compared to €26 million in prior
           EBITA                                                                                               year
       (€ million)                      -6                 2                 -11              -1     11

Bilfinger SE | Company Presentation | January 2019                                                                                            page 24
SG&A ratio continues to move towards target level of 7.5%
    Expenses unchanged at ~€90m despite start-up costs for Digitalization and Business
    Development

                         Adjusted gross profit (€ million)      Adjusted selling and administrative expenses (€ million)

                        101                              100
                                                95
                      (10.1%)                          (9.5%)
                                              (9.0%)
                         0                                0                10           11
                                                 0                                                   5

                                                                           -96          -103        -96
                        101                     95       100             (-9.6%)      (-9.7%)     (-9.0%)
                      (10.1%)                 (9.0%)   (9.5%)

                                                                           -86          -92         -91
                                                                         (-8.6%)      (-8.7%)     (-8.6%)
                        Q3/17                  Q2/18   Q3/18             Q3/17        Q2/18        Q3/18

Bilfinger SE | Company Presentation | January 2019                                                                         page 25
E&T: strong orders received as basis for further growth

                                                             Development of revenue and profitability

                                                                                                        • Orders received:
                                                                +10%/+10%                                 Strong quarter: +64% (org. +63%)
                                                                                                          compared to low prior-year figure,
                            281                      308                             299       309        book-to-bill 1.5
 Revenue                  3.6%                                       265
                                                                                                          a.o. due to various contract awards
(€ million)
                                                                                                          for ship scrubbers
                                                     5.0%
                                                                    0.2%             2.6%               • Order backlog:
                                                                                               1.2%       €1,013 million, i.e. increase of +29%
                           Q3/17                     Q4/17         Q1/18             Q2/18     Q3/18
                                                                                                        • Revenue:
                               EBITA adj. margin (%)         Δ compared with
                                                                               x/x   organic              Increased by +10% (org. +10%) on
                               Revenue (€ million)            previous year
                                                                                                          the basis of higher orders received

                                                                                                        • EBITA adjusted:
   Book-to-
                              1.0                     0.9             1.1             1.3       1.5       Normalization at still low level, prior-
   bill ratio
                                                                                                          year figure positively impacted by
                                                                                                          approved claims
     EBITA
        adj.                  10                      15               1               7        4
 (€ million)
Bilfinger SE | Company Presentation | January 2019                                                                                              page 26
MMO: EBITA margin adj. improved significantly

                                                             Development of revenue and profitability

                                                                  +7%/+8%                                  • Orders received:
                                                                                                             Decrease as expected
                              664                    716                               708          712
                                                                     625                                     -16% (org. -15%) compared to
 Revenue                                                                                           5.2%
                                                                                                             prior-year figure, which was
(€ million)
                                                     5.2%                              2.6%                  impacted by catch-up effects and
                             4.4%
                                                                                                             entry of new framework contracts
                                                                    2.1%
                             Q3/17                   Q4/17          Q1/18              Q2/18       Q3/18   • Order backlog:
                                                                                                             €1,691 million, i.e. increase of +3%
                              EBITA adj. margin (%)            Δ compared with
                                                                                         organic           • Revenue:
                              Revenue (€ million)               previous year    x/x
                                                                                                             Growth by +7% (org. +8%)
                                                                                                           • EBITA margin adjusted:
   Book-to-
                               1.1                    1.0            1.2                1.0         0.9      Significant increase
   bill ratio

     EBITA
        adj.                   29                     35             13                 19          37
 (€ million)
Bilfinger SE | Company Presentation | January 2019                                                                                            page 27
OOP1): Focus on disposal of "Accretive" entities

                   Revenue OOP (€ million)
                                                               • Progress M&A track:
                                    71                           Dilutive: originally 13 units, meanwhile all have been sold or terminated
                                                                 Accretive: four entities, thereof two in sales processes
                accretive
                                    47                45
                dilutive
                                                               • Business development:
                                                                 Orders received with positive development (+6%, org. +29%)
                                                      44         Revenue declining by -37% mainly due to sale of “dilutive” entities
                                    24                           (org. -2%)
                                                       1         EBITA adj. slightly improved from -€2 to break-even
                                   Q3/17             Q3/18
      Orders
    received
                                    55                 58
  (€ million)
       EBITA
         adj.
  (€ million)                       -2                     0
1) Part of Reconcilliation Group
Bilfinger SE | Company Presentation | January 2019                                                                                           page 28
Operating cash flow positive, net profit improved

                                        Adjusted operating cash flow1 (€ million)                                                                                                                             Adjusted
                                                                                                                            Net profit (€ million)                                                       net profit (€ million)

                                                                                                                                                                                                             13                    13
                                                                   17                                                                                       -1
                           Adjust-                                                        11
                                                   26
                            ments                                                     9
                                                                                  2
                      Reported                      -9
                                               Q3/17                              Q3/18                                              -21                                                                   Q3/17               Q3/18
                                                                                                                               Q3/17                       Q3/18
1 Adjustments correspond to EBITA adjustments, partial time offset in cash flow

                                                      Net Trade Assets (€ million)                                                                           Net cash (€ million)

                                                                                                                    16       11              -9
                                                                                                                                                                 -17
                                                                                                                                                                                0
             542                       589                       619                                                                                                                         -29
                                                                                   82 68       84         87
                                                                                                    68         67                                                                                             -9           0
                                                                                                                                                                                                                                        -37

                                                                                                                                                                 Net Capex

                                                                                                                                                                                             cash flow

                                                                                                                                                                                                                                        Sep 30
                                                                                                                    Jul 1

                                                                                                                              OCF adjusted

                                                                                                                                                                                             Financing

                                                                                                                                                                                                                           Other
                                                                                                                                                                                                              operations
                                                                                                                                             Adjustments

                                                                                                                                                                             Acquisitions/
                                                                                                                                                                                disposals

                                                                                                                                                                                                              Cash flow
                                                                                                                                                                                                           discontinued
         Sep 30,                Jun 30,    Sep 30,                                 Sep 30,    Jun 30,     Sep 30,
          2017                   2018       2018                                    2017       2018         2018
                              Net Trade Assets (€ million)                            DSO (days)      DPO (days)
DSO: Trade receivables + WIP - advance payments received, DPO: Trade payables

Bilfinger SE | Company Presentation | January 2019                                                                                                                                                                                               page 29
Outlook 2018 confirmed

       in € million                                  FY 2017                          Expected FY 2018

                                                                                      Organic growth in the mid single-digit percentage
       Orders Received                               4,0551)
                                                                                      range

       Revenue                                       4,044                            Organically stable to slightly growing

                                                                                      Significant increase to mid-to-higher double-digit-
       EBITA adjusted                                3
                                                                                      million € amount, i.e. range of €50 to €75 million

     1) As reported, based on output volume/ comparable based on revenue: €4,079 million

Bilfinger SE | Company Presentation | January 2019                                                                                          page 30
The Bilfinger Investment Case:
    Turnaround case based on favorable business model

         Structural demand for industrial                 Favorable business                                          Financial soundness
         services                                         characteristics
                                                                                                                      • BB / stable outlook
                                                          • >60% of output in recurring                               • 35% equity ratio (as of Sep 30,
         • Increasing # of Industrial plants
         • Increasing total service market and              business                                                    2018)
           contracted out market                          • No material dependency from                               • Financial participation in Apleona
         • Rising age and complexity                        single clients or regions                                   with significant upside potential
         • Customers demand for greater efficiency        • Growing regional diversification                          • Financial policy: Ambition (mid-term
         • Service bundling                                                                                             perspective) Investment Grade
         • Stricter environmental standards
                                                                                                                      Shareholder-friendly
          Good starting position:                         Asset light business                                        distribution*
          • Consistently No. 1 supplier of industrial     • Capex: 1.5 – 2.0% of output                               • From FY 2016 onwards:
            services for the process industry in Europe     volume                                                      €1.00 dividend floor
          • Clearly defined strategy                      • Balanced net working capital                              • Sustainable dividend stream going
          • Organization derived from strategy              profile                                                     forward:
          • Detailed implementation plan                                                                                40 to 60% of adjusted net profit
          • Growth and profitability targets                                                                          • Share buyback program of up to
          • Growth will be supported by additional                                                                      €150m started in Sep 2017 and
            business development and digitalization                                                                     completed in Oct 2018
            activities                                            * Based on current expectations and execution of presented strategy as well as on economic outlook at the time.
Bilfinger SE | Company Presentation | January 2019                                                                                                                         page 31
Disclaimer

         This presentation has been produced for support of oral information purposes only and contains forward-
         looking statements which involve risks and uncertainties. Forward-looking statements are statements that are
         not historical facts, including statements about our beliefs and expectations. Such statements made within this
         document are based on plans, estimates and projections as they are currently available to Bilfinger SE.
         Forward-looking statements are therefore valid only as of the date they are made, and we undertake no
         obligation to update publicly any of them in light of new information or future events. Apart from this, a number
         of important factors could therefore cause actual results to differ materially from those contained in any forward-
         looking statement. Such factors include the conditions in worldwide financial markets as well as the factors that
         derive from any change in worldwide economic development.
         This document does not constitute any form of offer or invitation to subscribe for or purchase any securities. In
         addition, the shares of Bilfinger SE have not been registered under United States Securities Law and may not
         be offered, sold or delivered within the United States or to U.S. persons absent registration under or an
         applicable exemption from the registration requirements of the United States Securities Law.

Bilfinger SE | Company Presentation | January 2019                                                                             page 32
You can also read