FULL-YEAR RESULTS TO 30 JUNE 2021 - August 2021 - BWP Trust
←
→
Page content transcription
If your browser does not render page correctly, please read the page content below
FULL-YEAR RESULTS
TO 30 JUNE 2021
August 2021
IMPORTANT NOTICE

The information provided in this presentation should be considered together with the financial statements for the period and
previous periods, ASX announcements and other information available on the Trust’s website.
This presentation has been prepared by BWP Management Limited as the responsible entity for BWP Trust. The information
provided is for information purposes only and does not constitute an offer to arrange to issue securities or other financial
products, nor is it intended to constitute legal, tax or accounting advice or opinion. The information contained in this
presentation is not investment or financial product advice and is not intended to be used as the basis for making an
investment decision. This presentation has been prepared without taking into account the investment objectives, financial
situation or particular needs of any particular person.
All reasonable care has been taken in preparing the information contained in this presentation, however no representation or
warranty, express or implied, is made as to the fairness, accuracy, completeness or correctness of the information, opinions
and conclusions contained in this presentation. Without limiting the preceding sentence, no representation or warranty,
express or implied, is given as to the accuracy, completeness, likelihood of achievement or reasonableness of any forward-
looking statements, forecasts, prospects or returns contained in this presentation. Such forward-looking statements,
forecasts, prospects or returns are by their nature subject to significant uncertainties and contingencies, many of which will
be outside the control of BWP Trust or BWP Management Limited. Also, past performance is no guarantee of future
performance.
Before making an investment decision, you should conduct your own due diligence and consult with your own legal, tax or
accounting adviser as to the accuracy and application of the information provided in this presentation and in respect of your
particular investment needs, objectives and financial circumstances.

                                              FULL-YEAR RESULTS TO 30 JUNE 2021                                                  2
PRESENTATION OUTLINE
Michael Wedgwood Summary
slides 4-6
Managing Director Results
BWP Management Limited slides 7-10
Portfolio
slides 11-17
Andrew Ross Core portfolio
slides 18-23
Head of Property
Divestments
BWP Management Limited slides 24-26
Alternative use properties
slides 27-28
David Hawkins Capital management
Finance Manager slides 29-32
BWP Management Limited Outlook
slides 33-34
FULL-YEAR RESULTS TO 30 JUNE 2021 3SUMMARY
SUMMARY | FULL-YEAR RESULTS TO 30 JUNE 2021 42021 FULL-YEAR RESULTS
AT A GLANCE
$152.2m ▼ $117.5m 18.29cpu $3.29 ▲ 15.1% pa
Total income 2.3%1 Dist. Profit Ordinary distribution NTA 7.5%1 10 yr total return
PORTFOLIO PORTFOLIO CAPITAL
PERFORMANCE MANAGEMENT MANAGEMENT
New leasing arrangements in place for A- S&P rating/
1.6% Port Macquarie, Cairns, Belmont North and A3 Moody’s rating
like-for-like rental growth Midland
$149.2 million2 16 market rent reviews completed 17.7%
portfolio revaluation uplift with rents broadly in line with market gearing
$135m and $110m bank
5.65% 10 facilities extended by a further
Bunnings Warehouse year each and additional $100m
portfolio cap rate
options exercised MTN issued. A $110m five-year
forward start facility put in place
4.2 years 97.8% 3.3%
portfolio weighted average cost of debt at 30 June 2021
leased
lease expiry (“WALE”)
1 In comparison to prior corresponding period.
2 Gross $150.9 million revaluation gain before straight-lining of rent.
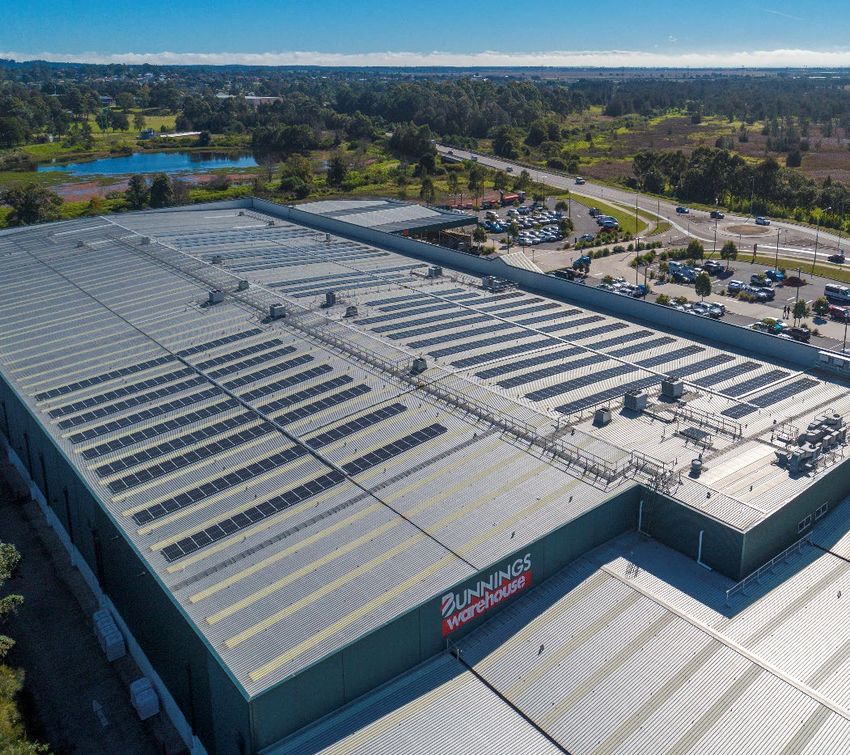
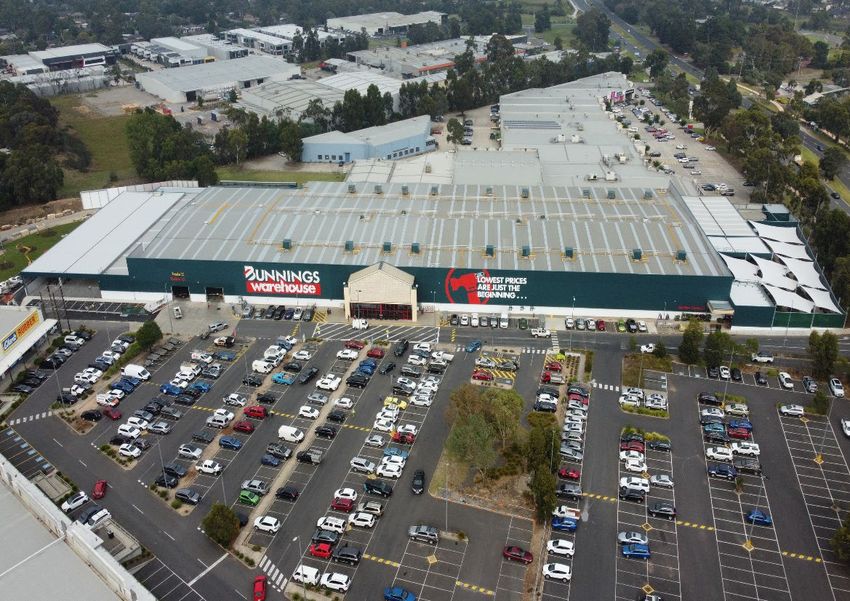
SUMMARY | FULL-YEAR RESULTS TO 30 JUNE 2021 5CLIMATE RISK AND SUSTAINABILITY
ACTIONS
> Completed review of boundaries for Scope
1 and 2 emissions, taking into account Wallsend, NSW
structure and operational control
> Operational carbon emissions of 177
tonnes of C02 for FY2021. Purchasing
Australian Carbon Credit Units (“ACCUs”)
to offset the residual emissions
> Solar power generation installed at three
properties during the year, 23 solar
installations now completed
> 96% of properties have LED lighting in one
or more of car park, nursery trading area,
canopy trading area, or main store
> Completed climate change analyses for
20C and 40C temperature change
scenarios, potential impacts not
considered a material business risk
SUMMARY | FULL-YEAR RESULTS TO 30 JUNE 2021 6RESULTS
RESULTS | FULL-YEAR RESULTS TO 30 JUNE 2021 72021 FINANCIAL PERFORMANCE
VS PCP
FY21 PCP1
Total revenue ($m) 152.2 155.8
Management expense ratio (%) 0.63 0.64
Other expenses ($m) 8.6 8.8
Net profit2 (excluding revaluations) ($m) 114.0 117.1
Number of units on issue (m) 642.4 642.4
Full-year ordinary distribution (cents per unit) 18.29 18.29
Total assets ($m) 2,674.6 2,552.6
Borrowings ($m) 474.7 503.2
Net tangible assets ($ per unit) 3.29 3.06
Gearing (debt to total assets) (%) 17.7 19.7
1 pcp: prior corresponding period, being the 12 months ended 30 June 2020 or as at 30 June 2020 as relevant.
2 Excludes any capital profits released.
RESULTS | FULL-YEAR RESULTS TO 30 JUNE 2021 82021 FINANCIAL PERFORMANCE
SIX MONTHLY
6 months 6 months 6 months
to Jun 2021 to Dec 2020 to Jun 2020
Total revenue ($m) 76.1 76.1 79.5
Management expense ratio1 (%) 0.63 0.64 0.64
Other expenses ($m) 4.3 4.3 4.6
Distributable amount ($m) 59.6 57.9 59.5
Property revaluation gains2 ($m) 62.1 87.1 15.1
Net profit including property revaluations ($m) 119.2 144.0 75.0
Number of units on issue3 (m) 642.4 642.4 642.4
Six months distribution (cents per unit) 9.27 9.02 9.27
Total assets3 ($m) 2,674.6 2,596.1 2,552.6
Borrowings3 ($m) 474.7 462.2 503.2
Weighted average cost of debt4 (pa) (%) 3.12 3.16 3.19
Net tangible assets3 ($ per unit) 3.29 3.20 3.06
Weighted average cap rate3 (%) 5.65 5.84 6.08
1 Expenses other than property outgoings and borrowing costs as a percentage of average total assets.
2 After adjustments made for the straight-lining of rent.
3 As at the respective period end rather than for six months to.
4 Finance costs divided by average borrowings for the six months.
RESULTS | FULL-YEAR RESULTS TO 30 JUNE 2021 92021 FINANCIAL PERFORMANCE
FIVE YEAR PERFORMANCE
FY2021 FY2020 FY2019 FY2018 FY2017
Revenue ($m) 152.2 155.8 156.3 153.4 152.5
Distributable profit1 ($m) 117.5 117.5 116.4 114.4 112.5
Total assets ($m) 2,674.6 2,552.6 2,382.3 2,369.5 2,312.8
Borrowings ($m) 474.7 503.2 412.7 457.6 471.1
Gearing (debt to total assets) (%) 17.7 19.7 17.3 19.3 20.4
Weighted average cost of debt2 (%) 3.1 3.4 4.3 4.6 4.6
Weighted average cap rate (%) 5.65 6.08 6.30 6.48 6.59
Management expense ratio3 (%) 0.63 0.64 0.62 0.60 0.60
Total ordinary distribution
18.29 18.29 18.11 17.81 17.51
(cents per unit)
1 Includes
any capital profits released relating to ordinary distributions (FY2021: $3.5 million; FY2020: $0.4 million; FY2019: $0.5 million;
FY2018: $1.2 million).
2 Finance costs divided by average borrowings.
3 Expenses other than property outgoings and borrowing costs as a percentage of average total assets.
RESULTS | FULL-YEAR RESULTS TO 30 JUNE 2021 10PORTFOLIO
PORTFOLIO | FULL-YEAR RESULTS TO 30 JUNE 2021 11BUNNINGS MARKET RENT REVIEW
OUTCOMES
Passing rent Reviewed rent Variance Effective
Property Location
($pa) ($pa) (%) date
> Annual like-for-like rental Wollongong, NSW1,2 1,469,571 1,405,000 (4.4) 9-Feb-18
growth across portfolio Villawood, NSW1,3 1,738,610 1,827,000 5.1 14-May-18
1.6 per cent Browns Plains, QLD2,4 1,791,153 1,793,000 0.1 7-May-19
Thornleigh, NSW3,5 1,420,291 1,420,291 - 6-Sep-19
> 13 Bunnings market rent
Maitland, NSW3,5 1,451,887 1,451,887 - 18-Oct-19
reviews were finalised Albany, WA2,5 904,854 790,000 (12.7) 1-Nov-19
during the year Bibra Lake, WA2,5 1,757,639 1,671,000 (4.9) 1-Nov-19
Noarlunga, SA2,5 1,581,718 1,650,000 4.3 1-Nov-19
Mornington, VIC2,5 1,760,103 1,800,000 2.3 13-Dec-19
Morayfield, QLD2,5 1,894,531 1,880,000 (0.8) 22-Mar-20
Mile End, SA2,5 2,504,634 2,542,845 1.5 23-Mar-20
Vermont South, VIC3 2,296,981 2,296,981 - 15-Aug-20
Northland, VIC3 2,029,869 2,029,869 - 19-Aug-20
Total 22,601,840 22,557,873 (0.2)
1 Market rent review was due during the year ended 30 June 2018, but the outcome was only finalised during
the current financial year
2 Market rent review was determined by an independent valuer
3 Market rent review was agreed between the parties
4 Market rent review was due during the year ended 30 June 2019, but the outcome was only finalised during
the current financial year
5 Market rent review was due during the year ended 30 June 2020, but the outcome was only finalised during
the current financial year
PORTFOLIO | FULL-YEAR RESULTS TO 30 JUNE 2021 12RENT REVIEWS
FY2021
> Two market rent reviews First-half Second-half
% of Rental
due during the 12 months Income1
to 30 June 2020 and 11 CPI 18 16 38
due during the 12 months Fixed 26 15 42
to 30 June 2021 are Market 10 6 20
being negotiated or Total 54 37 100
determined by 1 Based on portfolio rental as at 30 June 2021.
independent valuers and
remain unresolved
PORTFOLIO | FULL-YEAR RESULTS TO 30 JUNE 2021 13LIKE-FOR-LIKE RENTAL GROWTH
FY2021
Average increase
4%
Market 0.5%1
43% Fixed 3.0%
1.6%
like-for-like
rental growth
53%
CPI 0.5%
Year ended
2021 2020 2019 2018 2017 2016 2015 2014 2013 2012
30 June (%)
Rental growth2 1.6 2.13 2.3 2.5 2.1 2.4 2.9 4.0 2.1 4.0
CPI Growth4 0.5 1.6 2.0 2.0 1.4 1.6 2.5 2.3 1.7 3.4
1 All finalised market rent reviews relating to the year ending 30 June 2021.
2 Like-for-like rental growth compares the passing rent at the end of the period to the passing rent at the end of the previous corresponding period, but excludes any
properties acquired, divested, vacated, developed or upgraded during or since the previous corresponding period.
3 Amended from 2.4 per cent to take into account market rent reviews finalised post year end.
4 Reflects the annual average like-for-like growth resulting from CPI rent reviews completed during each period.
PORTFOLIO | FULL-YEAR RESULTS TO 30 JUNE 2021 14CAPITALISATION RATE TRENDS
> Four Bunnings Warehouse transactions in the last six months, the most recent on a
cap rate of 4.2 per cent
10.00%
9.00%
8.00%
7.00%
Bunnings Portfolio
Acquisitions by BWP
6.00%
5.00%
4.00%
3.00%
May- Dec- Jun- Dec- Jul- Jan- Jul- Feb- Aug- Feb- Sep- Mar- Sep- Apr- Oct- Apr- Nov- May- Nov- Jun- Dec- Jun-
10 10 11 11 12 13 13 14 14 15 15 16 16 17 17 18 18 19 19 20 20 21
New Bunnings Store Transactions BWP Portfolio Cap Rate
Secondary Market Bunnings Transactions Portfolio Transaction Average Cap Rate
PORTFOLIO | FULL-YEAR RESULTS TO 30 JUNE 2021 15REVALUATIONS
JUNE 2021
> June 2021 weighted average Revaluations
capitalisation rate 5.65 per cent No. of Rental Cap rate Value
by state
(Dec 2020: 5.84 per cent) properties $m/annum2 (%) ($m)
30 June 2021
– Eight independent valuations
(11 per cent of BWP portfolio value), NSW/ACT 18 36,592 5.65 633.6
average cap rate 5.76 per cent QLD 18 38,736 5.70 650.2
– 66 internal valuations average cap
rate 5.64 per cent SA 2 4,209 5.76 72.0
– Stand alone Bunnings Warehouses VIC 20 47,560 5.25 884.7
weighted average cap rate of WA 16 24,336 6.47 395.6
5.48 per cent
– Cap rate movement; 24 properties Total/weighted
74 151,434 5.65 2,636.1
decreased, 42 properties no change average
and eight properties increased 1 Gross movement in valuations; statutory accounts reflect a $149.2 million revaluation gain after
adjustments made for straight-lining of rent.
> FY2021 gross fair value gain of $150.91 2 Subject to rounding.
million on revaluation
– Rental growth and cap rate
compression equally contributed to
the net fair value gain during the
period
PORTFOLIO | FULL-YEAR RESULTS TO 30 JUNE 2021 16INDEPENDENT REVALUATIONS
JUNE 2021
Dec 2020 Dec 2020 Jun 2021 Jun 2021 Cap rate Valuation Jun 2021
Property State Cap Rate Valuation Cap Rate Valuation movement movement Term Certain
(%) ($m) (%) ($m) (%) ($m) (years)
Lismore NSW 5.50 26.7 5.50 26.5 - (0.2) 6.2
Wallsend NSW 5.50 40.4 5.00 45.5 (0.50) 5.1 2.9
Gladstone QLD 6.75 46.0 6.25 51.0 (0.50) 5.0 2.5
Southport QLD 5.75 27.9 5.50 29.4 (0.25) 1.5 2.4
Bayswater VIC 6.00 43.3 5.25 50.2 (0.75) 6.9 3.4
Balcatta WA 5.50 40.9 5.50 40.9 - - 2.2
Joondalup WA 7.25 16.2 7.75 15.0 (0.50) (1.2) 2.2
Mandurah WA 7.25 20.7 7.25 21.4 - 0.7 7.6
Total/ average1 6.07 262.1 5.76 279.9 (0.31) 17.8 3.3
1 Figures subject to rounding.
PORTFOLIO | FULL-YEAR RESULTS TO 30 JUNE 2021 17CORE PORTFOLIO
COR E P OR T FOLIO | F U LL- YEA R R E S U LT S T O 3 0 J U N E 2 0 2 1 18CORE PORTFOLIO
SUMMARY
64 4.4 years 3.3 ha
properties portfolio WALE average land area
71%
14,240 m2 84%
upgrade
average lettable metro located
properties or
area properties
occupiedWEIGHTED AVERAGE LEASE EXPIRY
PROFILE
30%
25%
20%
% of Rental Income
15%
10%
5%
0%
FY22 FY23 FY24 FY25 FY26 FY27 FY28 FY29 FY30 FY31 Beyond
Showrooms BWH >12 years occupancy BWHBUNNINGS LEASE EXPIRIES
NEXT THREE YEARS
Rent
Property Lease expiry Options Comments
($’000pa)
Geraldton Dec 2021 2 x 5 yrs 1,350 Notification required by Sep 2021
Mornington Dec 2021 2 x 5 yrs 1,812 Notification required by Sep 2021
Frankston Dec 2021 2 x 5 yrs 2,156 Notification required by Sep 2021
Gladstone Feb 2022 3 x 5 yrs 1,386 Notification required by Nov 2021
Greenacre Apr 2022 5 x 5 yrs 2,955 Notification required by Oct 2021
Craigieburn May 2022 5 x 5 yrs 1,827 Notification required by Nov 2021
Scoresby May 2022 2 x 5 yrs 2,008 Notification required by Feb 2022
Hervey Bay Dec 2022 1 x 5 yrs 1,356 Bunnings has obtained DA on adjoining site
Artarmon Feb 2023 3 x 5 yrs 1,710 Notification required by Nov 2022
Belrose Feb 2023 3 x 5 yrs 2,113 Notification required by Nov 2022
Wollongong Feb 2023 2 x 5 yrs 1,459 Notification required by Nov 2022
Balcatta Sep 2023 10 yrs 2,248 Notification required by Jun 2023
Southport Nov 2023 10 yrs 1,772 Notification required by Aug 2023
Tuggeranong Dec 2023 10 yrs 1,843 Notification required by Sep 2023
Cannon Hill Apr 2024 10 yrs 2,619 Notification required by Jan 2024
Bayswater Apr 2024 3 x 5 yrs 2,092 Notification required by Jan 2024
Wallsend May 2024 5 x 5 yrs 2,286 Notification required by Nov 2023
Browns Plains May 2024 - 1,848 Ongoing discussions with Bunnings
COR E P OR T FOLIO | F U LL- YEA R R E S U LT S T O 3 0 J U N E 2 0 2 1 21CROYDON
UPGRADE COMPLETED
> Upgrade cost of $4.0 million at a funding
rate of 5.5 per cent
> Fair value as at 30 June 2021,
$46.8 million, an increase of $8.7 million
from December 2020
> Upgrade increases the total retail area
by 2,190 square metres incorporating an
expansion of the timber trade sales and
nursery areas
> Completed in March 2021
> Bunnings has entered into a new
10 year lease with existing 10 year option
> Annual CPI reviews with a market rent
review on the exercise of the option
> No caps/collars on the market rent review
> No other changes to the existing lease
COR E P OR T FOLIO | F U LL- YEA R R E S U LT S T O 3 0 J U N E 2 0 2 1 22PORT MELBOURNE
UPGRADE COMPLETED
> Upgrade cost of $6.6 million at a funding rate
of 5.5 per cent
> Fair value as at 30 June 2021 $67.5 million,
an increase of $12.5 million from
December 2020
> Upgrade increases the total retail area by
2,303 square metres incorporating an
expansion of the main store and the timber
trade sales areas
> Completion in June 2021
> Bunnings has entered into a new 10 year
lease with existing 2 x 5 year options
> Annual CPI reviews with a market rent review
on the exercise of each option
> 10 per cent cap, 5 per cent collar per existing
lease to remain on the market rent reviews
> No other changes to the existing lease
COR E P OR T FOLIO | F U LL- YEA R R E S U LT S T O 3 0 J U N E 2 0 2 1 23DIVESTMENTS
COR E P OR T FOLIO | F U LL- YEA R R E S U LT S T O 3 0 J U N E 2 0 2 1 24UNDERWOOD, QLD
DIVESTMENT
> Sold to a private owner occupier following a public expressions of interest campaign – settled
May 2021
> Strong returns achieved as a Bunnings Warehouse (refer table below)
> Bunnings relocated to a nearby site in 2018
> Pursued a number of re-development options, including for retail, large format retail,
medical, self-storage, industrial and last mile logistics – divestment yielded the best outcome
Outcome
Purchase date October 1998
Purchase price $9.1 million
Additional capital invested $0.5 million
Total invested capital $9.6 million
Total rent received $24.4 million1
Average annual rent growth since inception 3.3% (CAGR)
Sale price $16.0 million
1 Excludes $1.7 million in forfeited deposit relating to a previous divestment that did not
proceed.
DIVESTMENTS| FULL-YEAR RESULTS TO 30 JUNE 2021 25MINDARIE, WA
DIVESTMENT
> Sold to Fabcot for Woolworths anchored shopping centre – settled July 2021
> Strong returns achieved as a Bunnings Warehouse (refer table below)
> Bunnings relocated to a nearby site in 2014 and has paid rent up until settlement in
July 2021
> Pursued a number of redevelopment options, including for retail, large format retail, medical,
self-storage, industrial and last mile logistics – divestment yielded the best outcome
Outcome
Purchase date September 2001
Purchase price $9.8 million
Additional capital invested $0.6 million
Total invested capital $10.4 million
Total rent received $27.4 million
Average annual rent growth since inception 3.3% (CAGR)
Sale price $14.5 million
DIVESTMENTS| FULL-YEAR RESULTS TO 30 JUNE 2021 26ALTERNATIVE USE PROPERTIES
A LT E R N AT IVE U S E P R O P ERT I ES| F U LL- YEAR R E S ULT S T O 3 0 J U N E 2 0 2 1
27ALTERNATIVE USE PROPERTIES
UPDATE
Property Lease expiry1 Comments
Non-binding agreement entered into for use as a film studio; finalising development options on
Cairns Expired
surplus land
Morley Expired Leasing campaign underway for lifestyle/leisure redevelopment
Site leased for up to two years for mass vaccination hub; property recently rezoned to allow for
Belmont North Expired
a supermarket and other retail shops, we expect to lodge a development application in FY2022
Port Kennedy Expired Leasing campaign underway for large format retail redevelopment
Midland Sep 2021 Site re-leased to car dealership commencing immediately after Bunnings lease expiry
Hervey Bay Dec 2022 Leasing campaign underway for large format retail redevelopment
Albany Oct 2024 Considering redevelopment/divestment options
Northland Aug 2025 Considering redevelopment/rezoning options
Wagga Wagga Mar 2026 Considering redevelopment options
1 End of the current Bunnings lease term.
A LT E R N AT IVE U S E P R O P ERT I ES | F U LL- YEA R R E S ULT S T O 3 0 J U N E 2 0 2 1 28CAPITAL MANAGEMENT
CA P I T A L M A N A GEMEN T | F U LL- Y EAR R E S U LT S T O 3 0 J U N E 2 0 2 1 29DEBT FACILITIES
> Average borrowings for the year $477.1 million (up 3.3 per cent on prior corresponding period)
– 3.1 per cent per annum weighted average cost of debt after hedging (2020: 3.4 per cent per annum)
– Borrowing costs for the year $15.0 million (down 3.6 per cent on prior corresponding period)
> Bank facilities with CBA and WBC can be extended a further year each year, subject to agreement. Both the CBA and WBC
facilities were extended for a further year during the reporting period
> A new seven-year $100 million bond issued in March 2021
> Sumitomo Mitsui Banking Corporation (“SMBC”) debt facility was restructured, with facility limit increased from $100 million
to $110 million, with the facility now a five-year forward start facility. Restructure was completed to refinance the MTN
maturing in May 2022
> Interest cover: 8.8 times at 30 June 2021 (2020: 8.6 times)
> Gearing 17.7 per cent at 30 June 2021 (2020: 19.7 per cent)
> A- / Stable S&P rating and A3 Moody’s rating
As at 30 June 2021 Limit ($m) Drawn ($m) Expiry
CBA 110 56 31 July 2023
WBC 135 55 30 April 2023
Corporate bonds – five-year 110 110 11 May 2022
Corporate bonds – seven-year 150 150 10 April 2026
Corporate bonds – seven-year 100 100 24 March 2028
Total/weighted average 605 471 3.2 years
CA P I T A L M A N A GEMEN T | F U LL- Y EAR R E S U LT S T O 3 0 J U N E 2 0 2 1 30DEBT DURATION
REFINANCED DEBT MATURITY PROFILE
> The graph below shows the debt profile for the Trust, on the basis of the delayed start
SMBC facility (see previous slide) being drawn down to repay the $110 million MTN
maturing in May 2022
200
Volume (A$M)
150.0
79.5
100 54.4 110.0
100.0
55.5 55.6
0
FY FY FY FY FY FY FY
22 23 24 25 26 27 28
Bonds Drawn bank facilities Undrawn bank facilities
CA P I T A L M A N A GEMEN T | F U LL- Y EAR R E S U LT S T O 3 0 J U N E 2 0 2 1 31INTEREST RATE HEDGING
Hedge book profile by
Jun 2021 Dec 2021 Jun 2022
half-year ending
Active swaps ($m) 70 40 -
Swap rates (%) Maximum 2.60 2.60 -
Minimum 2.39 2.60 -
Weighted average1 2.51 2.60 -
> Including fixed rate corporate bonds:
– $430 million hedged at 1.462 per cent weighted average to maturity, at 30 June 2021
– As at 30 June 2021, the Trust’s hedging cover was 91.3 per cent, with a weighted average
term to maturity of 3.5 years
1 Weighted average of active swaps at respective half-year end.
2 Excludes margins payable on the fixed corporate bonds.
CA P I T A L M A N A GEMEN T | F U LL- Y EAR R E S U LT S T O 3 0 J U N E 2 0 2 1 32OUTLOOK
OUTLOOK | FULL-YEAR RESULTS TO 30 JUNE 2021 33OUTLOOK
Operating environment Portfolio
> The Trust remains well positioned operationally > Primary focus for the remainder of the financial
with the significant majority of rental income from year is on leasing vacancies in the portfolio,
Bunnings and other national large format retailers progressing store upgrades, and extending existing
which have been trading well leases with Bunnings through the exercise of
options
> Demand for Bunnings Warehouse properties is
expected to remain relatively stable in near term > The Trust will continue to look for opportunities to
given the ongoing low interest rate environment grow the portfolio that create value for the Trust
and strength of the Bunnings covenant attracting
strong investor support FY2022 distribution
Rental growth > Subject to there being no major COVID-19 or other
disruption of the Australian economy, the Trust
> 49 CPI/ 48 fixed rent reviews in FY2022 could expect the distribution for the year ending
> Eight Bunnings MRR’s to be finalised in FY2022 30 June 2022 to be similar to the ordinary
(in addition to 13 unresolved from FY2021) distribution paid for the year ended 30 June 2021.
Capital profits may be utilised to support the
distribution
OUTLOOK | FULL-YEAR RESULTS TO 30 JUNE 2021 34QUESTIONS?
QUESTIONS | FULL-YEAR RESULTS TO 30 JUNE 2021 35FURTHER INFORMATION
Responsible entity:
BWP Management Limited
Tel: +61 8 9327 4356
Email: investorrelations@bwptrust.com.au
FURTHER INFORMATION | FULL-YEAR RESULTS TO 30 JUNE 2021 36You can also read