FULL-YEAR RESULTS TO 30 JUNE 2020 - August 2020 - Bell Direct
←
→
Page content transcription
If your browser does not render page correctly, please read the page content below
FULL-YEAR RESULTS
TO 30 JUNE 2020
August 2020
I M P O RTA N T
NOTICE
The information provided in this presentation should be considered together with the
financial statements for the period and previous periods, ASX announcements and other
information available on the Trust’s website.
This presentation has been prepared by BWP Management Limited as the responsible
entity for BWP Trust. The information provided is for information purposes only and does
not constitute an offer to arrange to issue securities or other financial products, nor is it
intended to constitute legal, tax or accounting advice or opinion. The information
contained in this presentation is not investment or financial product advice and is not
intended to be used as the basis for making an investment decision. This presentation
has been prepared without taking into account the investment objectives, financial
situation or particular needs of any particular person.
All reasonable care has been taken in preparing the information contained in this
presentation, however no representation or warranty, express or implied, is made as to
the fairness, accuracy, completeness or correctness of the information, opinions and
conclusions contained in this presentation. Without limiting the preceding sentence, no
representation or warranty, express or implied, is given as to the accuracy, completeness,
likelihood of achievement or reasonableness of any forward-looking statements, forecasts,
prospects or returns contained in this presentation. Such forward-looking statements,
forecasts, prospects or returns are by their nature subject to significant uncertainties and
contingencies, many of which will be outside the control of BWP Trust or BWP
Management Limited. Also, past performance is no guarantee of future performance.
Before making an investment decision, you should conduct your own due diligence and
consult with your own legal, tax or accounting adviser as to the accuracy and application
of the information provided in this presentation and in respect of your particular
investment needs, objectives and financial circumstances.

FULL-YEAR RESULTS TO 30 JUNE 2020                                                               2
P R E S E N TAT I O N O U T L I N E

Michael Wedgwood                      > Summary
Managing Director
BWP Management Limited                > Results

Andrew Ross                           > Portfolio
Head of Property
BWP Management Limited                > Core portfolio

David Hawkins                         > Alternative use properties
Finance Manager
BWP Management Limited                > Capital management

                                      > Outlook

FULL-YEAR RESULTS TO 30 JUNE 2020                                    3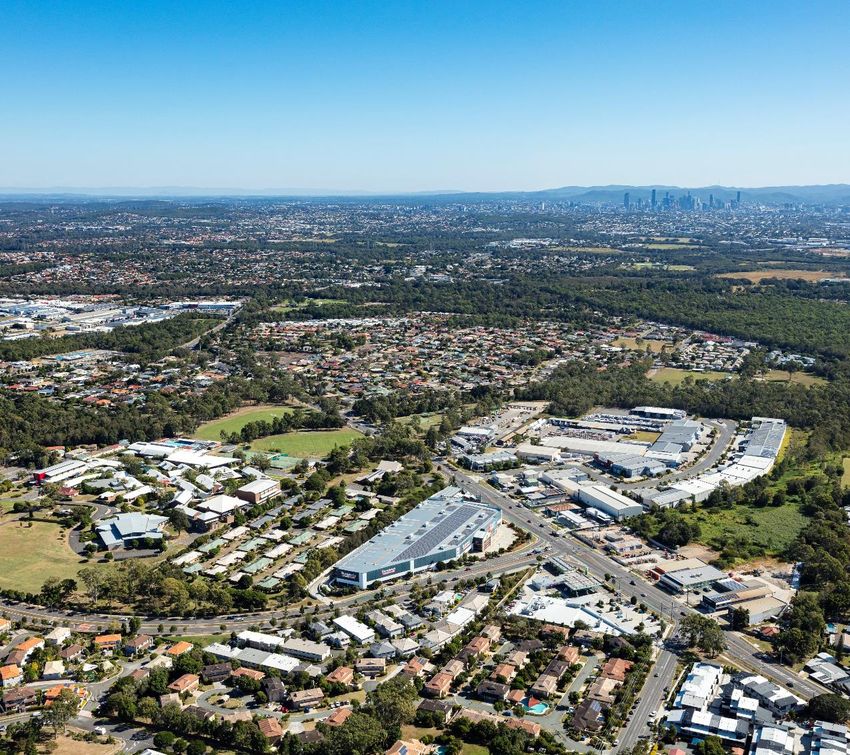
SUMMARY

                                               Mile End, SA

SUMMAR Y | FULL-YEAR RESULTS TO 30 JUNE 2020       4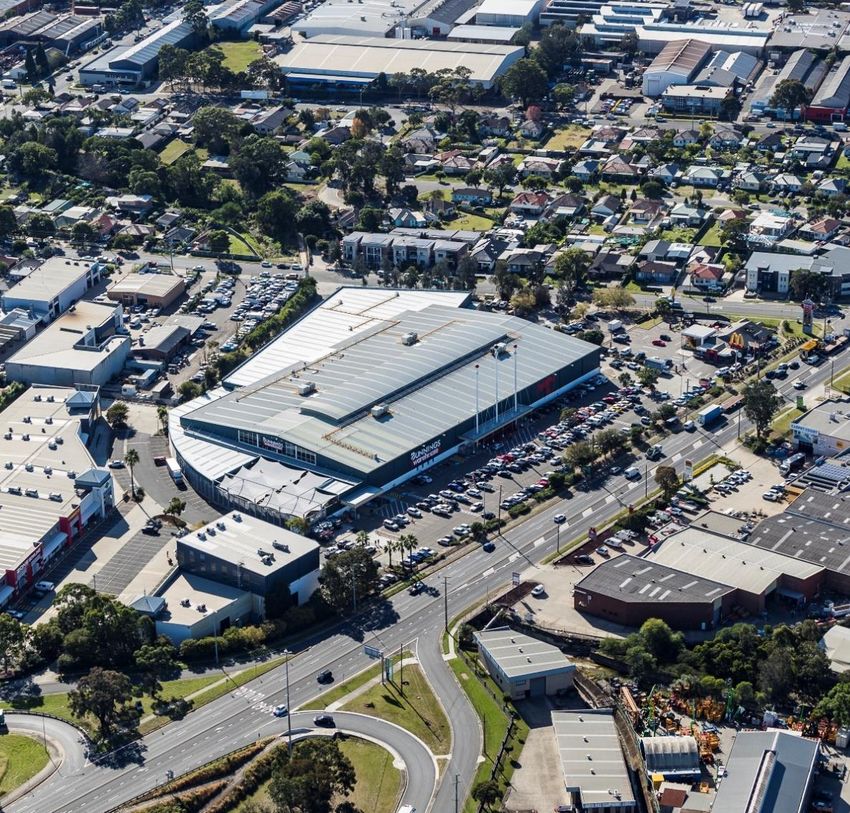
2 0 2 0 F U L L-Y E A R R E S U LT S AT A G L A N C E

                 $155.8m                       $117.4m ⇧                     $18.29cpu ⇧                      $3.06 ⇧                14.0% pa
              Total revenue 0.3%1              Dist. Profit 1.0%1,2          Ordinary dist.1.0%1,2            NTA 4.8%1              10 yr total return

                      PORTFOLIO                                              PORTFOLIO                                      CAPITAL
                     PERFORMANCE                                            MANAGEMENT                                    MANAGEMENT

                                                                      Construction work completed for the                   A- S&P rating/
                              2.4%                                    re-positioning of the Hoxton Park and                A3 Moody’s rating
                     like-for-like rental growth                            Port Macquarie properties

                                                                        One Bunnings Warehouse upgrade
                       $93.6 million3                                  completed, terms agreed for 3 more                      19.7%
                     portfolio revaluation uplift                        Bunnings Warehouse upgrades                             gearing

                                                                                                                     $110m bank facility extended by
                             6.08%                                                    5                                  a further two years and
                          portfolio cap rate                                 Bunnings Warehouse                        additional $50m MTN issued
                                                                              options exercised

                             4 years                                               98.0%                                        3.0%
                           portfolio WALE                                                                             cost of debt at 30 June 2020
                                                                                    leased

         1   In comparison to prior corresponding period.
         2   Excludes special distribution paid in 2019, including amount released from capital profits for the special distribution.
         3   Gross movements in valuations a $96.7 million revaluation gain before adjustments made for straight-lining of rent.

SUMMAR Y | FULL-YEAR RESULTS TO 30 JUNE 2020                                                                                                              5
C O V I D - 1 9 I M PA C T TO 3 0 J U N E 2 0 2 0

> 98.8 per cent of rent                                       > Bunnings and the significant majority of other
  received during March to                                      tenants have been able to operate on an
  June 2020                                                     unrestricted basis from the Trust’s properties
                                                              > Bunnings reported 11.3 per cent year to date (to
> Rent abatement totalling
                                                                May 2020) total sales growth, comprising 5.8 per
  $435,886 provided to
                                                                cent growth in the first half of the year, and 19.2
  Code of Conduct tenants
                                                                per cent growth in the second half of the year to
  during the period ended
                                                                May 2020 1
  30 June 2020
                                                              > A small number of tenants such as gym operators
                                                                were subject to COVID-19 mandatory closure by
                                                                Federal and/or State Governments for some, or all
                                                                of March, April, May and June this year
                                                              > Rent abatements were granted in accordance with
                                                                the relevant Code of Conduction legislation

  1   Source: Wesfarmers Retail trading update, 9 June 2020, page 1.

SUMMAR Y | FULL-YEAR RESULTS TO 30 JUNE 2020                                                                          6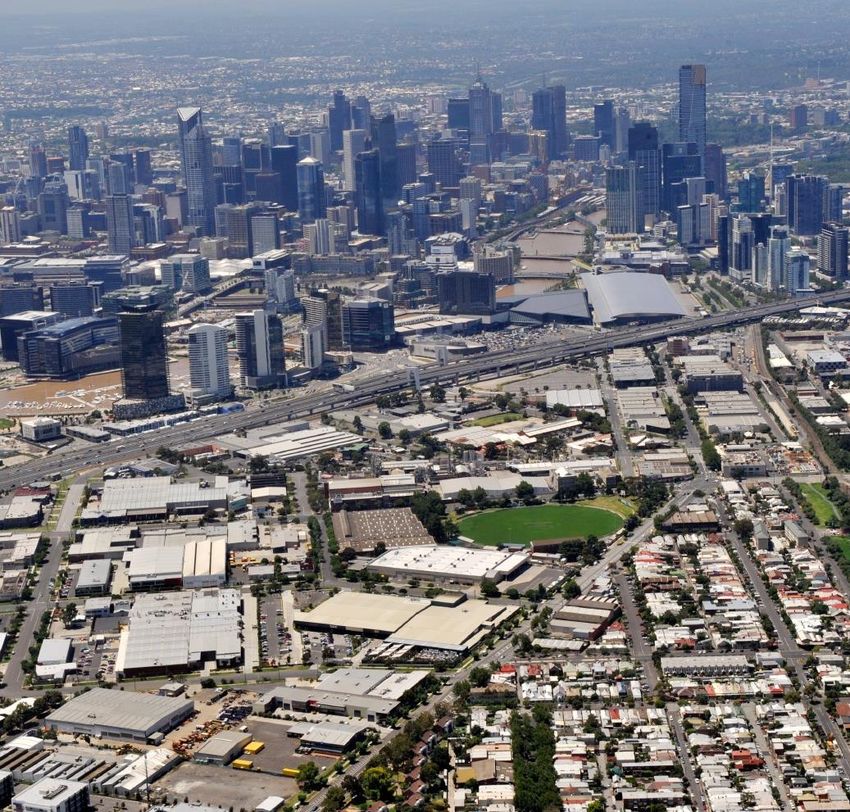
C L I M AT E R I S K A N D
S U S TA I N A B I L I T Y
ACTIONS
> 89 per cent of the Trust’s properties
  have LED lighting in one or more of the
  car park, nursery trading area, canopy
  trading area, or in the main store
> 19 properties in portfolio have solar
  power generation installed
> 92 per cent of the properties in
  portfolio have in place water tanks for
  the recycling of roof collected rainwater
> Tesla battery installed at Mandurah
  property to store excess energy from
  the solar installation at that location
> Climate risk assessment undertaken for
  each property in the portfolio annually
> Progressing with the implementation of
  relevant Task Force on Climate-related
  Financial Disclosure recommendations,
  with the current focus on climate risk
  scenario modelling

                                               Manly West, QLD

SUMMAR Y | FULL-YEAR RESULTS TO 30 JUNE 2020                     7
R E S U LT S

                                               Villawood, NSW

R ESULTS | FULL-YEAR RESULTS TO 30 JUNE 2020          8
FINANCIAL PERFORMANCE VS PCP1
                                                                                                   FY20                                            PCP
Total revenue                                                                                   $155.8m                                       $156.3m

Management expense ratio                                                                           0.64%                                         0.62%

Other expenses                                                                                     $8.8m                                         $7.3m

Distributable profit2 (excluding revaluations)                                                  $117.1m                                       $115.9m

Number of units on issue                                                                         642.4m                                        642.4m

Full-year ordinary distribution per unit                                                    18.29 cents                                   18.11 cents

Special distribution per unit3                                                                             -                                1.56 cents

Total assets                                                                                 $2,552.6m                                     $2,382.3m

Borrowings                                                                                     $503.2 m                                       $412.7m

Net tangible assets per unit                                                                        $3.06                                         $2.92

Gearing (debt to total assets)                                                                     19.7%                                         17.3%
1   pcp: prior corresponding period, being the 12 months ended 30 June 2019 or as at 30 June 2019 as relevant.
2   Excludes any capital profits released.
3   Following the divestment of four properties during the year ended 30 June 2019, a special distribution was declared with the release of $10.0 million of
    capital profits.

R ESULTS | FULL-YEAR RESULTS TO 30 JUNE 2020                                                                                                                   9
FINANCIAL PERFORMANCE
6 M O N T H LY
                                                                        6 months                     6 months                 6 months
                                                                     to Jun 2020                  to Dec 2019              to Jun 2019
    Total revenue                                                               $79.5m                    $76.2m                     $77.3m
    Management expense ratio1                                                    0.64%                     0.63%                      0.62%
    Other expenses                                                                $4.6m                    $4.2m                       $3.8m
    Distributable amount2                                                       $59.5m                    $57.9m                     $59.0m
    Property revaluation gains                                                 $15.1m3                   $78.5m3                    $33.3m3
    Net profit including property revaluations                                  $75.0m                   $135.6m                     $90.5m
    Number of units on issue4                                                   642.4m                    642.4m                     642.4m
    Six months distribution2 (per unit)                                     9.27 cents                  9.02 cents                9.18 cents
    Total assets4                                                           $2,552.6m                   $2,487.1m                $2,382.3m
    Borrowings4                                                               $503.2m                    $447.0m                    $412.7m
    Weighted average cost of debt5 (p.a.)                                        3.19%                     3.53%                     $4.24%
    Net tangible assets4 (per unit)                                               $3.06                     $3.04                       $2.92
    Weighted average cap rate4                                                   6.08%                     6.08%                      6.30%
1 Expenses other than property outgoings and borrowing costs as a percentage of average total assets.          *figures above subject to rounding
2 Excludes special distribution paid in the year ended 30 June 2019.
3 After adjustments made for the straight-lining of rent.
4 As at the respective period end rather than for six months to.
5 Finance costs divided by average borrowings for the six months.

R ESULTS | FULL-YEAR RESULTS TO 30 JUNE 2020                                                                                                        10
FINANCIAL SUMMARY
5 YEAR PERFORMANCE
FY2020 FY2019 FY2018 FY2017 FY2016
Revenue $155.8m $156.3m $153.4m $152.5m $150.2m
Distributable profit1 $117.5m $116.4m $114.4m $112.5m $107.9m
Total assets $2,552.6m $2,382.3m $2,369.5m $2,312.8m $2,200.5m
Borrowings $503.2m $412.7m $457.6m $471.1m $472.3m
Gearing (debt to total assets) 19.7% 17.3% 19.3% 20.4% 21.5%
Weighted average cost of debt2 3.4% 4.3% 4.6% 4.6% 5.0%
Weighted average cap rate 6.08% 6.30% 6.48% 6.59% 6.77%
Management expense ratio3 0.64% 0.62% 0.60% 0.60% 0.64%
Total ordinary distribution
18.29 cents 18.11 cents 17.81 cents 17.51 cents 16.79 cents
per unit
1 Includes any capital profits released relating to ordinary distributions (FY2020: $0.4 million, FY2019: $0.5 million; FY2018: $1.2 million).
2 Finance costs divided by average borrowings.
3 Expenses other than property outgoings and borrowing costs as a percentage of average total assets.
R ESULTS | FULL-YEAR RESULTS TO 30 JUNE 2020 11P O RT F O L I O
North Lakes, QLD
POR TFOLIO | FULL-YEAR RESULTS TO 30 JUNE 2020 12BUNNINGS MARKET RENT REVIEW
OUTCOMES
> Seven Bunnings Passing rent Reviewed Effective Variance
Property Location
($pa) rent ($pa) date (%)
market rent
Belrose, NSW1,2 2,111,952 2,035,000 9-Feb-18 (3.6)
reviews were 2,3
Balcatta, WA 2,336,761 2,220,000 23-Sep-18
resolved during (5.0)
3,4
the year Coburg, VIC 1,531,347 1,684,481 3-Nov-18 10.0
2,3
Tuggeranong, ACT 1,847,740 1,800,000 1-Dec-18 (2.6)
2,3
Cannon Hill, QLD 2,548,846 2,550,000 1-Apr-19 0.0
2,3
Bayswater, VIC 1,950,248 2,025,000 21-Apr-19 3.8
5
Port Melbourne, VIC 2,159,917 2,311,111 17-Mar-20 7.0
Total/ Weighted Average 14,486,811 14,625,592 1.0
1The market rent review was due during the year ended 30 June 2018, but the outcome was only finalized
during the current financial year.
2 The market rent review was determined by an independent valuer.
3The market rent review was due during the year ended 30 June 2019, but the outcome was only finalised
during the current financial year.
4 The market rent review was agreed between the parties at the 10 per cent cap in the lease.
5 The market rent review was agreed between the parties.
POR TFOLIO | FULL-YEAR RESULTS TO 30 JUNE 2020 13FY2020 RENT REVIEWS
First-half Second-half % of Rental Income3
CPI 25 16 49
Fixed 22 24 49
Market 2 1 2
Total 49 41 100
Two Bunnings market rent reviews from FY20181, one market rent review from
FY20192 and 10 market rent reviews due during the 12 months to 30 June 2020
are being negotiated or determined by independent valuers and remain unresolved
1 Wollongong (NSW) and Villawood (NSW).
2 Browns Plains (QLD).
3 Based on portfolio rental as at 30 June 2020.
POR TFOLIO | FULL-YEAR RESULTS TO 30 JUNE 2020 14F Y 2 0 2 0 L I K E - F O R- L I K E
R E N TA L G R O W T H
Average increase
2%
Market 5.8%1
49% Fixed 3.0%
2.4%
like-for-like
rental growth
49% 1.6%
CPI
Year ended
2020 2019 2018 2017 2016 2015 2014 2013 2012 2011
30 June (%)
Rental growth2 2.4 2.3 2.53 2.1 2.4 2.9 4.0 2.1 4.0 3.4
CPI Growth5 1.6 2.04 2.0 1.4 1.6 2.5 2.3 1.7 3.4 2.9
1 All finalised market rent reviews relating to the year ending 30 June 2020.
2 Like-for-like rental growth compares the passing rent at the end of the period to the passing rent at the end of the previous corresponding period, but
excludes any properties acquired, divested, vacated, developed or upgraded during or since the previous corresponding period.
3 Amended from 2.4 per cent to take into account market rent reviews finalised post year end.
4 Amended from 1.9 per cent to take into account CPI rent reviews finalised post year end.
5 Reflects the annual average like-for-like growth resulting from CPI rent reviews completed during each period.
POR TFOLIO | FULL-YEAR RESULTS TO 30 JUNE 2020 15C A P I TA L I S AT I O N R AT E T R E N D S > One Bunnings Warehouse transaction in the last 6 months POR TFOLIO | FULL-YEAR RESULTS TO 30 JUNE 2020 16
J U N E 2 0 2 0 R E VA L U AT I O N S
> June 2020 weighted average capitalisation rate 6.08 per cent (Dec 2019: 6.08 per cent)
  – 14 independent valuations (19 per cent of BWP portfolio value), average cap rate 6.00 per cent
  – 61 internal valuations, average cap rate 6.09 per cent
  – Stand alone Bunnings Warehouses weighted average cap rate of 5.90 per cent
  – Cap rate movement; 3 properties decreased, 67 properties no change and 5 properties increased
> FY2020 gross fair value gain of $96.71 million on revaluation
  – Rental growth largely contributed to the net fair value gain during the period after the portfolio
      average cap rate decreased by 22 bps

Revaluations by state                                    No. of                     Rental                      Cap rate                        Value
30 June 2020                                           properties                 $m/annum2                       (%)                           ($m)
NSW/ACT                                                      18                        34,632                       6.12                            583.2
QLD                                                          19                         38,092                      6.07                            625.1
SA                                                            2                         4,087                       5.93                             68.8
VIC                                                          20                        47,346                       5.64                            808.4
WA                                                           16                        27,201                       6.92                            398.7
Total/weighted average                                       75                      151,358                       6.08                        2,484.2

1   Gross movement in valuations; statutory accounts reflect a $93.6 million revaluation gain after adjustments made for straight-lining of rent.
2   Subject to rounding.

POR TFOLIO | FULL-YEAR RESULTS TO 30 JUNE 2020                                                                                                              17
J U N E 2 0 2 0 I N D E P E N D E N T R E VA L U AT I O N S
Dec 2019 Dec 2019 Jun 2020 Jun 2020 Valuation Jun 2020
Cap rate
Property State Cap Rate Valuation Cap Rate Valuation movement Term Certain
movement
(%) ($m) (%) ($m) ($m) (years)
Australind WA 6.00 23.4 6.00 24.2 0.00 0.8 7.0
Brendale QLD 5.50 38.4 5.50 38.4 0.00 0.0 6.5
Craigieburn VIC 6.00 28.7 5.75 30.8 (0.25) 2.1 1.9
Fountain Gate VIC 5.75 30.6 5.75 30.6 0.00 0.0 4.6
Hervey Bay QLD 7.50 16.8 7.50 16.8 0.00 0.0 2.5
Hoxton Park NSW 7.00 58.3 6.75 58.5 (0.25) 0.2 10.2
Maribyrnong VIC 5.00 57.2 4.75 62.0 (0.25) 4.8 6.6
Mentone VIC 5.50 30.4 5.50 32.5 0.00 2.1 9.6
Mile End SA 5.75 43.6 5.75 43.5 0.00 (0.1) 4.7
Mindarie WA 9.58 18.1 11.48 15.1 1.90 (3.0) 1.2
Morayfield QLD 5.75 30.7 5.75 30.5 0.00 (0.2) 4.7
Noarlunga SA 6.25 25.3 6.25 25.3 0.00 0.0 4.3
Villawood NSW 5.50 35.0 5.50 35.0 0.00 0.0 6.9
Wollongong NSW 6.25 23.5 6.25 23.5 0.00 0.0 2.6
Total/ average1 6.05 460.0 6.00 466.7 (0.05) 6.7 5.7
1 Figures subject to rounding.
POR TFOLIO | FULL-YEAR RESULTS TO 30 JUNE 2020 18CORE
P O RT F O L I O
Artarmon, NSW
COR E POR TFOLIO | FULL-YEAR RESULTS TO 30 JUNE 2020 19C O R E P O RT F O L I O
SUMMARY
68 4.1 years
properties portfolio WALE
3.3 ha 14,054m2
average land average lettable
area area
76%
82%
upgrade
metro located
properties or
properties
occupiedW E I G H T E D AV E R A G E L E A S E E X P I R Y
PROFILE
25%
20%
15%
% of Rental Income
10%
5%
0%
FY21 FY22 FY23 FY24 FY25 FY26 FY27 FY28 FY29 FY30 Beyond
Showrooms BWH >12 years occupancy BWHLEASE EXPIRIES NEXT THREE YEARS
> Five year options exercised for Fountain Gate (VIC), Port Melbourne (VIC), Northland (VIC), Vermont South (VIC),
Coburg (VIC) during year
> Hawthorn (VIC) option exercised post year-end
Lease Rent
Property Options Comments
expiry ($’000pa)
Mt Gravatt Dec 2020 4 x 5 yrs 1,407 Notification required by Sep 2020
Broadmeadows Jan 2021 10 yrs 2,041 Notification required by Oct 2020
Properties acquired in 2011 portfolio transaction - Belmont,
Mar –
2011 Portfolio 5 x 5 yrs 16,653 Cockburn, Fairfield Waters, Pakenham, Wagga Wagga, Port
Oct 2021
Kennedy, Smithfield, Dubbo, Harrisdale and Caroline Springs
Geraldton Dec 2021 2 x 5 yrs 1,341 Notification required by Sep 2021
Mornington Dec 2021 2 x 5 yrs 1,760 Notification required by Sep 2021
Frankston Dec 2021 2 x 5 yrs 2,156 Notification required by Sep 2021
Gladstone Feb 2022 3 x 5 yrs 1,378 Notification required by Nov 2021
Greenacre Apr 2022 5 x 5 yrs 2,869 Notification required by Oct 2021
Craigieburn May 2022 5 x 5 yrs 1,773 Notification required by Nov 2021
Scoresby May 2022 2 x 5 yrs 1,986 Notification required by Feb 2022
Hervey Bay Dec 2022 1 x 5 yrs 1,347 Notification required by Sep 2022
Artarmon Feb 2023 3 x 5 yrs 1,705 Notification required by Nov 2022
Belrose Feb 2023 3 x 5 yrs 2,107 Notification required by Nov 2022
Wollongong Feb 2023 2 x 5 yrs 1,405 Notification required by Nov 2022
COR E POR TFOLIO | FULL-YEAR RESULTS TO 30 JUNE 2020 22V I L L AW O O D U P G R A D E COMPLETED > Upgrade cost of $5.0 million at a funding rate of 3.7 per cent (specified formula in lease) > Upgrade increases the total retail area by 1,792 square metres incorporating an expansion the timber trade sales and nursery areas > Completed in November 2019 > Bunnings has entered into a new seven lease with existing 4 x 5 year options > Annual fixed three per cent reviews with a market rent review on the exercise of each option > 10 per cent cap/collar on market rent reviews > No other changes to the existing lease COR E POR TFOLIO | FULL-YEAR RESULTS TO 30 JUNE 2020 23
P O RT M E L B O U R N E
UPGRADE

> Upgrade cost of $6.6 million at a funding rate
  of 5.5 per cent

> Upgrade increases the total retail area by 2,303
  square metres incorporating an expansion of
  the main store and the timber trade sales
  areas

> Anticipate completion mid-2021

> On completion of the works Bunnings will enter
  into a new 10 year lease with existing 2 x 5
  year options to remain (current term certain
  4.7 years)

> Annual CPI reviews with a market rent review
  on the exercise of each option

> 10 per cent cap, 5 per cent collar per existing
  lease to remain on the market rent reviews

> No other changes to the existing lease

COR E POR TFOLIO | FULL-YEAR RESULTS TO 30 JUNE 2020   24
A LT E R N AT I V E
U S E P R O P E RT I E S

                                                                   Hoxton Park, NSW

ALTER NATIVE USE PR OPERTIES | FULL-YEAR RESULTS TO 30 JUNE 2020          25
A LT E R N AT I V E U S E P R O P E RT I E S U P D AT E
Property Lease expiry1 Comments
Concept and feasibility finalised for multi-tenanted industrial development;
Cairns Expired
re-leasing campaign re-launched
Morley Expired Various options being considered for re-positioning
Underwood Expired Considering redevelopment/divestment options
Belmont North Mar 2021 Considering redevelopment/divestment options
Midland Sep 2021 Various options being considered for re-positioning
Scheme amendment and structure plan approved in 2019 to allow mixed use
Mindarie Sep 2021 development of the site which adjoins Ocean Keys sub-regional shopping
centre; considering redevelopment/divestment options
Considering redevelopment/divestment options
Albany Oct 2024
1 End of the current Bunnings lease term.
ALTERNATIVE USE PROPERTIES | FULL-YEAR RESULTS TO 30 JUNE 2020 26C A P I TA L
MANAGEMENT
Greenacre, NSW
CAPITAL MANAGEMENT | FULL-YEAR R ESULTS TO 30 JUNE 2020 27D E B T FA C I L I T I E S > Average borrowings for the year $461.9 million (up 0.8 per cent on prior corresponding period) – 3.4 per cent per annum weighted average cost of debt after hedging (2019: 4.3 per cent per annum) – Borrowing costs for the year $15.5 million (down 20.7 per cent on prior corresponding period) > Bank facilities with CBA and WBC can be extended a further year each year, subject to agreement. The CBA facility was extended for a further two years during the year > Additional $50 million raised on the April 2026 bonds to provide more liquidity during COVID-19 > Cost of debt at 30 June 2020: 3.0 per cent per annum > Interest cover: 8.6 times at 30 June 2020 (2019: 6.8 times) > Gearing 19.7 per cent at 30 June 2020 (2019: 17.3 per cent) > A- / Stable S&P rating and A3 Moody’s rating As at 30 June 2020 Limit ($m) Drawn ($m) Expiry CBA 110 69 31 Jul 2022 WBC 135 71 30 Apr 2022 SMBC 100 100 20 May 2024 Corporate bonds- five year 110 110 11 May 2022 Corporate bonds- seven year 150 150 10 April 2026 Total/weighted average 605 500 3.2 years CAPITAL MANAGEMENT | FULL-YEAR R ESULTS TO 30 JUNE 2020 28
D E B T D U R AT I O N

                                Debt maturity profile as at 30 June 2020
    Volume (A$M)

                   300.0

                                        63.9
                   200.0

                                        71.1

                                                                                                      150.0

                   100.0               110.0              41.5
                                                                          100.0

                                                          68.5

                     0.0
                           FY            FY                FY               FY                   FY    FY
                           21            22                23               24                   25    26

                                      Bonds    Drawn bank facilities   Undrawn bank facilities

CAPITAL MANAGEMENT | FULL-YEAR R ESULTS TO 30 JUNE 2020                                                       29
I N T E R E S T R AT E H E D G I N G
Hedge book profile by
Jun 2020 Dec 2020 Jun 2021 Dec 2021 Jun 2022
half-year ending
Active swaps ($m) 85 85 70 40 -
Swap rates (%) Maximum 4.12 4.12 2.60 2.60 -
Minimum 2.39 2.39 2.39 2.60 -
Weighted average1 2.79 2.79 2.51 2.60 -
> Including fixed rate corporate bonds:
– $345.0 million hedged at 1.802 per cent weighted average to maturity, at 30 June 2020
1 Weighted average of active swaps at respective half-year end.
2 Excludes margins payable on the fixed corporate bonds.
CAPITAL MANAGEMENT | FULL-YEAR R ESULTS TO 30 JUNE 2020 30OUTLOOK
Rydalmere, NSW
OUTLOOK | FULL-YEAR RESULTS TO 30 JUNE 2020 31OUTLOOK
Macro economic environment Investment
> Continuing COVID-19 outbreaks may require > Primary focus on leasing vacancies in the
further rent abatements and/or deferments for portfolio, progressing store upgrades, and
some Code of Conduct tenants extending existing leases with Bunnings
through the exercise of options
> Demand for Bunnings Warehouse properties is
expected to remain relatively stable in near > Further improving the energy efficiency of the
term given the strength of the Bunnings Trust’s properties through the continued rollout
covenant of LED lighting in stores, and roof top solar
installations
> The Trust is well positioned in the current
economic environment with low gearing, FY2021 distribution
sufficient liquidity and sustainable cashflow > The Trust could expect the distribution for the
year ending 30 June 2021 to be similar to the
Rental growth
ordinary distribution paid for the year ended
> 50 CPI/ 43 fixed rent reviews in FY2021 30 June 2020, with capital profits being
utilised to support the distribution as
> 15 Bunnings MRR’s to be finalised in FY2021 necessary. The distribution may be reviewed in
(in addition to those outstanding from FY2018, the event the COVID-19 impacts are more
FY2019 and FY2020) severe or prolonged than anticipated
OUTLOOK | FULL-YEAR RESULTS TO 30 JUNE 2020 32QUESTIONS? FULL-YEAR RESULTS TO 30 JUNE 2020 33
F U RT H E R I N F O R M AT I O N

bwptrust.com.au

Responsible entity:
BWP Management Limited
Tel: +61 8 9327 4356
Email: investorrelations@bwptrust.com.au

FUR TH ER INFOR MATION | FULL-YEAR RESULTS TO 30 JUNE 2020   34
You can also read