NEEDHAM CONFERENCE JANUARY 2018 - INVESTOR RELATIONS | CARGURUS
←
→
Page content transcription
If your browser does not render page correctly, please read the page content below

Needham Conference
   January 2018

© 2018 CarGurus, Inc. All rights reserved.
Various trademarks held by their respective owners.

Safe Harbor

Certain information contained in this presentation, other matters discussed today and answers that may be given in response to questions may include
“forward-looking statements.” We may, in some cases, use terms such as “anticipates,” “believes,” “could,” “estimates,” “expects,” “intends,” “may,”
“might,” “likely,” “plans,” “potential,” “predicts,” “projects,” “seeks,” “should,” “target,” “will,” “would,” or other words that convey uncertainty of
future events or outcomes to identify these forward-looking statements. In particular, our statements regarding trends and potential future results are
examples of such forward-looking statements. The forward-looking statements are subject to important factors, risks and uncertainties, including, but
not limited to, customer retention and growth, new product development, regulatory developments, sales and marketing strategies, capital resources,
operating performance, and those that we have detailed in the section titled “Risk Factors” in the reports that we have filed with the Securities and
Exchange Commission. These factors could cause actual results and developments to be materially different from those expressed in or implied by such
statements. Forward-looking statements are not guarantees of future performance and actual results may differ materially from those projected. The
forward-looking statements are made only as of the date of this presentation and we undertake no obligation to update such forward-looking
statements to reflect subsequent events or circumstances.
This presentation also contains estimates and other statistical data, including those relating to our industry and the market in which we operate, that we
have obtained or derived from industry publications and reports, including reports from comScore, Borrell Associates, and publicly available information.
We rely on Google Analytics for data relating to our own key business metrics and, for consistency, we rely on comScore for all data relating to
comparisons with our competitors. Google Analytics and comScore use different methodologies to derive their data and therefore their data for similar
statistics are not comparable. These industry publications and reports generally indicate that they have obtained their information from sources believed
to be reliable, but do not guarantee the accuracy and completeness of their information. This information involves a number of assumptions and
limitations, and you are cautioned not to give undue weight to these estimates, as there is no assurance that any of them will be reached. Based on our
industry experience, we believe that the publications and reports are reliable and that the conclusions contained in the publications and reports are
reasonable.

2    © 2018 CarGurus, Inc. All rights reserved.
Key Strengths

Large multi-national opportunity

History of growth and profitability

Technology disruptor in markets historically lacking innovation

Multiple growth vectors to reinvest core operating profits

3   © 2018 CarGurus, Inc. All rights reserved.
Company Vision & Mission
Build the World’s Most Trusted and Transparent Automotive
Marketplace

                MARKETPLACE
                                 Dealers &
                                Peer to Peer

                                                            Dealers

               UNBIASED
                                                 Buyers
             TRANSPARENCY
                             Price                        Peer to Peer

                       Dealer Reputation
                       Vehicle Condition
                       Inventory Ranking
5   © 2018 CarGurus, Inc. All rights reserved.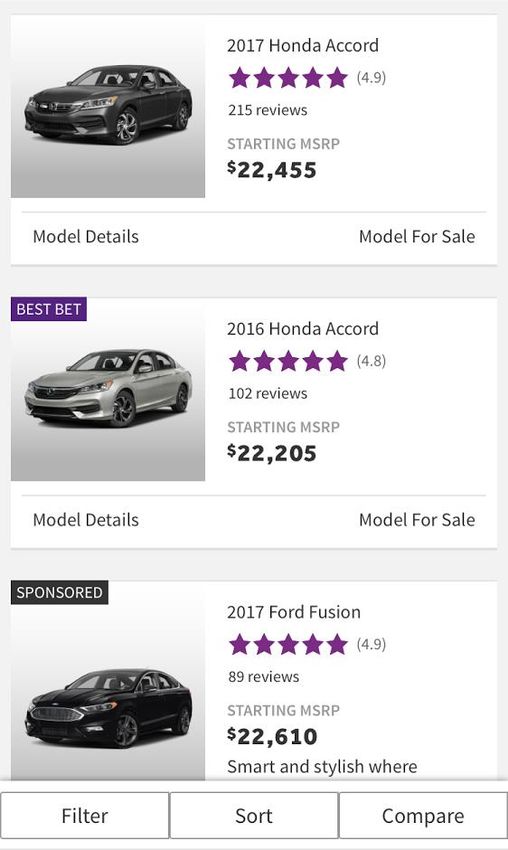
Transparency in Considered Purchases

                                                                         Need for Transparency

                                                                                                     Cost of Failed Purchase

6   © 2018 CarGurus, Inc. All rights reserved. Various trademarks held by their respective owners.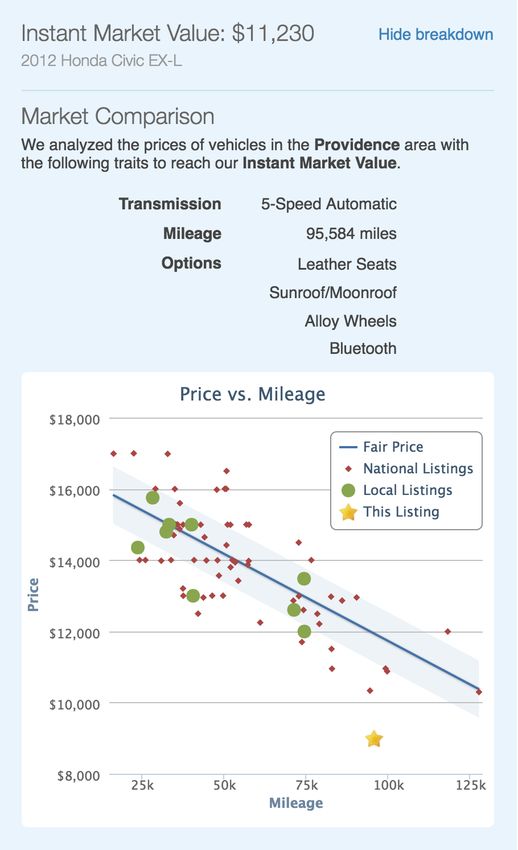
Technology Underpins Our Culture

                            Mathematical Problem Solving
                                  • 7+ years of data modeling
                                  • 7M+ used car data points ingested from hundreds of sources daily

                            Rapid Test / Innovate Environment
                                  • Regular code deployment
                                  • Automated multivariate testing run on all features
                                  • 24-hour code/deploy/measure cycles

                            History of Continuous Product Innovation
                                  • Consumer features to increase transparency
                                  • Dealer tools to drive platform productivity
                                  • International marketplaces

7   © 2018 CarGurus, Inc. All rights reserved. Various trademarks held by their respective owners.
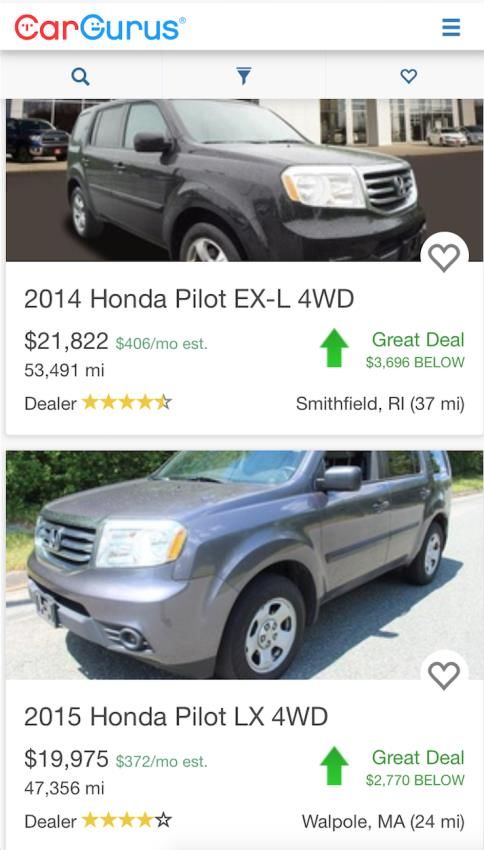
CarGurus – Search Results Optimized for Consumer Relevance

How did Google defeat Yahoo?
     • Relevance over economics
     • Algorithms provided
       best answer to consumer

CarGurus ranks listings based
on unbiased algorithms
     • Organic listings ranked by Deal Ratings
     • Instant Market Value considers
       make, model, trim, year, mileage, options and
       vehicle condition
     • Deal Rating incorporates Dealer Rating
       from CarGurus community

8   © 2018 CarGurus, Inc. All rights reserved. Various trademarks held by their respective owners.
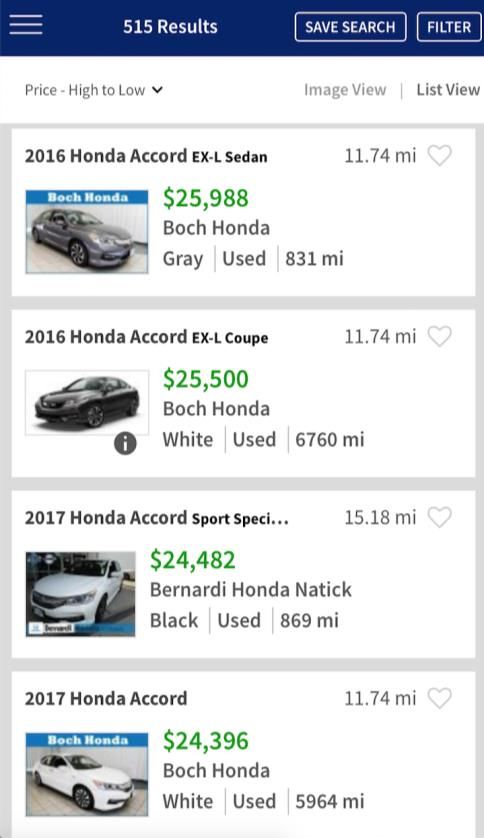
Competition – Pay For Placement

Over 500 Cars…
     •      How do I choose?
     •      Is this a good deal?
     •      Is this a reputable dealer?
     •      Sort order driven by who
            pays most

Merchant focused search results

9   © 2018 CarGurus, Inc. All rights reserved. Various trademarks held by their respective owners.
Significant Audience Share Gains versus Incumbents
U.S. AVERAGE MONTHLY VISITS
(MILLIONS)
42%
CAGR 79
3%
CAGR
(2%)
CAGR
31 34
27 25 23 21%
CAGR
3 4
Q3 2014 Q3 2017 Q3 2014 Q3 2017 Q3 2014 Q3 2017 Q3 2014 Q3 2017
Competitor A Competitor B Competitor C
more mobile unique
as many monthly visits mobile monthly
2x per visitor 58% visitors than next-largest
competitor
80% unique visitors
Source: comScore as of Q3 2014 and Q3 2017
Note: All data on this slide are U.S. only.
10
© 2018 CarGurus, Inc. All rights reserved.Market Opportunity & Value Proposition
U.S. Automotive Marketing Continues to Shift Online
TOTAL U.S. AUTOMOTIVE INDUSTRY
MARKETING SPEND ($ BILLIONS)

              Offline                                                                       CHANGING CONSUMER AUTO
              Online                                                     $47                   SHOPPING BEHAVIOR
                                                                4%
                                  $37                           CAGR
                                                                          $14
                                                                                              Average Dealership Visits
                                                                                                 Prior to Purchase
                                  $16
  63%
spent by
                                                                                             5
                                                                                     dealerships
 dealers                                                                  $33
                                                                                        in 2005
                                  $21
                                                                9%
                                                                CAGR
                                                                                                                    1.6
                                                                                                                     dealerships
                                                                                                                     in 2015
                                  2016                                 2021 (est.)

     Source: Borrell Research (2016), NIADA (2016)
12   Source: McKinsey & Company, Innovating Automotive Retail
     © 2018 CarGurus, Inc. All rights reserved.
International and Ancillary Markets
Expand Addressable Opportunity
NUMBER OF DEALERSHIPS AUTOMOTIVE RELATED SPEND IN U.S.
(THOUSANDS)
63 Auto-related
Products Advertising
Multi-billions
Planned
43 25 CarGurus
Markets
Dealer
Software Spend
~$4.5 billion
Current
38 CarGurus
Markets Used Cars Sold in P2P
Market ~11 million
U.S. International Markets
Source: Estimates from Borrell Research (2016), Autobiz (2016), investment bank analyst research (2016)
13 Note: Current CarGurus international markets include Canada, UK and Germany
© 2018 CarGurus, Inc. All rights reserved.Our Business Model
CONSUMERS CONNECTIONS DEALERS
MARKETPLACE
+
BRANDING
TOOLS
Marketplace Subscriptions
Average Annual Revenue
per Subscribing Dealer (AARSD)
$11,5261
1. As of Q3 2017, based on U.S. dealers only
14
© 2018 CarGurus, Inc. All rights reserved. Various trademarks held by their respective owners.Our Marketplace Can’t Be Replicated by Classified Models
LARGEST AUTO INVENTORY1: OVER 5.4M CAR LISTINGS FROM OVER 40,000 DEALERS
Car Price Information Dealer Information
• Instant Market Value2 • Qualified Dealer Reviews2
Information • Deal Rating2 • Dealer Ratings
• Vehicle History • Price History
• Days on Site
• Days on Lot
MOST INTUITIVE SEARCH RESULTS
88% 48%
of users
are in-market3
ENGAGED, INFORMED, READY-TO-BUY CONSUMERS expect to purchase car
in next month3
1. Largest number of car listings available on any of the major US online automotive marketplaces: CarGurus, Autotrader, Cars.com and TrueCar
2. Proprietary to CarGurus
3. Source: Company survey of 1,767 CarGurus users during Q2 2017
15 Note: 5.4M inventory and 40k+ active dealer count as of Q2 2017
© 2018 CarGurus, Inc. All rights reserved.Our Technology Drives Transparency for Consumers
UNSTRUCTURED CAR DATA FROM HUNDREDS OF Proprietary Algorithm
SOURCES ACROSS THOUSANDS OF DEALERS
Instant Market Value
IMV
7M+
+ =
Used Car Data Points
Analytics, Manual Penalties,
Bait & Switch Detection,
Make BMW BMW Non-standard Pricing,
Photos
Model 3-Series Coupe 328 20+ Ranking Signals
100+ Normalization Rules Dealer Rating
Year 2007 2007 Proprietary Algorithms & Data
Analytics
Trim 328 xi
2-door BMW with
Seller’s Comes with AWD, sun
moon roof in excellent Deal Rating
Description roof, and more!
condition Great Deal Good Deal Fair Deal High Price Overpriced
$3,242 BELOW $1,755 BELOW $921 BELOW $1,363 ABOVE $3,947 ABOVE
Instant Market Instant Market Instant Market Instant Market Instant Market
Value of $28,142 Value of $46,482 Value of $33,910 Value of $15,232 Value of $18,044
Both are a 2007 BMW 3-Series 328xi Coupe
16 © 2018 CarGurus, Inc. All rights reserved. Various trademarks held by their respective owners.Rapid Acquisition of Subscribing Dealers
NUMBER OF PAYING DEALERS GLOBALLY
(THOUSANDS)
U.S. International
78% 27
25
CAGR 23
21
19
17
15
12
10
8
6
Q1 2015 Q2 2015 Q3 2015 Q4 2015 Q1 2016 Q2 2016 Q3 2016 Q4 2016 Q1 2017 Q2 2017 Q3 2017
17 © 2018 CarGurus, Inc. All rights reserved.Our Business Model and Scale Create Network Effects
1 2
Transparent Large, in-market
marketplace audience compels
attracts the largest more dealers to pay
audience for listings
CONSUMER PAYING
TRAFFIC DEALERS
4 3
ANALYTICS CONNECTIONS
More connections
More paying
strengthen our
dealers create more
algorithms and
connections
resulting transparency
18 © 2018 CarGurus, Inc. All rights reserved.Growth Opportunities
Key Growth Opportunities

                                                                                             Grow our paying
                 Grow the size                                 Expand and
                                                                                             U.S. dealer base
                 and engagement                                scale
     1           of our consumer                           3   international             2   and increase
                                                                                             revenue per
                 audience                         Buyers       markets         Sellers
                                                                                             dealer

20   © 2018 CarGurus, Inc. All rights reserved.
Grow Our Audience by Addressing More Consumer Needs
GROW AUDIENCE SHARE INCREASE ENGAGEMENT
INVEST IN BRAND ALONG WITH ALGORITHMIC
TRAFFIC ACQUISITION
CONSUMER AUTO OWNERSHIP LIFECYCLE
RESEARCH / MAINTAIN /
PURCHASE
COMPARE SELL
Total Minutes Spent on Major U.S.
Online Automotive Marketplaces1
Nationwide
Detailed Analysis P2P
Inventory
52%
46%
New Cars Warranty C2B
36%
Finance / Service /
Inspections
Insurance Maintenance
Sep 2015 Sep 2016 Sep 2017
Current CarGurus CarGurus Product
Source: comScore
1. Major U.S. online auto marketplaces include CarGurus, Autotrader, Cars.com and TrueCar Offering Opportunity
21
© 2018 CarGurus, Inc. All rights reserved.Grow Our Paying U.S. Dealer Base
FREEMIUM BUSINESS MODEL PAYING VS. NON-PAYING DEALERS IN U.S.
(THOUSANDS)
Basic (Free)
Value Driver Paid Listings
Listings
Phone
Email
Anonymized
Connections Text/Chat 19
Email
URL
24
Map/Directions
Merchandising Pricing Tool Market
N/A
Tools Analysis
Dealership Website
N/A
Branding Full Contact Paying Dealers on Our Platform
Non-Paying Dealers in the Market
Source: Borrell Research (2016)
22 Note: Paying dealers on CarGurus platform as of Q3 2017
© 2018 CarGurus, Inc. All rights reserved.Increase Average Annual Revenue
per Subscribing Dealer (AARSD)
CONNECTIONS BETWEEN CONSUMERS
• Algorithmic Optimization AND DEALERS U.S. AARSD
Grow IN THE U.S.
• Text/Chat 21%
Connection $11,526
• Brand 10.3M 12.4M 16%
Volume
• 42M Connections in 2016 in the U.S. $9,939
Q2 2016 Q2 2017
DEALER DISPLAY
PENETRATION1
15%
• Dealer Display
Sell New
• Re-targeting
Products 5%
• SEM (Search Engine Marketing)
Q2 2016 Q2 2017
• Annual Renewals
Pricing & • Leads → Connections
Packaging • Pay for Performance Package
• Market-based / Auction Pricing Q3 2016 Q3 2017
1. % of US Marketplace Listing subscribers who also subscribe to Dealer Display Product
23
© 2018 CarGurus, Inc. All rights reserved.Replicate Our Model in International Markets
Core Market Successfully Launched
INTERNATIONAL AVERAGE MONTHLY UNIQUE
USERS (MILLIONS)
2.6
1.7
Q3 2016 Q3 2017
INTERNATIONAL PAYING DEALERS
2,240
626
Launched Launched Launched
in 2014 in 2015 in 2017
Q3 2016 Q3 2017
Source: Unique users based on Google Analytics data
24
© 2018 CarGurus, Inc. All rights reserved.Financial Overview
Key Financial Highlights

 Strong track record of revenue growth

 High quality revenue: recurring, high retention, and diversified

 Proven operating leverage and GAAP profitability

 Attractive free cash flow generation

 Scalable model for replication in international markets

26   © 2018 CarGurus, Inc. All rights reserved.
Significant Revenue Momentum
($ MILLIONS)
                                                                                                                                 56%
                                                                                                                                  YoY
     U.S.           International                                                                                                Growth

                                                  $198                                                                           $83
                                                           $2
                                                                                                                          $76
                                      101%                                                                          $67
                                       YoY
                                      Growth
                                                                                                              $61
                                                                                                        $53
                                                                                                $46
                    $99
                                                  $196                                    $39
                                                                                    $33
                                                                              $27
                                                                      $22
                                                                $17

                 FY2015                           FY2016        Q1    Q2      Q3    Q4    Q1    Q2      Q3    Q4    Q1    Q2      Q3

                                                                            2015                      2016                2017
27   © 2018 CarGurus, Inc. All rights reserved.
Strong Performance in Customer Metrics
U.S. PAYING DEALERS INTERNATIONAL PAYING DEALERS
24,313
18,777
10,085 2,240
626
Q3 2015 Q3 2016 Q3 2017 Q3 2016 Q3 2017
U.S. AARSD INTERNATIONAL AARSD
$11,526
$9,939
$8,486
$4,401 $4,944 $4,711
Q3 2015 Q3 2016 Q3 2017 Q1 2017 Q2 2017 Q3 2017
28 © 2018 CarGurus, Inc. All rights reserved.High Quality Revenue:
Recurring, High Retention and Diversified
RECURRING HIGH RETENTION DIVERSIFIED
TOTAL REVENUE U.S. MONTHLY MARKETPLACE CUSTOMER CONCENTRATION
($ MILLIONS) SUBSCRIPTION REVENUE BY COHORT
($ MILLIONS)
Marketplace Subscription $25 2017 Top 10
$198 2016 Customers
5%
$27 $20 2015
Pre-2015
$15 Other
Customers
$99 95%
$10
$23 $171
$38 $5
$18 $75
$19
$0
2014 2015 2016 2013 2014 2015 2016 2017 2016 Marketplace Subscription Revenue: $171M
17% of U.S. paying dealers on annual subscriptions as
of 6/30/17, up fromIncreasing Company-Level Operating
Leverage Despite Investments in International
U.S. GAAP OPERATING INCOME CONSOLIDATED GAAP OPERATING INCOME
($ MILLIONS) ($ MILLIONS) $15
$34
$27
$17
$1 $9
FY 2015 FY 2016 Nine Months Nine Months
Ended 9/30/16 Ended 9/30/17
% Margin 1% 14% 12% 15%
$4
INTERNATIONAL GAAP OPERATING INCOME
($ MILLIONS)
$(3)
$(13) ($3)
$(19) $(18)
FY 2015 FY 2016 Nine Months Nine Months
Ended 9/30/16 Ended 9/30/17
Nine Months Nine Months
FY 2015 FY 2016 % Margin (3)% 4% 3% 7%
Ended 9/30/16 Ended 9/30/17
30 © 2018 CarGurus, Inc. All rights reserved.Capital Efficient Business Model and Attractive Cash Flow
CONSOLIDATED ADJUSTED EBITDA1 CONSOLIDATED FREE CASH FLOW2
($ MILLIONS) ($ MILLIONS)
$18
$16
$13 $13
$11
$6
$5
($0)
FY 2015 FY 2016 Nine Months Nine Months FY2015 FY2016
Nine Months Nine Months
Ended 9/30/16 Ended 9/30/17 Ended 9/30/16 Ended 9/30/17
% Margin (0)% 6% 4% 8%
1. Adjusted EBITDA defined as net income (loss), adjusted to exclude: depreciation and amortization, stock-based compensation expense, other expense (income), net, the (benefit from) provision for income
taxes, and other one-time, non-recurring items, when applicable.
31
2. Consolidated Free Cash Flow is calculated as the sum of cash flow from operations minus purchases of property and equipment and capitalization of website development costs.
© 2018 CarGurus, Inc. All rights reserved.Long-Term Financial Targets
Nine Months
Percent of Revenue 2015A 2016A Long-Term Target1
2017A
Gross Margin 96% 95% 95% 93% – 95%
Sales & Marketing % 83% 78% 75% 43% – 47%
Technology % 8% 6% 6% 9% – 11%
G&A % 6% 6% 6% 5% – 6%
Depreciation & Amortization % 1% 1% 1% 1% – 2%
Adjusted EBITDA Margin (0)% 6% 8% 32% – 34%
GAAP Operating Margin (3)% 4% 7% 29% – 31%
U.S. Segment GAAP Operating Margin 1% 14% 15%
1. These statements are forward-looking and actual results may differ materially from those presented here. Refer to the slide titled “Safe Harbor” for information on the factors that could
cause our actual results to differ materially from these forward-looking statements.
32 © 2018 CarGurus, Inc. All rights reserved.Wrap-Up
Large and Growing Addressable Market
Most-Visited Online Automotive Marketplace in the U.S.1
Unique Business Model Difficult to Replicate
Technology Underpins Consumer and Dealer Value Proposition
Well-Positioned to Capitalize on Multiple Growth Opportunities
Strong Track Record of Revenue Growth, Profitability and Financial Discipline
1. Source: comScore Media Matrix, Q3 2017
33
© 2018 CarGurus, Inc. All rights reserved.Appendix
Reconciliation of Net (Loss) Income to Adjusted EBITDA

($ MILLIONS)                                        Year Ended December 31,         Nine Months Ended June 30,

                                                   2015                2016         2016                 2017

  Net (loss) income                                $(1.6)                 $6.5        $2.7                $10.9

  Depreciation and amortization                       1.1                     2.1      1.4                   2.7

  Stock-based compensation expense                    1.0                     0.3      0.2                   0.2

  Other expense (income), net                         0.0                 (0.4)      (0.3)                  (0.3)

  (Benefit from) provision for income taxes         (0.9)                     2.4      1.6                   4.6

  Adjusted EBITDA                                  $(0.4)                $11.0        $5.6                $18.1

 35   © 2018 CarGurus, Inc. All rights reserved.
Consolidated Balance Sheet
($ MILLIONS) As of September 30, 2017 As of December 31, 2016
Actual Actual
Cash, cash equivalents, and investments $85.6 $74.3
Property and equipment, net 16.1 12.8
Working capital 60.7 56.5
Total assets 121.7 100.3
Total liabilities 45.3 35.6
Convertible preferred stock 132.7 132.7
Total shareholders' (deficit) equity (56.3) (68.0)
36
© 2018 CarGurus, Inc. All rights reserved.You can also read