Dawn Keller - Best Buy Prediction Markets Conference Kansas City November 1, 2007
←
→
Page content transcription
If your browser does not render page correctly, please read the page content below

Dawn Keller – Best Buy
Prediction Markets Conference
         Kansas City
      November 1, 2007
Internal Case For Change
Collective Intelligence

            “None of us is as smart as all of us”
                               Japanese Proverb

             “If only HP knew what HP knows”
                     Former Hewlett-Packard CEO Lew Platt

    “It is increasingly harder for someone with insight
         to do something about it or get connected
                  with someone who can.”
        Shari Ballard [Best Buy EVP], on why big companies routinely fail
Why Do We Need A Prediction Market

 Truth #1: Everyone has insight

 Truth #2: BBY is already determined to
 unleash individual insight &
 collective intelligence

 Truth #3: The larger & more spread out the organization,
 the harder it is to transmit insights to where they’re needed

 Truth #4: The more senior you are, the less likely
 it is that you will receive insights.

 Truth #5: Companies are neither democracies nor free markets.
 A few people at the top make decisions/allocate resources.
Consequences for Best Buy

 As we grow in size, scope, and complexity,
        our senior decision-makers
           get fewer insights …

      making it more difficult for them
         to make good decisions.

                           BUT …
                           Knowledge, insights, and ideas are out there.

                               A Prediction Market is but one way
                                   to help the company listen.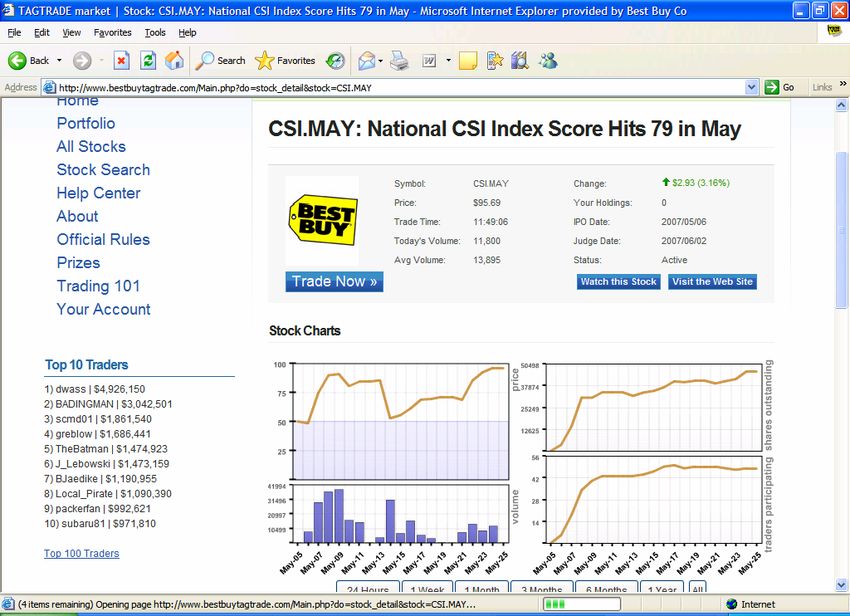
How Trading Markets Can Help

   1. Markets can invite insight from anywhere/everywhere

   2. Markets can protect anonymity; get better information

   3. Markets are dynamic, real-time indicators

   4. Markets consolidate everyone’s insights/information/sentiment
      into a single, actionable, easy-to-understand
      metric: A PRICE
Our Vision

Tens of thousands of
BBY employees trade
“stocks” around future
BBY events, using their   The prices of these
own insights              “stocks” are listed on
                          Tagzone. They            Price levels and acute
                          instantly change as      price changes inform
                          supply and demand        senior-level decision-
                          ebb and flow             making
Factors in Our Favor
Our Business:
Very dynamic
Increasingly complex
International, multi-brand, multi-business
Harder to predict
Our Structure:
Majority of employees spread across the country, globe
These customer facing employees hold significant insights
They have the fewest access points to decision makers
Our Culture/Values:
Have Fun While Being the Best
Unleash the Power of our People
Invite each employee to contribute his/her unique ideas, insights, and
experiences in service of customers
Executive humility
Less top-down, more bottoms-upJourney Thus Far
Inspiration to Incubation to Implementation
                                                                                                          Official launch

                                                                                            2nd pilot market

                                                                   Execs on board

                                                                 ETA
                                                                B

                                                  Switched to
                                                   markets
                     Crowd 99.9% accurate 4
                     months prior to holiday

            Crowd prediction
              beat forecast

                   All volunteer effort                                             1 FTE                      1.5 FTEs
                                                                                                                            Nov
     2005                                      2006                                  2007                                   2007
Two Test Markets to Get Feet Wet
Fall 2006 Primary Objectives
Small group (100+) of test Understand participation
traders at Corporate Office patterns and drivers
Understand how to
communicate the market
Spring 2007
Learn how to choose, structure,
Retail Management – Upper
write, and time stocks
Midwest (Store, District,
Regional level)
Returning Corporate Office Secondary Objective
participants
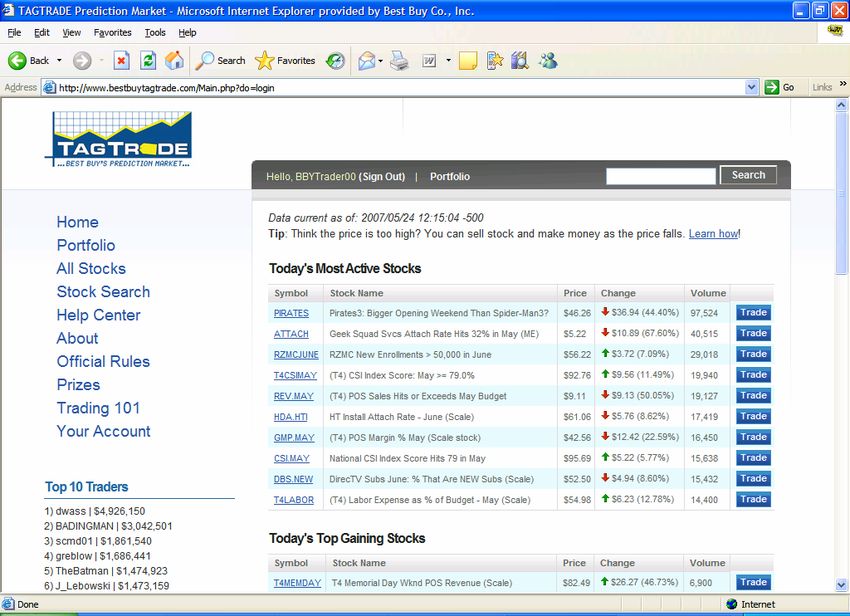
Market PerformanceA Look Inside
A Look Inside
A Look Inside
Examples of Stocks
About 50 contracts
Revenue, POS Margin, comps, etc.
Holiday/Drive time – e.g. DI revenue during Mother’s Day; Gift Card sales
during Dad’s Day; Memorial Day Revenue
Loyalty programs - RZMC enrollments; ESE coupon revenue, etc.
Expenses – e.g. Labor as % of budget
CSI scores
Services attach rates; HD-Advantage performance, etc.
SKU level sales forecasts (Private label, CD new releases, insert-advertised
items, new Geek services, etc.)
External - Hot topics on analyst calls; iPhone ratings
Sports and entertainment stocks to drive participationSpring ‘07 Pilot – Participation Stats
All Traders Corporate Retail – T4
Total Traders 159 79 80
(Registered) (196) (97) (99)
Total Transactions 10,300 7450 2850
Transactions per 22 24 21
trader - Median (2/1213) (2/1213) (2/288)
(high/Low)
Stocks per trader – 11.6 12.4 11.7
Average (median) (9) (9) (9)
Traders per Stock - 40.5 21 19.5
Average
On the whole, Retail participation was not that different from
Corporate. Biggest deltas were:
• More ‘uber’ traders at Corporate
• Steeper drop off with Retail over timeTraders per Day
50
45
40
35
30 Corp
25 employees
20
15
10
5
0
5/ 6 5/13 5/20 5/27 6/3 6/10 6/17 6/24
50
45
40
35
30
25
Retail
20
employees
15
10
5
0
5/ 6 5/13 5/20 5/27 6/3 6/10 6/17 6/24Unique Traders per Stock
0 10 20 30 40 50 60 70 80 90 100
ATTACH
REV.MAY
T4CSIMAY
AI.JORDI
CSI.MAY
T4LABOR
AI.BLAKE
IPODCHOC
DI.MOM
NASCAR
AI.MELIN
PIRATES
RZMCJUNE
GMP.MAY
AI.LAKIS
FORT.100
CD.TUES
SHREK3
TWST.JUN
TWST.08
MAY.ESE
PDVD.JU
PDVD.08
QA.APPLE General company stocks
HDA.HTI
NBA.CLEV
SOPRANO Avg = 40.5 traders per stock
DBS.NEW Territory 4 specific
PC.SETUP
T4MEMDA
HDA.DBS
QA.DELL Non-BBY stocks (fun)
GIFTCARD
DBS.UPGR
PGA.PAR
PGA.TIGR
T4COMPJU
CD.KELLY
PGA.PHIL Median = 36 traders per
BSN.COM stock
IPHONE.U
T4COMP08
IPHONE.E
T4SVCJUN
T4SVC08
Generally, we saw parity across the 3 broad stock categories.Unique Traders per Stock
0 10 20 30 40 50 60 70 80 90 100
ATTACH
REV.MAY
T4CSIMAY
AI.JORDI
CSI.MAY
T4LABOR
AI.BLAKE
IPODCHOC
DI.MOM
NASCAR
AI.MELIN
PIRATES
RZMCJUNE
GMP.MAY
AI.LAKIS
FORT.100
CD.TUES
SHREK3
TWST.JUN
TWST.08
MAY.ESE
PDVD.JU
PDVD.08
QA.APPLE
HDA.HTI
NBA.CLEV Corporate traders
SOPRANO
DBS.NEW
PC.SETUP
T4MEMDA
Territory 4 traders
HDA.DBS
QA.DELL
GIFTCARD
DBS.UPGR
PGA.PAR
PGA.TIGR
T4COMPJU
CD.KELLY
PGA.PHIL
BSN.COM
IPHONE.U
T4COMP08
IPHONE.E
T4SVCJUN
T4SVC08
Stocks attracted corporate and T4 employees equally, with some
logical exceptions.Example 1
Instant Access to Employee Sentiment
Q2 Earnings Release
Brian or Brad will mention ‘lifestyle groups’ in the analyst call
Brad finishes without
$10 drop at the mention, causing stock
beginning the call to start plummet which
worsens with each
analyst question
Stock falls to close
Stock trading at $80 to zero as call ends
leading up to the call Stock walks up as
Brad’s talk approachesExample 2
Market Reveals Hidden Opinions
October [product category] Revenue
Will [product category] Team make their October forecast (Version 8)?
Price plummets on opening
(two days after forecast locked)Example 3
Market Provides a Quantitative View …
Shanghai Store NSO
Would the soft-opening be finalized/announced ‘on schedule’?
What happened here?Example 3
.. And Gives An Early Warning Signal
This example suggests the advantage of having a market
as part of an overall dashboard
Directionally predictive before
official status report caught onExample 3
… VS. Project Status Reports
Overall China NSO dashboard around the same time
Timeline / Week 10 & Week 9 Week 8 Week 7 Week 6 Week 5
Team earlier
abc G
G G
G G
G G
G G
G
LEGEND
abc
Y G
G G
G Y Y
On Track to Meet Timeline
G
G & Deliverables
abc
G
G G
G G
G G
G G
G
abc
G
G G
G G
G Y Y Y Encountering roadblocks that may
put timeline and deliverables at risk
abc
Y G
G Y Y Y
Will not meet Timeline &
R
R Deliverables
abc
G
G G
G G
G G
G G
G
abc
Y G
G Y G
G G
G
abc
G
G G
G G
G G
G Y
G G G Official status at that time
abc
Y G G Y GExample 4 Market Knew To Be Bullish STOCK: How Would Gift Cards Do Over Dad’s Day Week? Official Forecast: $XXM (stock price $60) Actual Results: beat forecast by $5M (stock price > $100)
Engaged Traders

 75% fun, interesting                                        78% told 2+ people
                                                             about the market

                                                                    42% easy to understand

                                         65% important to the company

 Source: Post Market Survey, Top 2 box
Smart Traders
All or most of the time …
51% I traded stocks based
on some insights I already
had (I work on the team etc.)
46% I did minimal research
on stocks (read prospectus,
checked out some websites
etc.)
10% I did extensive research
Source: Post Market Survey, Top 2 boxWhat’s Next
November 2007 Launch Plan
WHAT KEY OBJECTIVES
Phase 1 Roll-out
Deliver insights & value to the
business
WHO will have access to trade
All corporate employees (hard launch) Solicit and develop lead customers
US retail employees (soft launch) Over time – how to ‘operationalize’
this into decision making
WHEN will the market run
Go Live - Week of 11/14 Continue to learn:
Continue throughout holiday season
Participation drivers & patterns
Reset and resume end of FY
Incentives that drive rational
investing
HOW will we drive awareness/trial Best applications of the market
Corporate: various communication (forecasting, project management,
vehicles new product/service development,
Retail new business ideas, etc.)
No concerted marketing effort until How to select, structure, write stocks
after holiday
Viral – e.g. word of mouth, company
blog, message boards, etc.Stock Plan
What We’re Looking For in Stock Ideas
Where is information potentially distorted, delayed, or diluted on its way to Sr.
management?
Where does management want/need a better gauge of employee
sentiment/confidence?
What businesses are most challenging (least conducive) for traditional
forecasting methods?
What initiatives/outcomes require increased visibility by a broader audience?
What economic assumptions require better input from those closest to
customer?
For what major initiatives do leaders require a more accurate health check?Challenges & Opportunities Ahead …
Challenges
Lead customers – need early adopter group of leaders who will engage
w/the market real time to inform their decisions
Getting the organization’s attention - Proverbial noise in the system –
Matrix, Holiday, org changes
Keeping its attention - Sustaining trader participation over time
Maximizing value of market while mitigating legal concerns – uncharted
territory. Could compromise scope/value of stocks; depth of employee
participation
Opportunities
Can we use market for assessing new ideas, vetting decision options
Can we integrate with things like internal blog/social networking site,
internal idea capture/management tool, etc. to create ecosystem of various
‘listening’ and ‘crowd-sourcing’ tools
How quickly can we expand participation & engage all employees (including
part-time, service technicians, logistics, international, other brands, etc.)2008: Grow and Integrate
GROW PARTICIPATION IMPROVE MARKET OPS
9 Scale at Corporate 9 Competition Structure
9 Grow virally with Field employees 9 Incentives/Prizes
9 Explore International & other 9 Trader Communication
brands 9 Stock Pipeline
9 Training
SUPPORT INSIGHT NEEDS LEVERAGE NETWORK
9 Identify areas of opportunity Join community of leading
9 Foster key business leader partnerships companies and academics to
9 Synchronize with decision rhythms accelerate our learning in this new
spacePlease contact us at: PredictionMarket@BestBuy.com
You can also read