Roadshow presentation - HY2018/19 Result April 2019 - Barry Callebaut
←
→
Page content transcription
If your browser does not render page correctly, please read the page content below
Roadshow
presentation
HY2018/19 Result

April 2019

AGENDA

• BC at a glance

• Highlights HY 2018/19

• Financial Review HY 2018/19

• Strategy & Outlook

• Appendix

 2 Roadshow presentation HY2018/19
BC at a glance
BC at a glance - Who are we?

The heart and engine of the chocolate industry

                                     • A merger between Cacao Barry, the very first French
                                       chocolate connaisseur since 1842 and Callebaut a
                                       Belgian chocolate couverture manufacturer expert since
                                       1911

                                     • Listed on the SIX Swiss Exchange since 1998

                                     • Jacobs Holding long-term major shareholder with
                                       50.1% of the outstanding shares.

                                     • Today, the world's leading manufacturer of high-quality
                                       chocolate and cocoa products

                                     • Barry Callebaut is inside 25% of all consumer products
                                       containing cocoa or chocolate

 4 Roadshow presentation HY2018/19
BC at a glance - What do we do?

We are present in the key parts of the cocoa and chocolate value
chain

 5 Roadshow presentation HY2018/19
BC at a glance - This is Barry Callebaut

“Shaping the world of chocolate and cocoa”

                                           FY 2017/18

 6 Roadshow presentation HY2018/19
BC at a glance - What do we offer?

A broad offering from standard to the most premium products

   Cocoa Products                    Food Manufacturers   Gourmet & Specialties

 7 Roadshow presentation HY2018/19
BC at a glance - how are we organized?

Our Regional and Product split

 Sales Volume by Region                                       Sales volume by Product Group

                                                            Gourmet &             Cocoa
Americas                                                    Specialties          Products
                                     EMEA                                          22%
 27%                                                          12%
                                      46%

Global Cocoa
   22%                      Aisa Pacific                          Food Manu-
                                 5%                                facturers
                                                                     66%

                                           Full-Year 2017/18:
                                     Sales Volume: 2.0 million tonnes
                                     Sales Revenue: CHF 6,948.4 m
                                         EBITDA: CHF 728.3 m
                                           EBIT: CHF 554.0 m

 8 Roadshow presentation HY2018/19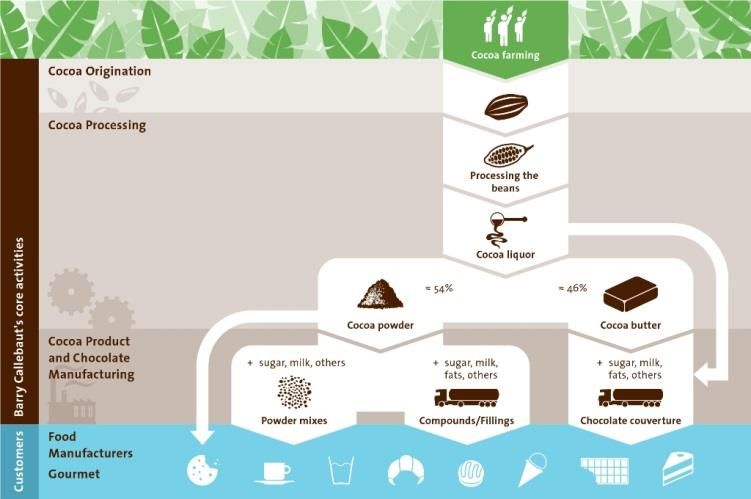
BC at a glance - business model

We apply a cost plus approach to the majority of the business

                                                Customers                       Pricing model                             Profit levers

     Food manufacturers                       Small, medium                         Cost Plus                          Customer mix
                  66%*                         Global Food                                                              Product mix
                                              Manufacturers                                                          Economies of scale

             Global Cocoa                     Small, medium                     Market prices                          Global set-up
                     22%*                      Global Food                     Cost Plus (partly)                  Customer/product mix
                                              Manufacturers                                                          Combined ratio

   Gourmet & Specialties                  Professional users,                        Price List                  Expansion global brands
                  12%*                    Food Chains, Distri-                                                      Adjacent products
                                           butors, HORECA                                                        Innovation/Sustainability

               Passing on the cost of raw materials to customers underpins profit stability by mitigating volatility impact of
                                                           main raw materials

   * Percentage of FY2017/18 Group sales volume
 9 Roadshow presentation HY2018/19
BC at a glance - where are we present?

A global footprint and local service: 60 factories worldwide
Cocoa factories in origin countries and
chocolate factories close to our customers.
With our 22 Chocolate Academies worldwide
we are at the pulse of any trends in the
industry

  Cocoa processing factory
  Chocolate factory
  Integrated factory
  Chocolate Academy

10 Roadshow presentation HY2018/19
Highlights
HY2018/19
Highlights HY Results 2018/19

                                                                Strong profitability and accelerating
                                                                growth momentum

                                                                • Sales volume up +2.4% on top of a strong prior year
                                                                  base

                                                                • Acceleration in Q2 to +3.1%

                                                                • Sales revenue of CHF 3.7 bn, +6.0% in local
                                                                  currencies (+3.5% in CHF)

                                                                • Operating profit (EBIT) up +12.4% in local
                                                                  currencies (+8.9% in CHF)

                                                                • Net Profit up +18.8% in local currencies (+15.1% in
                                                                  CHF). Net profit adjusted1 +12.3% in local
                                                                  currencies (+8.7% in CHF)

                                                                • On track to deliver on current mid-term guidance2

   1   prior year adjusted for one-time non-cash expense related to tax reforms in Belgium and the US
   2   2015/16-2018/19 on average: +4-6% volume growth and EBIT growth above volume barring any major unforeseen events

12 Roadshow presentation HY2018/19
Highlights HY Results 2018/19
+2.4% volume growth, accelerating growth momentum driven by
chocolate
HY 2018/19 volume growth vs prior year
(in tonnes)
FY 2017/18 HY 2018/19
FY 2016/17
+6.3% +2.4%
+4.4%
+4.7% +1.7% +3.1%
Chocolate (FM and Gourmet & Spec.) +1.1% +4.3%
+2.9%
Global Cocoa +4.8%
+2.3% +5.7% -2.4% -0.9%
+8.0% +8.1%
+7.4% +4.8% +5.5%
+9.2%
+8.1% +9.0%
+12.6%
+5.5% +8.2%
+0.3%
-0.4% +3.5%
+2.3% +7.2%
+4.9%
-8.6% -0.8%
Q1 17 Q2 17 Q3 17 Q4 17 Q1 18 Q2 18 Q3 18 Q4 18 Q1 19 Q2 19
Market
Volume -2.3% -1.4% +2.3% +2.2% +3.1% +1.7% +2.2% +1.3% +1.4% +1.5%
growth*
* Source: Nielsen chocolate confectionery in volume Aug 2018 to Jan 2019 – 25 countries
13 Roadshow presentation HY2018/19Highlights HY Results 2018/19
Key growth drivers gaining momentum
% of total Volume growth
Group volume Vs prior year
34% +4.6%
Emerging Ex cocoa
Markets +7.4%
Key growth
drivers
33%
Outsourcing +2.8%
Long-term crucial to
Partnerships continuously
outperform the
market
12% +4.1%
Gourmet & Ex Beverages
Specialties +6.8%
14 Roadshow presentation HY2018/19Highlights HY Results 2018/19
Continued expansion around the globe
Acquisition of Inforum in Russia
• A leading B2B chocolate manufacturer in Russia
• Acquisition closed in January 2019
Long-term supply agreement with Burton’s
• Supply started in December 2018
• Expand production capacity in UK
New Global Packaging Center in Halle, Belgium
• Services Gourmet customers across the world
• strengthens supply chain in growing Gourmet business.
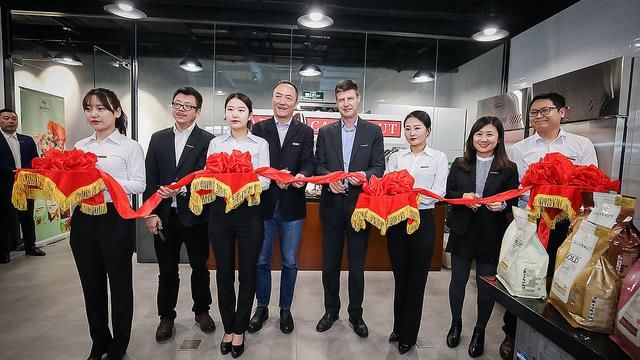
Opening of new Chocolate Academy’s
• new offices and second Chocolate Academy in Beijing,
China – the 22nd one globally
• Opening of relocated Chocolate Academy in Istanbul,
Turkey
Healthy outsourcing pipeline
• More volumes coming on stream in 2H 2018/19
15 Roadshow presentation HY2018/19Highlights HY Results 2018/19
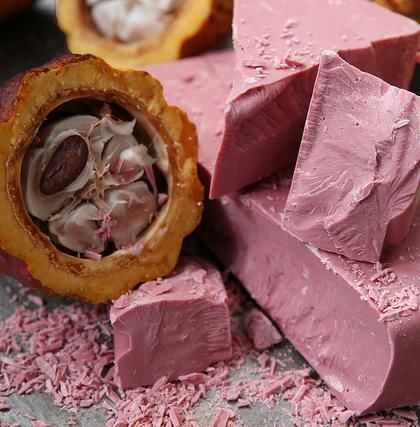
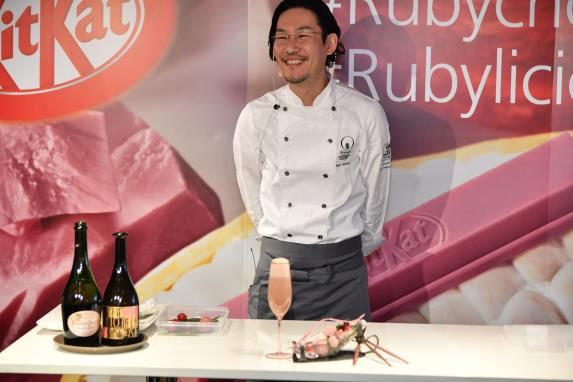
Ruby goes global!
Ruby 1st year anniversary
Introduced by more than 20 brands
Available in over 40 markets
Launch of rubychocolate.com
crowdsourced platform
16 Roadshow presentation HY2018/19Highlights HY Results 2018/19
Innovation - there is much more
going on!
• Dairy-free: launch of Magnum Vegan, with
dairy-free chocolate
• Sweet solutions: we are the largest producer
of sugar-reduced chocolate products
• Shaping experiences: leverage the knowhow
of D’Orsogna and Gertrude Hawk in
decorations and inclusions
• Tailor made: allows chefs to customize their
own chocolate recipe from a selection of the
best cocoa beans from around the world
17 Roadshow presentation HY2018/19Financial Review HY 2018/19
Financial Key Figures
Profit growing above volume growth

    Group performance                                        HY 2018/19                    % vs prior year in    % vs prior year in
    (in CHF mio)                                                                                 CHF             local currencies
    Sales volume Total
                                                              1,046,695                             +2.4%               n/a
    (in tonnes)

    Sales revenue                                               3,672.7                             +3.5%             +6.0%

    Gross profit                                                 584.8                              +5.7%             +8.5%

    EBIT Total                                                   301.4                              +8.9%             +12.4%
    EBIT per tonne                                                288                               +6.4%             +9.8%

    Net profit for the period                                    199.1                             +15.1%             +18.8%

    Adj. Net profit for the period1                              199.1                              +8.7%             +12.3%

    Free Cash Flow                                               -140.6                               n/a               n/a

    Adj. Free Cash Flow2                                          -31.4

1   PY Net profit for the period included a CHF 10.1m impact from the tax reforms in Belgium and the US
2 Adjusted  for cash flow effect of cocoa beans regarded as readily marketable inventories (RMI), by the Group

    19 Roadshow presentation HY2018/19
Regions Key Performance Indicators
All Regions contributed to volume growth and profitability
EMEA
Group Sales Volume: Americas 480,721
1’046’695
1,046,695 281,204
tonnes
APAC
Global Cocoa
57,192
227,578
EMEA Americas Asia Pacific Global Cocoa
FY volume growth +2.0% +5.8% +5.7% -1.7%
EBIT growth in
local currencies +6.1% +8.5% +10.8% +22.5%
Market
Volume +0.7% +1.0% +8.6%
growth*
* Source: Nielsen chocolate confectionery in volume Aug 2018 to Jan 2019 – 25 countries
20 Roadshow presentation HY2018/19Gross Profit
Gross profit up +8.5% in local currencies, driven by good product mix
and a supportive market environment
In CHF millions
+8,5%
21
600 -15
26 -9
585
9
553
Gross Profit Volume Mix Cocoa Additional Gross Profit FX impact Gross Profit
HY 2017/18 effects effects processing costs due HY 2018/19 HY 2018/19
to growth before FX
and other
21 Roadshow presentation HY2018/19Cocoa processing profitability
Cocoa Combined Ratio remains at a healthy level
European combined ratio - 6 month forward ratio
4.00
3.50 Combined
Ratio 3.5
3.00
Butter ratio
2.50
2.00
1.50
1.00 Powder ratio
0.50
0.00
août.08 août.09 août.10 août.11 août.12 août.13 août.14 août.15 août.16 août.17 août.18
For cocoa processors, profitability depends on the ratio between input costs (price of cocoa beans) and combined output prices
(price of cocoa butter and powder).
22 Roadshow presentation HY2018/19EBIT
Strong increase in operating profit by +12.4% in local currencies
In CHF millions
+12.4%
+47
311
301
-13
277 -10
EBIT Additional Additional EBIT FX impact EBIT
HY 2017/18 Gross Profit SG&A, Scope and HY 2018/19 HY 2018/19
non-rec/other before FX
23 Roadshow presentation HY2018/19EBITDA to Net Profit
Net Profit up +15.1% in CHF, as a result of good profitability
In CHF millions
387 Tax rate: 19.3% vs PY
(+7.6%) 19.5% (excl. non-
recurring tax impact)
301
(+8.9%) +15.1%
-85 +8.7%
(-3.4%) (+12.3% in LC)
-55
(-11.2%) 199
183 10
-48 173
(+12.9%)
EBITDA Depr. and EBIT Financial Income Net profit Net profit Non-rec. Net profit
HY 2018/19 Amort. HY 2018/19 items taxes HY 2018/19 HY 2017/18 Tax impact HY 2017/18
adjusted
24 Roadshow presentation HY2018/19Raw material prices
Price increases mainly in Sugar and Dairy during the first half. On
average Cocoa bean price also increased
250%
200% Increase HY 2018/19
150%
Sugar World +13.7%
100% Milk powder +17.7%
Cocoa beans -0.3%
Sugar EU +37.3%
50%
0%
févr..09 févr..10 févr..11 févr..12 févr..13 févr..14 févr..15 févr..16 févr..17 févr..18 févr..19
25 Roadshow presentation HY2018/19HY 2018/19 Free Cash Flow
Adjusted Free Cash Flow CHF -31 million on back of higher
inventory catering for future volume growth
In CHF millions (6 month rolling)
+7,6%
-239
387 (PY -84)
359
-70 18 -31
(PY -71) (PY 5) (PY 103) -110
(PY -64)
-127
-141
(PY -106)
(PY 39)
EBITDA EBITDA Change in Interest Capex Others Adjusted Adjustment FCF
6m 6m Working Paid and FCF for beans Feb’19
Feb’18 Feb’19 Capital Income Feb’19 (RMI)
Taxes
26 Roadshow presentation HY2018/19Financial Review
Net Debt mostly increased due to IFRS 15 related higher working
capital and earlier dividend payment
In CHF millions
+696
+206
34 31 1.770
141
154 1.565
336
-932
1.074
838
(PY 743)
Net Debt IFRS 15 Dividend & pro forma Free Cash Acquisitions FX Impact Net Debt adjustment Adjusted
Aug ’18 adjustment Treasury Net Debt Flow for the (Equity & Other Feb ’19 for beans Net Debt
Shares Aug ’18 period Value) (RMI) Feb ’19
27 Roadshow presentation HY2018/19Financial Key Figures
Balance sheet
(in CHF millions) Feb 2019 Aug 18 Feb 18 Aug 18 Feb 182
Pro forma1 Pro forma1
Total Assets 6,820.4 6,169.0 6,444.3 5,832.0 6,105.9
Net Working Capital 1,762.1 1,403.4 1,426.1 1,074.4 1,087.7
Non-Current Assets 2,639.9 2,506.5 2,566.5 2,505.5 2,566.5
Net Debt 1,769.6 1,409.3 1,546.8 1,074.3 1,208.4
Adj. Net Debt3 837.7 616.0 743.3 616.0 743.3
Shareholders’ Equity 2,383.9 2,265.8 2,150.0 2,269.8 2,150.0
Debt / Equity ratio 74.2% 62.2% 71.9% 47.3% 56.2%
Adj. Debt / Equity ratio 35.1% 27.2% 34.6% 27.2% 34.6%
Solvency ratio 35.0% 36.7% 33.4% 38.9% 35.2%
Net Debt / EBITDA 2.0x 1.9x 2.4x 1.5x 1.9x
Adj. Net Debt / EBITDA3 1.0x 0.8x 1.3x 0.8x 1.3x
ROIC 12.5% 12.2% 11.2% 13.3% 12.3%
ROE 16.9% 15.7% 16.0% 15.7% 16.0%
1 Pro forma adjusted for IFRS 15 effect
2 See Half-Year Report 2018/19, Summary of Accounting policies – restatement and reclassification
3 Net Debt adjusted for cocoa beans considered as RMI
28 Roadshow presentation HY2018/19Strategy & Outlook
Strategy
Consistent long-term strategy – evolving execution

                           “Heart and engine of the
 Vision                 chocolate and cocoa industry”              Sustainable growth

                                                                   Margin accretive growth
                                        Expansion
                                                                   Accelerated growth in
                                                                   Gourmet, Specialties and
4 strategic                             Innovation      ‘smart     emerging markets
pillars
                                                         growth’
                                                                   Return on Capital and
                                      Cost Leadership
                                                                   greater focus on Free cash
                                                                   flow
                                      Sustainability
                                       Sustainability
                                                                   Talent & Team

 30 Roadshow presentation HY2018/19
Strategy
Pursuing the momentum
Innovation Expansion
• Drive premium range in Cocoa powders • Integration of Inforum in Russia,
• Leverage Innovation across segments complementary product and customer
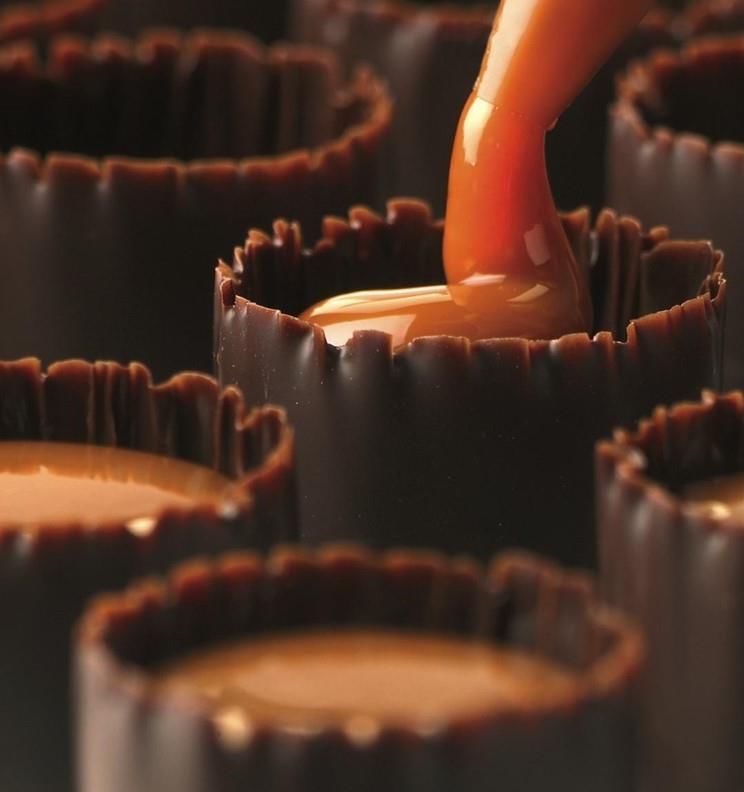
- Callebaut Ruby RB1, Caramel doré base in 2nd largest chocolate confectionery
- sugar-reduced solutions market worldwide.
• Leverage portfolio of Gertrude Hawk and • Garudafoods additional outsouring contract
d’Orsogna coming on stream H2 2018/19
• Further expansion of Chocolate Academy
Centers worldwide
• Africa SACO capacity expansion. Africa
chocolate market potential untapped
31 Roadshow presentation HY2018/19Strategy - Sustainability
Forever Chocolate: Our plan to make sustainable chocolate
the norm by 2025
Leading on carbon disclosure
• Barry in top 6Callebaut’s efforts to reduce its carbon
footprint awarded A- score by the Carbon Disclosure
Project (CDP) Our Goal Key Metric
• Ranking in top 6% of over 7,000 companies rated By 2025 we will be The carbon footprint of our
Carbon and forest supply chain from farm to
Positive. customer and number of
Cocoa and Forests Initiative: Barry Callebaut hectares of forest
regenerated.
publishes its Action Plan
Enabling KPI s
• By end 2019, 100% of farms and warehouses in direct C02e intensity per tonne of product.
% of raw material volume proven to be fee
supply chain mapped in Côte d’Ivoire and Ghana to from deforestation.
ensure no sourcing from protected forest areas
• Until 2022, distribute over 600,000 trees for cocoa
farmer crop diversification
• Until 2022, thousands of farmers trained on good
agricultural practices
32 Roadshow presentation HY2018/19Strategy - Cost Leadership
Schuldschein issue strengthens our
debt structure
• Average tenor is 7.8 years and has extended the
overall Group maturity to 5.5 years
• Attractive interest rate of 1.65% lowering average
cost of long-term debt
• The successful issuance reflects the trust of the
investors:
Within top three biggest transactions for
companies outside Germany
Schuldschein with longest tenors on average (8
years)
Global investor interest: Germany 38%,
Switzerland 21%, Asia 25%, RoW 16%
Largest CHF denominated Schuldschein (CHF
152m)
First Sustainable Schuldscheindarlehen ever
issued
33 Roadshow presentation HY2018/19Outlook
Confident outlook
Confident of reaching mid-term guidance
• Good visibility in portfolio and expected
acceleration in sales momentum make us
confident of delivering on our current mid-term
guidance.
New mid-term guidance 2019/20-2021/22
• Average volume growth +4-6%
• EBIT growth on average above volume growth1
1 in local currencies and barring any major unforeseen events
34 Roadshow presentation HY2018/19Appendix
Appendix
                                     What makes Barry Cllebaut
                                     unique?

                                     •   Global number one player in chocolate and cocoa

                                     •   Deep chocolate and cocoa expertise

                                     •   Global leader in Gourmet & Specialties

                                     •   Proven and long-term oriented strategy

                                     •   Unparalled global footprint, present in all key
                                         markets

                                     •   Preferred outsourcing and strategic partner

                                     •   Leader in Innovation

                                     •   Cost leadership along the value chain

                                     •   Pioneer in sustainability

                                     •   Entrepreneurial spirit

                                     •   Balancing short and long-term

36 Roadshow presentation HY2018/19
Appendix
Chocolate confectionery market development – Nielsen data
Western Europe (33% of market)
2013-18 average: -0.5%
2019 half-year: -1.0%
North America (22% of market)
2013-18 average: -0.4%
2019 half-year: +1.0%
EEMEA (24% of market)
2013-18 average: +0.3%
2019 half-year: +4.7%
Asia Pacific (14% of market)
2013-18 average: +3.2%
South America (7% of market) 2019 half-year: +8.6%
2013-18 average: -1.1%
2019 half-year: +1.2%
Source growth: Nielsen chocolate confectionery in volume – Aug 18 to Jan 19 – 25 countries
Source regional market shares: Euromonitor
37 Roadshow presentation HY2018/19Appendix
Our market and opportunities ahead
Global Chocolate confectionery volume growth
vs cocoa bean price
5 2 500
4 Forecast volume growth per application 2017-2022
2 000
3
Volume growth
GBP / tonne
2 1 500
1.4%
1 1 000
0 3.2%
500
-1
-2 0 3.4%
2011
2022
2023
2005
2006
2007
2009
2020
2008
2012
2013
2015
2017
2021
2010
2014
2016
2018
2019
Cocoa price Chocolate confectionery 1.7%
Growing economies with still low chocolate
consumption per capita 2.2%
6
Euro area
Consumption per capita in kg
5 1.0%
Russia
USA
4
1.9%
3
Emerging markets Absolute volume growth in tonnes
2
1 Brazil
China India
0 Source: Euromonitor
0 1 2 3 4 5 6 7 8
GDP % growth 2017-2022
38 Roadshow presentation HY2018/19Appendix
Strong global market leader in industrial chocolate and cocoa
Cocoa grinding capacity (kMT) Industrial Chocolate (open market – kMT)
BC BC
Cargill Cargill
Olam Fuji Oil
ECOM Puratos
Fuji Oil Cémoi
Guan Chong Clasen
Mondelez Schokinag
Nestlé Irca
Ferrero Kerry Group
BT Cocoa Guittard
Others Others
Note: Olam incl. ADM, Cargill incl. ADM chocolate business and SMET, Fuji oil incl. Harald and Bloomer, Irca incl. Doblar
Source: BC proprietary estimates
39 Roadshow presentation HY2018/19Appendix
West Africa is the world’s largest cocoa producer
Total workd harvest (17/18): 4,645 tsd MT
others 12%
Brazil* 4%
• About 70% of total cocoa beans are West
Ivory Coast* African Origin
Cameroon* 43%
5% • Barry Callebaut processed around 925,000
tonnes or approximately 20% of the world
Indonesia*
5% crop
• Barry Callebaut has various cocoa
Nigeria 6%
processing facilities in origin countries*, in
Europe and USA
Ecuador 6%
Ghana* 19%
Source: ICCO Forecast
40 Roadshow presentation HY2018/19Appendix
Increase in EBIT per MT thanks to improved product mix and
supportive cocoa processing market
312 312
EBIT per tonne
290 283 in constant currencies
282 279
274 271
EBIT per tonne
251 in CHF
286 231
219
256
223
Volume in kMT
2,036
1,914
1,834
1,795
1,717
1,536
1,379
1,269
1,210
41 Roadshow presentation HY2018/19You can also read