Gurit FY 2017 Results - Zurich, March 13, 2018
←
→
Page content transcription
If your browser does not render page correctly, please read the page content below
Gurit FY 2017 Results

Zurich, March 13, 2018
This presentation may include forward-looking statements
 that reflect the intentions, beliefs or current expectations
 and projections of Gurit Holding AG about the future results
 of operations, financial condition, liquidity, performance
 and similar circumstances.

 Such statements are made on the basis of assumptions and
 expectations which may prove to be erroneous, although
 Gurit Holding AG believes them to be reasonable at this time.

Slide 2                                                          Corporate
Gurit 2021 Strategic Ambitions
Gurit 2021 Strategic Ambitions
Key Markets for Gurit Advanced Composites
Wind, Aerospace and Automotive – 3 key strategic growth markets
Marine and Industrial – 2 key niche markets
Achieve leading market shares in each niche we operate in
Sales Growth Ambition by 2021 at ca. CHF 500 million
Organic growth to ca. CHF 450 million
Acquisitive growth to add ca. CHF 50 million
Operating Profitability Ambition Range is at 8-10% RoS, target upper end
Shareholder Dividend Pay - Out Ratio
Pay-out ratio of 30-40% of NIAT per annum
Slide 4 Corporate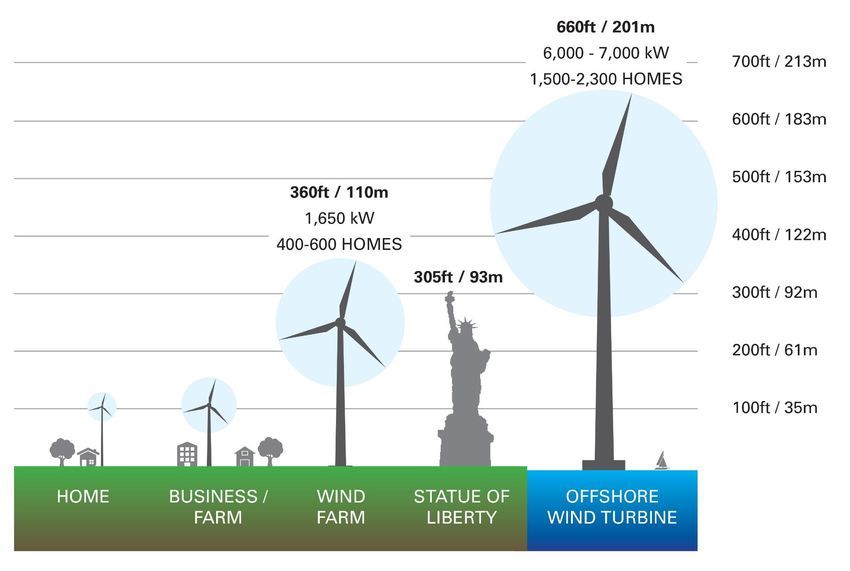
Gurit Strategy 2021 – Key Stepping Stones
Key Product Innovations:
The market leading Core material range for Industry/Marine/Wind
Leading lightweight TMC/Prepreg/Filming range for our markets
Vitalize Formulated Product range – Laminating resins, Adhesives
Aero: Organically grow in EU and US; “Downstream “ acquisitions if targets fit
Tooling:
Win more global/regional customers
Reduce mould installation time by 50% and cost per mould by 10%
Establish strong Composite Mineral Casting business in Europe and China
and enter the ca. 100 MCHF market globally
Automotive: Complete industrialisation steps by 2018; Introduce low cost
material range in 2018; Component volume growth as of now
Acquisitions: Growth acceleration (2018+) depending on suitable opportunities
Slide 5 Corporate
Gurit FY 2017 Business Update
Key Business Notes FY 2017
2017 was a good year for Gurit – given the headwinds in India/China and ME
3% Topline Growth and
10% Operating Profit including almost 1% ROS of one-time restructuring
cost in the UK
Highlights and Lowlights:
+ Tooling: Another record year – across all relevant metrics
+ Tooling: Acquisition of PH Windsolutions
+ Mineral Casting start in China and Europe
+ Wind: Novel Balsa Lite developed and Green PET launched
+ Aero: Qualification with US OEM achieved
+ Automotive Components with strong order intake
(-) Wind: Weak sales – ¾ year demand halt in India, weaker CN
(-) Industry: Weak demand in construction industry (liquidity issue)
Operations
Concentration of Non-Aero Prepreg production in Spain for cost/less
complexity
Slide 7 Corporate
Key Financial Notes FY 2017
Growth: +3.1% (+2.4% in reported CHF) to CHF 360.5m (FY 2016: 352.0m)
Operating Profit and RoS: CHF 35.9m (FY 2016: CHF 36.8m) and 10.0%
(FY 2016: 10.5%) – target met for the third consecutive year
Investment:
Capex of 11.7m (FY 2016: 10.5m) mainly Tooling, PET, Hungary
R&D investment in 2017 on similar level as 2016 (1.9% of net sales)
Balance Sheet and Cash Flow KPI:
Operating Cash Flow of CHF 30.6m (FY 2016: 37.9m)
Net Cash Position of 32.7m (FY 2016: 37.2m)
Equity Ratio at 71.1% of total assets (FY 2016: 76.6%)
Slide 8 Corporate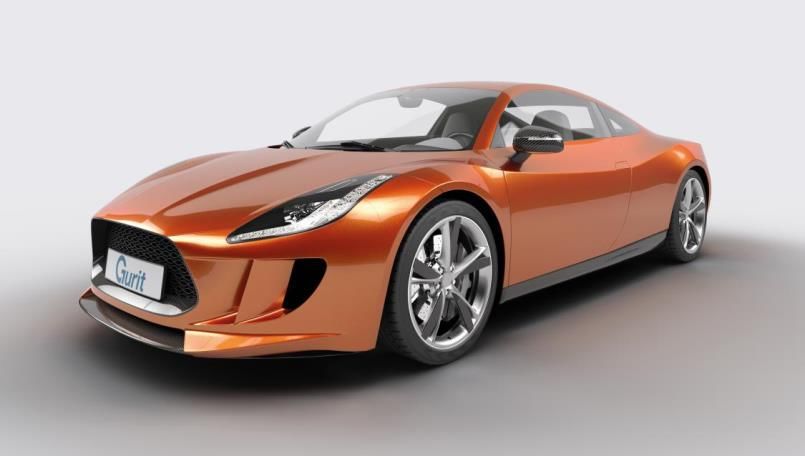
Development by Key Markets
Wind Energy – Market Trends
Short-term situation: Capacity Installed Annually*
Volume correction 2016/2017 versus 80
63 63 65
record year 2015 60 52 55
49
40
20
Long-term trends favouring wind: 0
Decarbonisation 2015 2016 2017 2018 2019 2020
* Source: MAKE Global Wind Power Q3-2017
De-centralisation
Digitalisation
=> ¾ of global investment in
new power generating
technology by 2040 will be from
renewable sources (BNEF 2017)
Slide 10 CorporateWind Energy – Market Trends
Development by 2020:
Auctions drive price/kWh below non-renewable benchmark of 4ct/kWh
Further 20-30% cost-out challenge for the industry by ca. 2020:
bigger turbines (4MW+ onshore, 6MW+ offshore) and
cost-out exercises along the entire value chain
Industry has chance for strong “un-subsidized” volume growth once this
efficiency level is met by 2020+, even with PTC expiring in the US
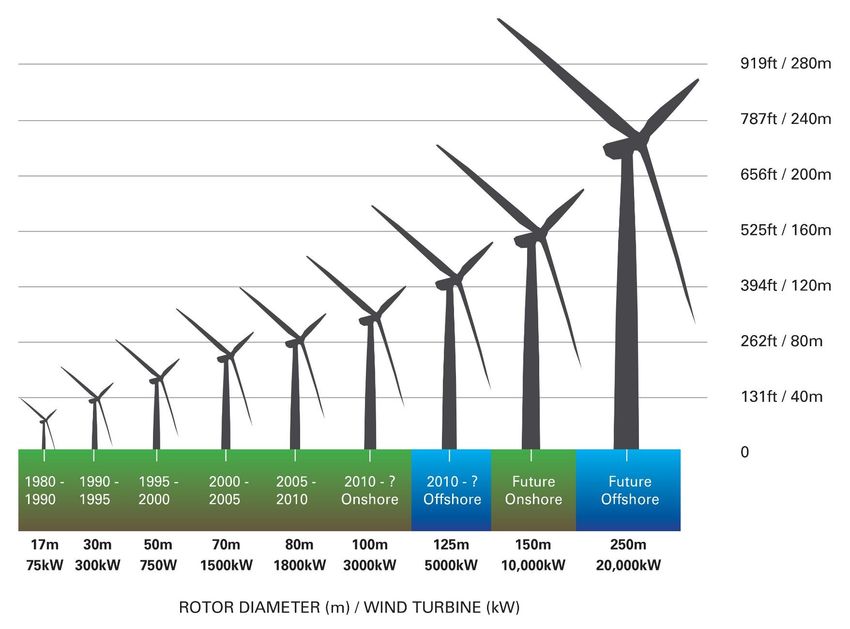
Slide 11 CorporateWind Energy – Turbine Size: The Key Performance Increase Factor Slide 12 Corporate
Wind Energy – Turbine Size:
 The Key Performance Increase Factor
   Past and Present Wind Turbine Sizes

Slide 13                                 Corporate
Wind Energy Materials – Results & Outlook
Results & Achievements FY 2017 Wind Energy: Quarterly Net Sales
MCHF
50
39,8 39,1
40 36,4 36,1
Net Sales: CHF 128.2m (FY 2016: 149.0m) 33,7 33 31,6
27,5
Decline by 13.9%; volume and price drop 30
India: halt for ¾ of CY 2017 – auctions introduced 20
10
CN: marked compression in 2017
0
Q1 Q2 Q3 Q4 Q1 Q2 Q3 Q4
Key Business Steps 2017: 2016 2017
Balsa Production JV in Indonesia founded
Green PET developed with USP
Balsa low resin uptake product developed
Prepreg factory consolidation into 1 site in Spain started
Business Focus 2018
Coated Balsa/Green PET – core for future introduction
Volume growth India, market share growth PET/Balsa
Innovation for cost out (PET, Pregreg, Formulated) and
future property improvement
Slide 14 CorporateTooling – Results & Outlook
Results & Achievements FY 2017
Net Sales: CHF 91.8m (FY 2016: CHF 69.0m)
Increase by 33.1% (currency-adjusted: 35.5%)
New major global customer win helps growth
Offshore maxi blade demand in China strong
Key Business Steps 2017:
Capacity expansion – new bay built
PH Windsolutions acquisition
Mineral Casting – new business started
MCHF Tooling: Quarterly Net Sales
Business Focus 2018 40
30,7
Win 2 more global wind customers 30 25,5
20,5 18 20,5
20 16,3 14,2 15,2
PH Windsolution integration into Tooling
10
Maxi blade mould market share growth
0
Offering expansion: Transport devices Q1 Q2 Q3 Q4 Q1 Q2 Q3 Q4
2016 2017
development
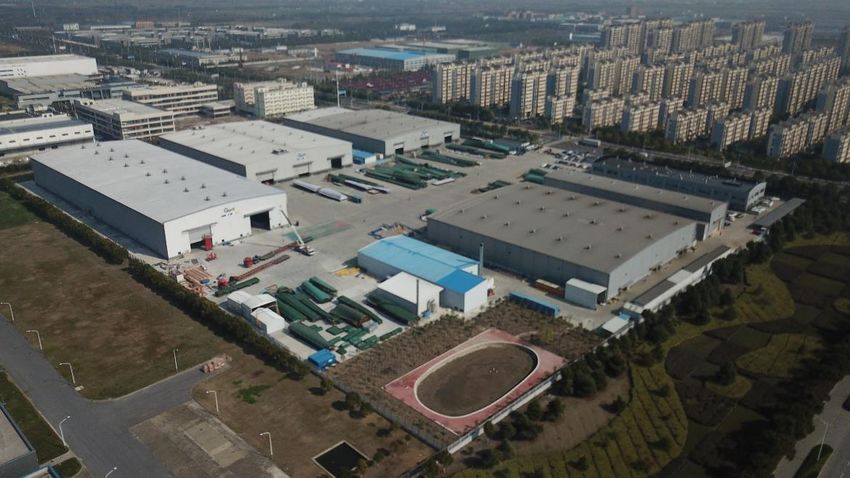
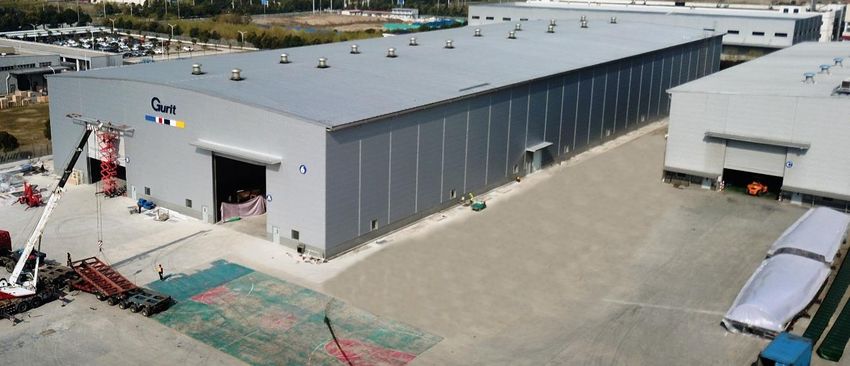
Slide 15 CorporateTooling – Taicang Plant
Gurit Tooling Campus Taicang
New 150x56m hall
= 8400m2
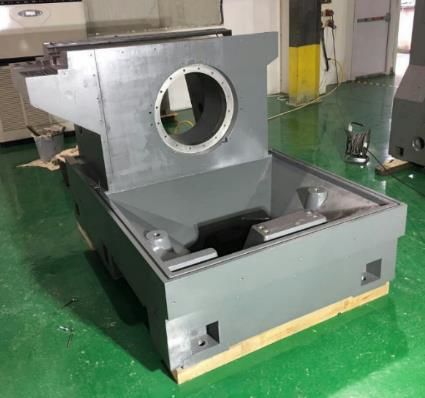
Slide 16 CorporateTooling – Global Footprint & Mineral Casting
Gurit Tooling Global Footprint
Composite Mineral
Casting machine beds
Slide 17 CorporateAerospace – Market Trends
Airbus Commercial Aircraft Units Deliveries* Boeing Commercial Aircraft Units Deliveries**
1000 1000
500 500
0 0
2012 2013 2014 2015 2016 2017 2012 2013 2014 2015 2016 2017
* Source: Airbus ** Source: Boeing
ICAO expects number of passengers globally to grow from 3.8 billion in 2016 to about
10 billion by 2040
Commercial aerospace market expected to continue to grow at a CAGR of 4.6% to 2020
according to DTTL / Deloitte Global
Use of advanced composite materials per aircraft increasing steadily
Slide 18 CorporateAerospace – Results & Outlook
Results & Achievements FY 2017 Aerospace: Quarterly Net Sales
MCHF
20
Net Sales: CHF 47.0m (FY 2016: 47.6m) 12,6 11,7 12,7 13,8
10,6 11,3 11,4 10,5
Slight decrease due to supply chain issues
10
(engine delivery) at European OEM in Q4
A380 build rate impact
0
Q1 Q2 Q3 Q4 Q1 Q2 Q3 Q4
Key Business Steps 2017: 2016 2017
Qualification with US OEM completed
Started seat material qualification
Innovation programs for industrialized prepregs
to create faster customer parts production.
Kassel site building/set-up improvements
Business Focus 2018
Complete set-up of supply chain for US market
Qualification with further EU customers
Further enhancement and broadening of product
offering – low heat release epoxy development
Slide 19 CorporateOther Material Markets – Market Trends Marine superyacht and leisure segments with good demand in 2017; markets projected to continue to grow on a moderate single digit level Middle Eastern composite construction industry hit by the Saudi cash shortage causing project halts; market expected to resume and diversify further into new projects 2018+ Overall, use of advanced composites is entering more and more applications and market segments – e.g. agricultural equipment structures, structural lightweight sandwich structures Slide 20 Corporate
Other Material Markets – Results & Outlook
Results & Achievements FY 2017
Net sales: CHF 71.1m (FY 2016: CHF 69.0m) Other Material Markets:
Quarterly Net Sales
Increase by 3.1% (currency-adjusted: +4.6%) MCHF
mainly due to slight growth in marine industry 30
20,1 18,1 17,4 17,5 17,9 16,7 19
ME construction market demand halt 20 13,4
(ca. - 8% impact vs PY) 10
Industrial sales growth counterbalancing ME decline 0
Q1 Q2 Q3 Q4 Q1 Q2 Q3 Q4
Key Business Steps 2017 2016 2017
Stronger presence in superyacht and race boat market
(engineering and material)
Core material finishing partnership in Europe enabling
stronger customer service/sales – we grow
Innovation effort for new product launches 2018:
property, cost and H&S improvements
Business Focus 2018
New product launches
Push industrial applications with core and prepreg
material range (sandwich panels, lightweight
equipment, non-leisure marine )
Slide 21 CorporateAutomotive – Market Trends Sustainability policies and stricter emission targets drive need to reduce fuel consumption which can be easiest achieved through weight reduction Electrification drives need to reduce car body weight fostering use of lightweight technologies Use of advanced composite materials for weight reduction and design purposes is continuously increasing on a moderate level, in particular in the super-premium and premium segments Slide 22 Corporate
Composite Components – Results & Outlook
Results & Achievements FY 2017
Net sales: CHF 22.3m (FY 2016: 17.4m)
Strong sales and strong order intake
Operations:
Industrialisation CAPEX started to implement
Development of low cost materials for cost out
Improved financial result to EBITDA B/E
Focus 2018
Maintain strong project and order pipeline
MCHF Composite Components: Quarterly Net Sales
Complete industrialization of Hungarian
10 7,4
production site
5 4,4 4,7 4,8 5 5
3,3
0
Q1 2016 Q2 Q3 Q4 Q1 2017 Q2 Q3 Q4
Slide 23 CorporateFinancial Results FY 2017
Net Sales Analysis by Markets
Net sales in MCHF
Overall currency-adjusted
growth of 3.1% in net sales
352.0 360.5
Materials Components Tooling
Composite Materials
hampered by lower wind
182.3 169.7 175.2 185.3 energy capacity additions
Composite Components
on growth track
1HY 2016 2HY 2016 1HY 2017 2HY 2017 FY 2016 FY 2017
Tooling reports yet another
record year
Net sales by markets 2017 2016 ∆ 2017 ∆ 2017
in MCHF vs 2016 vs 2016
FX adj.
Wind Energy 128.2 149.0 -13.9% -13.8%
Other Material Markets 118.2 116.6 1.3% 1.8%
Composite Materials 246.4 265.6 -7.2% -7.0%
Composite Components 22.3 17.4 28.3% 31.5%
Tooling 91.8 69.0 33.1% 35.5%
Total Net Sales 360.5 352.0 2.4% 3.1%
Slide 25 CorporateOperating Profit and RONA Development
Operating profit (% Net sales) FY Operating profit at 10.0%,
RONA (incl. Goodwill) delivering on the profitability
RONA (excl. Goodwill) target for the third consecutive
21,1%
year
18,2% 17,7%
18,6%
17,6%
2HY 2017 impacted by:
18,3% 14,1%
15,7%
One-off items
15,9% 15,4% 16,1%
15,0% Bad debts provision
13,7%
12,1% increases
Demand pause from
12,1%
10,5%
10,5%
10,4%
10,0%
9,2%
7,9%
Indian Wind Market
Higher raw material cost
1HY 2HY 1HY 2HY FY 2015 FY 2016 FY 2017
2016 2016 2017 2017
RONA slightly decreased due
to higher asset basis (Fixed
assets and Net Working
Capital)
Slide 26 CorporateOperating Profit Bridge FY 2016 to FY 2017
45
in MCHF
40 5,1 -4,8
10.5% 10.0%
-1,7 0,2
3,5 -1,0
35 -2,9
0,7
30
25
20
36,8 35,9
15
10
5
0
Operating Volume Sales price Purchase Material Operational Bad debts One-offs Other Operating
profit 2016 and changes, price usage efficiencies (Delta effects profit 2017
product net changes, efficencies and loading 2017 vs
mix net 2016)
Slide 27 CorporateIncome Tax Expense
in MCHF
11
27%
10
9
8 2,1
20%
1,1 -0,5
7
6
5
9,3
4
6,7
3
2
1
0
Not Other Not
Tax expense at Actual tax
capitalized effects, recoverable
average expected expense
tax losses net WHT on IC
rates
dividends
Income tax expenses burdened by unfavorable effects from not
capitalized tax losses and not recoverable taxes on intercompany
dividends.
Slide 28 CorporateIncome Statement
Consolidated Income Statement 2017 2016 Variance
MCHF % NS MCHF % NS MCHF %-pts
Net sales 360.5 100.0% 352.0 100.0% 8.5 0.0%
Cost of goods sold -271.6 -75.3% -264.4 -75.1% -7.3 -0.2%
Gross profit 88.9 24.7% 87.6 24.9% 1.3 -0.2%
Research and development expense -6.9 -1.9% -6.9 -2.0% 0.0 0.1%
Selling expense -16.6 -4.6% -17.4 -4.9% 0.8 0.3%
Administrative expense -23.5 -6.5% -23.0 -6.5% -0.4 0.0%
Other operating income and expense, net -6.0 -1.7% -3.4 -1.0% -2.5 -0.7%
Operating profit 35.9 10.0% 36.8 10.5% -0.9 -0.5%
Finance result -1.7 -0.5% -0.8 -0.2% -0.9 -0.2%
Taxes -9.3 -2.6% -10.0 -2.8% 0.6 0.2%
Profit for the year 24.9 6.9% 26.0 7.4% -1.1 -0.5%
Earnings per bearer share CHF 53.32 CHF 55.64
Distribution per bearer share CHF 20.00 CHF 20.00
Stable Operating profit margin and Net result
Distribution per bearer share stable at CHF 20.00.
Slide 29 CorporateBalance Sheet
Consolidated Assets Dec 2017 Dec 2016 Variance
MCHF % MCHF % MCHF %-pts
Cash and cash equivalents 44.6 15% 38.6 16% 5.9 0%
Trade receivables 72.9 25% 61.3 25% 11.6 1%
Inventories 61.0 21% 46.2 19% 14.8 2%
Other current assets 22.7 8% 20.5 8% 2.2 0%
Deferred income tax assets 4.0 1% 2.9 1% 1.0 0%
Property, plant and equipment 76.4 26% 73.0 29% 3.4 -3%
Intangible assets 6.3 2% 5.8 2% 0.5 0%
Other non-current assets 2.1 1% 0.8 0% 1.3 0%
TOTAL ASSETS 289.9 100% 249.1 100% 40.8 0%
Consolidated Liabilities and Equity Dec 2017 Dec 2016 Variance
MCHF % MCHF % MCHF %-pts
Borrowings 11.9 4% 1.4 1% 10.4 4%
Trade payables 31.9 11% 22.7 9% 9.1 2%
Other current liabilities 31.8 11% 29.3 12% 2.4 -1%
Deferred income tax liabilities 4.7 2% 2.6 1% 2.2 1%
Provisions 3.5 1% 2.1 1% 1.4 0%
Other non-current liabilities 0.0 0% 0.1 0% -0.1 0%
Equity 206.1 71% 190.8 77% 15.3 -5%
TOTAL LIABILITIES AND EQUITY 289.9 100% 249.1 100% 40.8 0%
Trade working capital temporarily increased to 28% of net sales (2016 year-end: 24%)
Solid balance sheet: Net cash of CHF 33m, Equity ratio of 71% and Quick Ratio of 180%
Slide 30 CorporateCash Flow
Consolidated Cash Flow 2017 2016 Variance
MCHF MCHF MCHF
EBIT 35.9 36.8 -0.9
Depreciation, amortisation, impairment 10.8 11.7 -0.9
Change in working capital -9.1 0.8 -9.9
Other cash flow from operating activities -7.0 -11.4 4.4
Net cash flows from operating activities 30.6 37.9 -7.3
Purchase of PPE and Intangibles -11.7 -10.5 -1.2
Proceeds from sale of PPE 0.1 0.1 0.0
Free Cash Flow 18.9 27.5 -8.6
Business acquisition -12.6 -1.8 -10.9
Loans granted, net of repayments -1.4 -0.4 -1.0
Change in borrowings 10.3 -7.9 18.2
Distribution to shareholders -9.3 -7.0 -2.3
Purchase of treasury shares -0.9 -0.6 -0.3
Change in Cash and cash equivalents 5.0 9.8 -4.9
Operating cash flow burdened by temporary increase of working capital
Capital investments mainly relate to capacity increases in Tooling, PET and automotive
body panels production
Business acquisition relates to the acquisition of the business of PH Windsolutions
Borrowings increased to fund the business acquisition
Slide 31 CorporateFinancial Results FY 2017 Conclusion
Outlook 2018
Net Sales
Low single-digit revenue growth expected for FY 2018
Operating Profitability
Score again at the upper end of the target range of 8-10%
operating profit margin for FY 2018
Slide 33 CorporateQuestions?
You can also read