SCANSHIP HOLDING ASA 1H 2017 - Presentation - 29 August 2017 Henrik Badin, CEO Erik Magelssen, CFO
←
→
Page content transcription
If your browser does not render page correctly, please read the page content below
SCANSHIP HOLDING ASA
1H 2017 - Presentation
29 August 2017

Henrik Badin, CEO
Erik Magelssen, CFO

                      1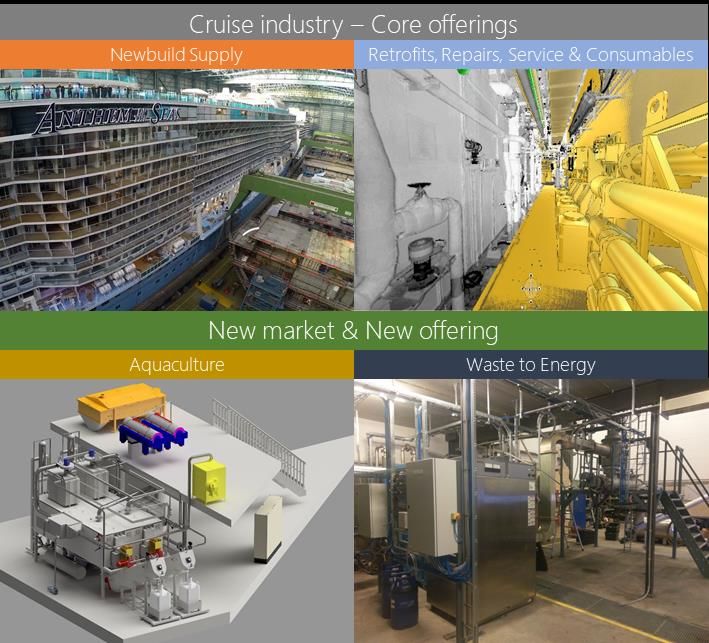
Disclaimer
     This presentation (the “Presentation”) has been produced by Scanship Holding ASA ("Scanship" or the "Company") exclusively for information purposes.

     This Presentation includes forward-looking statements regarding Scanship, including projections and expectations, which involve risk and uncertainty. Such
     statements are included without any guarantee as to their future realization. Although Scanship currently believes that the expectations regarding the Company
     reflected in such forward-looking statements are based on reasonable assumptions, no assurance can be given that such projections will be fulfilled. Any such
     forward-looking statement must be considered a long with the knowledge that actual events or results may vary materially from such predictions due to, among
     other things, political, economic, financial or legal changes in the markets in which Scanship does business, and competitive developments or risks inherent to the
     Company’s business plans. Many of these factors are beyond Scanship’s ability to control or predict. Given these uncertainties, readers are cautioned not to place
     undue reliance on any forward-looking statements. Accordingly, the Company does not accept any responsibility for the future accuracy of the forward-looking
     statements expressed in this Presentation or the actual occurrence of the forecasted developments. The Company does not intend, and does not assume any
     obligation, to update any such forward-looking statements as of any date subsequent to the date hereof.

     No representation or warranty (express or implied) is made as to, and no reliance should be placed on, any information, including, without limitation, projections,
     estimates, targets and opinions, contained herein, and no liability whatsoever is accepted as to any errors, omissions or misstatements contained herein, and,
     accordingly, the Company does not accept any liability whatsoever arising directly or indirectly from the use of this Presentation.

     By receiving this Presentation, the recipient acknowledges that he will be solely responsible for its own assessment of the market and the market position of the
     Company and that he will conduct his own analysis and be solely responsible for forming his own view of the potential future performance of the businesses of the
     Company. This Presentation must be read in conjunction with the recent financial information, as well as other publicly disclosed information.

     Nothing in this Presentation, nor any other information provided to the recipient by the Company or any of its advisers constitutes, or may be relied upon as
     constituting, investment advice or any financial, tax or legal advice by such persons or anybody else.

Source: Company data

                                                                                                                                     2
About the company
•   We provide world leading solutions for cleaner oceans
•   System portfolio includes wastewater purification, food
    waste processing, garbage handling and sludge
    treatment sold separately or bundled as total clean
    ship solutions
•   We have equipped more than 100 cruise ships holding
    a historical share of a third of this market since 1995
•   Forward order backlog includes systems to 25 new
    cruise ships for deliveries until 2022
•   Every second cruise newbuild delivered from 2014 are
    equipped with our wastewater treatment systems
•   We have recently entered the aquaculture market with
    sludge treatment as part of RAS technology on smolt
    facilities
•   We are developing new technology to convert waste
    into energy improving environmental impact and
    reducing cost of operations

                             3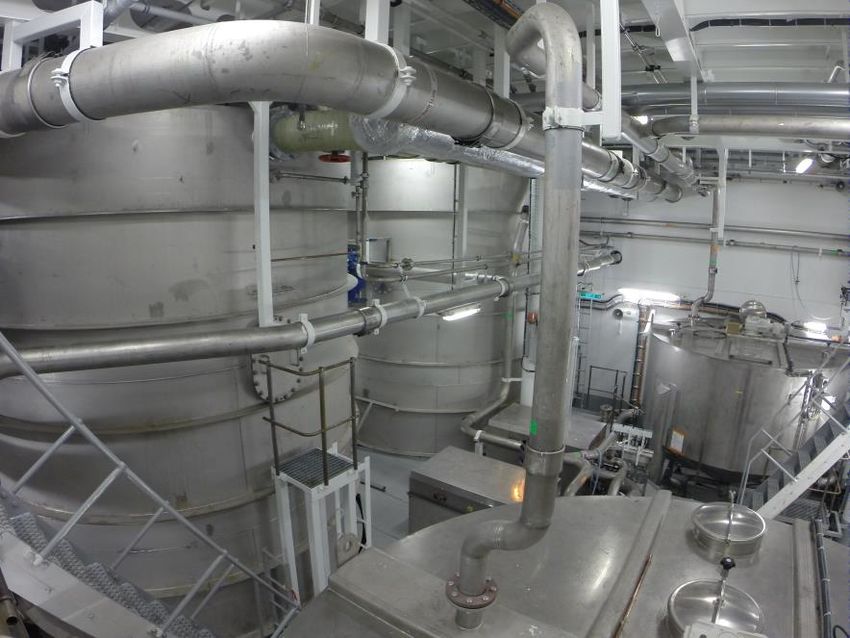
Strong financial improvement
                                     Revenue (MNOK)

                                            104.4
                                                                          117.2
                                                                                   •   Best half year result since listing in 2014
                                  95.9
                                                                86.8
                                                                                   •   Back on growth-track driven by system deliveries to
                                                      84.8                             newbuilds
                        78.9

          66.7                                                                     •   EBITDA margin reaching acceptable levels and on its
                                                                                       way to double digit

        1H 2014        2H 2014   1H 2015   2H 2015   1H 2016   2H 2016   1H 2017   •   Last years “drop” caused by temporary aggressive
                                                                                       competition in cruise newbuild space
                                  EBITDA (MNOK) & (%)

                                                                           10.5
                                             8.2

                                   3.2
                         1.5
          0.6                                          0.5

                                                                -3.9

       1H 2014         2H 2014   1H 2015   2H 2015   1H 2016   2H 2016   1H 2017

Source: Company data                                                                                              4
All-time high order backlog
                                   Order backlog development

MNOK
                                                                                              •   All-time high backlog at MNOK 360

 400
                                                                                   360        •   Seven total clean ship contract awards for cruise
 350                                                                                              newbuilds during first half year:
 300
                                                                        250
                                                                                                   • 3 off Virgin Voyages at Fincantieri
 250                                  221         226
                                                             198
                                                                                                   • 2 off MSC Meraviglia Plus at STX France
 200                       185
                                                                                                   • 2 off Hapag Lloyd Cruises at Vard (Fincantieri)
 150
              100                                                                             •   Two sludge treatment contract awards in Aquaculture
 100
                                                                                                  during first half year:
   50

    0
                                                                                                   •   Salangfisk & Sjøtroll/Lerøy
           1H 2014       2H 2014    1H 2015    2H 2015     1H 2016    2H 2016    1H 2017
                                                                                              •   One foodwaste contract award with STX France for
                    Orderbook does not include the activities within the Aftersales segment       Aircraft Carrier in June

Source: Company data

                                                                                                                           5
Increased revenues within Cruise newbuilds
                           Business area: Projects

MNOK
        System sales to cruise newbuilds (to shipyards), systems as retrofits
        (to shipowner) and system sales to clients in the aquaculture market     •   Revenue growth in Projects with system delivery to
  80                                                                                 cruise newbuilds
  60                                                                             •   Aquaculture revenue was ~10% in the period
  40
                                                                                 •   Without AWP (wastewater treatment) retrofit revenue
                                                                                     during first half year as market is “slow” (temporary
  20                                                                                 shift of investments towards Exhaust Gas Cleaning)
   0                                                                             •   Aftersales expected to increase steadily as installed
          1H 2015        2H 2015        1H 2016        2H 2016        1H 2017        base of Scanship systems is increasing (+20% next
                                                                                     two years)
                           Business area: Aftersales
MNOK
        Sales of spareparts, equipment, service, repair work and chemicals       •   Seasonal effects are present in Aftersales as more
  50
        to owners operating Scanship systems                                         purchases are being made in second half of the year

  40
                                                                                 •   Last year’s restructuring within Aftersales has
                                                                                     improved net margins in operations significantly,
  30                                                                                 however some short term effects has reduced
  20
                                                                                     revenues in service and repair jobs

   10
                                                                                 •   Total sales volume in Aftersales is increased with
                                                                                     higher sale of spare parts and chemicals
   0
          1H 2015        2H 2015        1H 2016        2H 2016        1H 2017

                          Revenue (MNOK)          Gross profit

                                                                                                               6
Improved efficiency in execution
Profit & Loss statement
Unaudited Unaudited Audited
(MNOK) 1H 17 1H 16 2016 • Significant stronger EBITDA from improved efficiency in
Total operating revenue 117.2 84.8 171.6 operations and higher revenues
Cost of goods sold -82.7 -58.5 -123.6 • Reduced operating expenses from restructuring during
Employee expenses -13.3 -14.4 -28.1
second half of last year
Other operating expenses -9.4 -11.4 -22.5
E BITDA before non-recurring items
EBITDA margin before non-recurring items
11.9
10.2 %
0.5
0.6 %
-2.6
-1.5 %
• Non-recurring costs of MNOK 1.4 related to the strategic
Non-recurring items -1.4 0.0 -0.8
review process concluded in May 2017 reduced EBITDA
E BITDA 10.5 0.5 -3.4 down to 8.9% from 10.2%
EBITDA margin 8.9 % 0.6 % -2.0 %
Depreciation and amortisation -1.2 -1.1 -2.4
Operating result (E BIT) 9.2 -0.6 -5.8
Net Financial items -1.1 0.8 0.7
Result before tax 8.2 0.3 -5.1
7Statement of financial position
Balance sheet
Unaudited Unaudited Audited
( MNOK) 30.06.17 30.06.16 31.12.16 • The non-current assets per 30.06.17 includes:
ASSE TS:
Total non-curre nt asse ts 33.8 31.5 32.6
• MNOK 3.5 in fixed assets
Curre nt asse ts:
• MNOK 30.3 in intangible assets, of which the
Inventories 4.9 7.1 3.5 development costs for the MAP system is the
Trade receivables
Contracts in progress
66.9
25.0
53.1
29.0
57.8
14.2
most significant
Other Receivables
Cash and cash equivalents
16.5
2.8
15.5
2.0
13.9
3.6 • Payment of MNOK 19 (Euro 2.0 mill) received from
Total curre nt asse ts 116.1 106.8 93.0 one customer just subsequent to Q2 (on 5 July)
Total asse ts 149.9 138.3 125.6 related to overdue trade receivable as per 30.06.17
E QUITY AN D LIABILITIE S
• Non-current liabilities per 30.06.17 primarily consist
Total e quity 51.1 50.1 45.4 of deferred tax liability of MNOK 4.7
Total non-curre nt liabilitie s 6.0 5.1 4.1
• Equity ratio is 34 % per 30.06.17
Curre nt liabilitie s
Trade creditors 27.2 28.9 31.5
Contract accruals 17.6 13.5 8.2
Financial instruments 3.5 4.9 1.8
Income tax payable 0.9 0.3 0.5
Bank overdraft 31.7 24.1 23.9
Other Current liabilities 11.9 11.3 10.2
Total Curre nt Liabilitie s 92.8 83.1 76.1
Total liabilitie s 98.8 88.2 80.2
Total e quity and liabilitie s 149.9 138.3 125.6
8Cash flow in current operations
Cash flow statement
(MNOK)
Unaudited Unaudited A udited
1H 17 1H 16 2016
• Cashflow from operations in 1H 2017 improved to
MNOK 12.9 when including payment received
Result before tax 8.2 0.3 -5.1 early July on overdue receivable per 30.06.17
Net cash flow from operating activities
Net cash flow from investing activities
-6.1
-2.5
-10.3
-5.1
-5.8
-7.4
• Compared to the reported EBITDA of MNOK 10.5
Net cash flow from financing activities 7.8 -2.0 -2.8
in 1H 2017, the MNOK 12.9 adjusted level gives a
Net change in cash and cash equivalents -0.8 -17.4 -16.0 positive EBITDA to operating cash flow conversion
Cash and cash equivalents at start of period 3.6 19.5 19.5 in 1H 2017
Cash and cash equivalents at end of period 2.8 2.0 3.6
• Long-term outstanding receivable on German VAT
(MNOK 5) also collected in July 2017
• Positive cash flow from financing activities is the
increase in the bank overdraft, including the
increased limit
9Outlook
Innovations & Markets
10Game changing technology being developed
• We are developing a game changing technology for
waste handling representing future growth
opportunity not only in cruise but several other
markets
• Our innovation is based on microwave assisted
pyrolysis, hence the name Scanship MAP
• The solution converts garbage, foodwaste and sludge
from wastewater into energy that will significantly
reduce aboard fuel consumption (HFO and MGO)
and eliminate discharge to sea
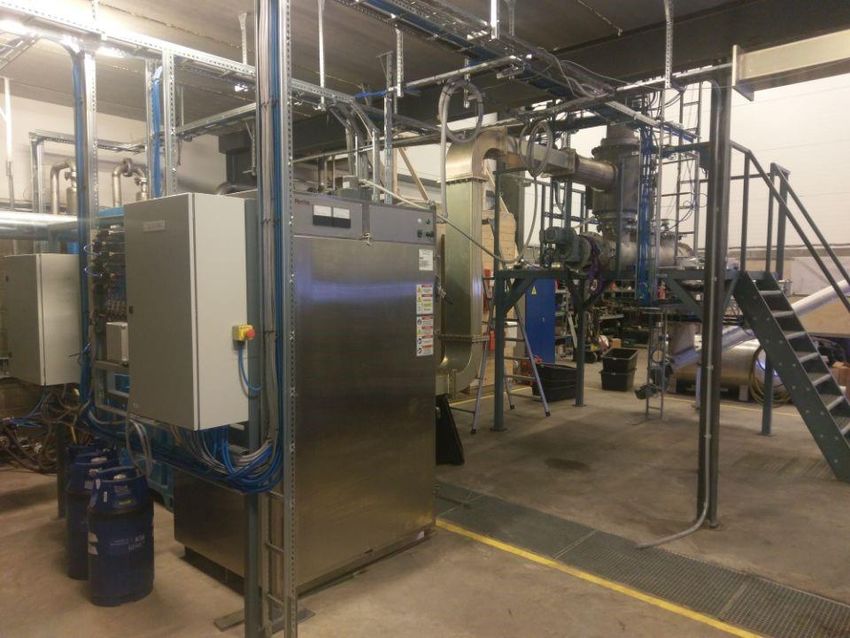
• A full scale Scanship MAP test facility is up and
running in Norway to complete development and
Scanship MAP test facility in Norway commercialization
• There is strong interest in MAP, and several of largest
shipowners and yards is currently evaluating for
future newbuilds and retrofits
11Cruise industry is growing with more newbuilds
Million Annual number of cruise passengers
30,0
• A steady ~ 7% growth of passenger drives the
25,0
market for newbuilds and ship upgrades
20,0
15,0
• Industry orderbook comprises 87 vessels with
delivery until 2026
10,0
5,0 • More ships are being built to meet supply demand
0,0
in Asia Pacific region
• There is an increased demand for high-end waste
and wastewater management systems to improve
#Newbuilds Ocean going cruise ships delivered to market overall environmental sustainability in industry
20
18 • Annual forward newbuild market for clean ship
16 Average 14 vessels systems is expected to reach ~NOK 400 in which
14
Aftermath 9-11 2001
Scanship in recent years has increased market share
12 Aftermath 2008
10
financial crises
• Future deployment on waste to energy systems will
8 increase market size for clean tech solutions
6
4
2
0
Source: Cruise Industry News, 2017-2018 Annual Report, CLIA 12Huge untapped potential
for retrofits in Cruise
Cruise ship market
deployment of #Ships • IMO Marpol has enforced new discharge standard for
wastewater treatment 315 wastewater in the Baltic sea (2021) referred to as the
systems Helcom standard
Other cruise ships
• Scanship is the only supplier to date having wastewater
without AWP
105 treatment systems in Helcom compliant operations on
large cruise ships
• Total market for wastewater treatment on existing world
cruise fleet is estimated at Billion NOK ~ 4 - 5
Main cruise ship
market without AWP
100 • Implementation of Helcom standards is expected to be
adopted as industry standard for existing ships as
already adopted on newbuilds from 2012
Equipped with Alaska AWP
• We have delivered 26 turn-key AWP retrofits as market
80 leader
Equipped with Helcom AWP 30
• Scanship’s MAP technology with attractive ROI and high
environmental impact will be applicable for future
retrofits on all existing cruise ships
Total cruise fleet
2016
Source: Company data 13Growth opportunities in Aquaculture
CAPEX in new smolt facilities in Norway
• We are positioning in the Norwegian aquaculture
1 400 market, with orders to some of the largest smolt
facility newbuilds to date; Steinsvik, Salangfisk and
1 200 30-50% Sjøtroll
MNOK 1 000
per year • Aquaculture market for water treatment and sludge
800 handling is growing as the industry is moving towards
1 329 a more environmental sustainable production
600
400 793
1 118
• Long term industry growth targets will require an
722 687
568
annual increase of production between 7 – 10% (3-5
200 358 313 347 358
493 million tons by 2030)
- • Growth in water treatment and sludge handling will in
addition be driven by large investments in post smolt
~Estimated share of water treatment and sludge handling
production, upgrades of existing facilities, and how
fast fishfaming will move onshore or towards
seabased closed cage systems to reduce mortality
Number of licensed production units in Norway (down from ~ 20% mortality level)
Smolt facilities (2016): 220 • Sludge treatment on fishfarms (full grow out) is
Salmon Fishfarms (2016): 990 expected to require ~20 times more capacity
Recirculating Aquaculture Systems (RAS) on smolt (2015): 70
compared to smolt facilities
Source: Almås et al, 2013, «Verdiskapning basert på produktive hav i 2050», Source: SSB, table: 03291: Aquaculture. Salmon and trout
farming. Investments in fixed assets. New Smolt facilities, Fiskehelserapporten 2016 Veterinærinstituttet rapportserie nr 4/2017
14Key takeaways
• Best half year results since listing in 2014, EBITDA
margin reaching acceptable levels and on its way
to double digit
• Improved efficiency in execution has reduced
other operating expenses and employee costs
while revenues have increased by 38%
• Order backlog at all time high at MNOK 360
• Strong interest from world leading players for our
game changing MAP technology
Scanship wastewater treatment system on RCCL Quantum of the Seas
15Thank you for your attention!
Investor Relations Contact: Scanship Holding ASA
Lysaker Torg 12
Erik Magelssen, CFO P.O. Box 465
Mobile: + 47 92 88 87 28 1327 Lysaker
E-mail: erik.magelssen@scanship.no Norway
Henrik Badin, CEO www.scanship.no
Mobile: + 47 90 78 98 25
E-mail: henrik.badin@scanship.no
16You can also read