COVID-19 Lockdown Intensity and Stock Market Returns: A Spatial Econometrics Approach
←
→
Page content transcription
If your browser does not render page correctly, please read the page content below
Munich Personal RePEc Archive

COVID-19 Lockdown Intensity and
Stock Market Returns: A Spatial
Econometrics Approach

Eleftheriou, Konstantinos and Patsoulis, Patroklos

University of Piraeus

6 August 2020

Online at https://mpra.ub.uni-muenchen.de/102321/
MPRA Paper No. 102321, posted 10 Aug 2020 07:51 UTC
COVID-19 lockdown intensity and stock market returns: A spatial econometrics
                                        approach

                  Konstantinos Eleftherioua* and Patroklos Patsoulisa

a
  Department of Economics, University of Piraeus, 80 Karaoli & Dimitriou Street, 18534,
Piraeus, Greece. E-mail: kostasel@otenet.gr (Eleftheriou); patpatsoulis@gmail.com
(Patsoulis)
*
  Corresponding author. Tel: +30 210 4142282; Fax: +30 210 4142346.

                                        Abstract
We investigate the impact of governments’ social distancing measures against the
novel coronavirus disease 2019 (COVID-19) on 45 major stock market indices. We
find evidence of negative direct and indirect (spillover) effects for the initial period of
containment measures (lockdown).

JEL classifications: C23, G15, I18
Keywords: COVID-19; government policy responses; spillover effects; stock market
volatility

                                            1
1. Introduction
The coronavirus disease 2019 (COVID-19) outbreak shocked the world and
triggered an unprecedented wave of economic uncertainty in stock markets around the
globe.
The confinement measures that were utilized by governments limited
economic activity for months. While the economic consequences of the pandemic
cannot be fully estimated yet, their extent will depend not only on the direct effects of
the lockdown measures, but also on the spillover effects that these measures have on
trade and financial partners.
The way the international community handled the COVID-19 outbreak is
unprecedented in the history of pandemics, due to the synchronized global lockdown
which traumatized financial markets. In addition, the risk of multiple waves of
lockdowns remains and until a vaccine or a suitable treatment is adopted, economic
agents will behave with extreme caution, since they will expect that the recession will
persist for several time periods (Kohlscheen et al., 2020).
In this note, we contribute to two strands of the literature. The first is the
growing literature of the novel COVID-19 pandemic and its side effects on
international stock markets (Zhang et al., 2020; Zaremba et al., 2020). The second is
the literature of international stock market spillovers. The outbreak offers a unique
opportunity to assess the impact of an exogenous shock (infectious disease) on the
stock markets by estimating the effect the containment measures had on these
markets.
In order to evaluate the spillovers of the lockdown measures, we account for
two alternative transmission mechanisms (trade and financial channels), thus being in
line with Boissay and Rungcharoenkitkul (2020) who highlight the need for
understanding the different transmission channels of the COVID-19 shock to the
economy.
We utilize spatial econometric techniques to account for both the direct and
the indirect effects of the COVID-19 social distancing measures and analyze the
negative impact the latter had on international stock markets. In such a way, we can
better assess the policy trade-offs that the governments had to undertake in their
attempt to control the spread of the epidemic.
Our work follows the lines of Asgharian et al. (2013) who study financial
markets co-movements and market sensitivity to exogenous shocks. To the best of the
2authors’ knowledge, this is the first empirical assessment of the spillover effects of
COVID-19 containment measures on international stock markets.
2. Methodology
We estimate a dynamic Spatial Durbin Model (DSDM) with fixed effects,
which enables us to account for the increased degree of interdependency between
stock markets. This specification also allows us to control for omitted variable bias.
Specifically, the dynamic nature of our model accounts for time-varying omitted
variables (autoregressive approach; see Wooldridge, 2002), while time-invariant
omitted variables are modeled through the fixed effects specification (see Baltagi,
2005). Two variants of the DSDM are estimated: one with and one without the spatial
lag of the time lag of the dependent variable.
We use MLE (Maximum Likelihood Estimation) to estimate our spatial
model. MLE is the preferred estimation method for our specification since it alleviates
the endogeneity problem caused by the inclusion of the spatial autoregressive variable
and the time lagged dependent variable (Elhorst, 2005; Lee & Yu, 2010). The need for
a spatial specification is tested through the Pesaran test for cross-sectional dependence
(Pesaran, 2004). The null hypothesis of cross-section independence is rejected for all
variables indicating the need for a spatial specification (the corresponding results are
available upon request).
3. Trade and financial linkages
To construct the interaction matrix ( ), we consider two different market
interconnectedness mechanisms. The trade relations mechanism, according to which
trade partners with more intense trade flows have correlated business cycles (Frankel
and Rose, 1998) and the degree of financial integration (as proxied by the portfolio
foreign holdings of each country). The data for the construction of the trade relations
(financial linkages) matrix were retrieved from the World Bank’s WITS database (the
IMF’s Coordinated Portfolio Investment Survey) for the year 2018 (2019).
4. Data and descriptive statistics
The dataset used is a balanced panel that spans from January 2nd to April 8th
2020. The dependent variable (smi) consists of the daily stock market index returns.
3The corresponding data were retrieved from investing.com and finance.yahoo.com
websites.
The independent variable (cgr) is the daily relative change 1 of the Coronavirus
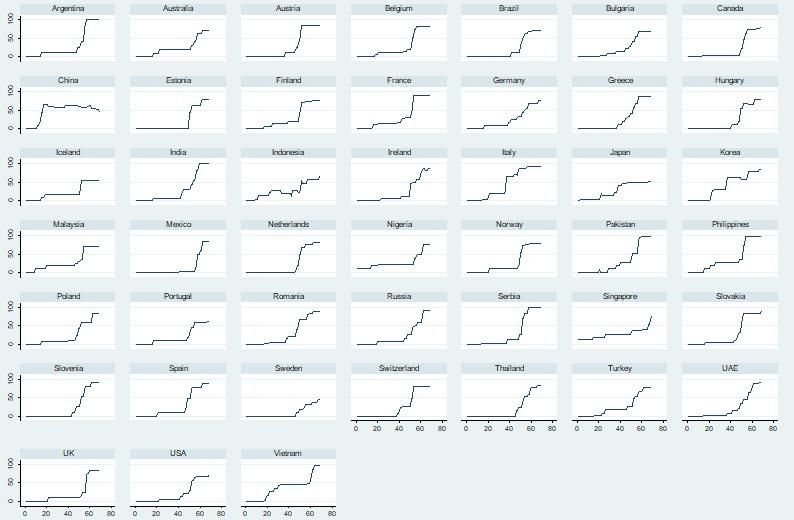
Government Response Tracker index (Hale et. al, 2020). The values of this index
range from 0 (no lockdown measures in place) to 100 (total lockdown). An overview
of the data about the aforementioned index is presented in Figure 1, while the
descriptive statistics for both variables are reported in Table 1.
Figure 1: Coronavirus Government Response Tracker index by country
Notes: Each graph illustrates the Coronavirus Government Response Tracker index by each country.
The horizontal axis depicts the time dimension and the vertical axis the corresponding index.
Since we use a high frequency dataset over a short time period, we do not
control for other global factors and macroeconomic fundamentals (data unavailability
and zero variance issues).2
1
The midpoint relative change ( x / x ) was used in order to avoid issues related to infinite percentage
changes when lockdown measures are first introduced.
2
Exchange rates are the only exception. However, the inclusion of exchange rates in our specification
did not change qualitatively our results.
4Table 1: Descriptive statistics
Standard
Variables Obs. Mean Min. Max.
deviation
Stock market index returns
3,105 -0.0038 0.0284 -0.1854 0.1302
(smi)
Relative change of
Coronavirus government 3,105 0.062 0.274 -2 2
response index (cgr)
Notes: The countries included in our analysis are the following: Argentina, Brazil, Canada, Mexico, USA,
Nigeria, Austria, Belgium, Estonia, Finland, France, Germany, Iceland, Ireland, Italy, Greece, Hungary,
Bulgaria, Netherlands, Norway, Poland, Portugal, Romania, Russia, Serbia, Slovakia, Slovenia, Spain,
Sweden, Switzerland, Turkey, UK, China, India, Indonesia, Japan, Korea, Malaysia, Pakistan, Philippines,
Singapore, Thailand, UAE, Vietnam and Australia.
5. Results and discussion
Our estimation results (Table 2) indicate a negative relationship between stock
market returns and changes in the intensity of COVID-19 containment measures
(columns 2 through 5). In particular, an increase in the intensity of COVID-19 non-
pharmaceutical interventions in a given country leads to a decrease in the stock
market returns of the same country (short and long-run direct effects). Moreover, our
findings show the existence of negative spillover effects, since an increase in the
government response intensity in a given country leads to a decrease in the stock
market returns in the interrelated countries (short and long-run indirect effects). All in
all, spillover effects complement direct effects, thus intensifying the negative impact
of lockdown measures on the performance of stock markets. The above results hold
for all four specifications and irrespective of the linkage measure considered
(although some effects are not significant in the specification presented in column
(3)).
5Table 2: Stock market index returns and coronavirus government response
Dependent variable: Stock market index returns (smi)
trade trade financial financial
interaction matrix (W):
relations relations linkages linkages
smit-1 -0.0442* -0.159*** -0.00369 -0.181***
(0.0268) (0.0412) (0.0242) (0.0392)
cgr -0.00219** -0.00183** -0.00257** -0.00210**
(0.000942) (0.000897) (0.00102) (0.000970)
W*smit-1 0.188*** 0.259***
(0.0404) (0.0397)
W*cgr -0.00422* -0.00203 -0.0104*** -0.00820***
(0.00256) (0.00266) (0.00230) (0.00223)
ρ 0.820*** 0.829*** 0.693*** 0.714***
(0.0349) (0.0343) (0.0442) (0.0420)
cgr short-run effects
Direct -0.00299*** -0.00231** -0.00328*** -0.00271***
(0.00101) (0.000930) (0.00106) (0.000943)
Indirect -0.0340** -0.0217 -0.0393*** -0.0343***
(0.0160) (0.0168) (0.00877) (0.00852)
Total -0.0370** -0.0240 -0.0426*** -0.0371***
(0.0164) (0.0172) (0.00909) (0.00882)
cgr long-run effects
Direct -0.00272*** -0.00220** -0.00326*** -0.00276***
(0.000933) (0.000907) (0.00105) (0.000886)
Indirect -0.0265** -0.0274 -0.0388*** -0.0493***
(0.0118) (0.0221) (0.00861) (0.0148)
Total -0.0292** -0.0296 -0.0421*** -0.0521***
(0.0121) (0.0226) (0.00892) (0.0152)
Country fixed effects Yes Yes Yes Yes
LogL 7726.297 7763.734 7600.757 7703.842
No. of 45/3,060 45/3,060 45/3,060 45/3,060
countries/observations
SDM vs. SEM likelihood 6.30** 1.92 32.18*** 21.00***
2
ratio test (χ (1))
Notes: LogL: Log-pseudolikelihood. The last row reports the likelihood ratio test statistic for testing
the common factor constraint (see Florax et al., 2003); failing to reject the null hypothesis indicates a
Spatial Error Model (SEM) nested within a Spatial Durbin Model (SDM) (i.e., H0: θ = -ρβ). Based on
the results, the common factor constraint is rejected for the majority of specifications implying the
superiority of the SDM. Regression results were generated in Stata using the -xsmle- command
(Belotti, et al., 2017). Robust standard errors are reported in parentheses. ***, ** and * indicate
significance at the 1%, 5% and 10% level, respectively.
66. Conclusion
In this study, we apply spatial econometric techniques to estimate the effect of
COVID-19 containment measures on 45 stock market indices. The results indicate that
stock market returns and the intensity of lockdown measures are negatively related.
The examination of COVID-19 pandemic impact on a number of areas such as social
trust and concomitant transaction costs, social security, costs of capital and political
stability can be considered as topics for future research (an early review of possible
future research agendas is extensively discussed in Goodell (2020)).
References
Asgharian, H., Hess, W., Liu, L. (2013). A spatial analysis of international stock
market linkages. Journal of Banking & Finance 37(12), 4738-4754.
Baltagi, H.B. (2005). Econometric Analysis of Panel Data (3rd ed.). Chichester: John
Wiley and Sons.
Belotti, F., Hughes, G., Mortari, A. (2017). Spatial panel-data models using Stata. The
Stata Journal 17(1), 139-180.
Boissay, F., Rungcharoenkitkul, P. (2020). Macroeconomic effects of Covid-19: An
early review. BIS Bulletin, No 7, 7 April.
Elhorst, J.P. (2005). Unconditional maximum likelihood estimation of linear and log-
linear dynamic models for spatial panels. Geographical Analysis 37(1), 85-106.
Florax, R.J.G.M., Folmer, H., Rey, S.J. (2003). Specification searches in spatial
econometrics: The relevance of Hendry’s methodology. Regional Science and
Urban Economics 33, 557-579.
Frankel, J.A., Rose, A.K. (1998). The endogeneity of the optimum currency area
criteria. Economic Journal 108(449), 1009-1025.
Goodell, J.W. (2020). COVID-19 and finance: Agendas for future research. Finance
Research Letters, 101512 (forthcoming), https://doi.org/10.1016/j.frl.2020.101512.
Hale, T., Webster, S. , Petherick, A., Phillips, T., Kira, B. (2020). Oxford COVID-19
Government Response Tracker, Blavatnik School of Government. Data use policy:
Creative Commons Attribution CC BY standard.
Kohlscheen, E., Mojon, B., Rees, D. (2020). The macroeconomic spillover effects of
the pandemic on the global economy. BIS Bulletin, No. 4, 6 April.
Lee, L., Yu, J. (2010). A spatial dynamic panel data model with both time and
individual fixed effects. Econometric Theory 26(2), 564-597.
7Pesaran, M.H. (2004). General diagnostic tests for cross section dependence in panels
(Cambridge Working Papers in Economics 0435). Cambridge: Faculty of
Economics, University of Cambridge.
Zaremba, A., Kizys, R., Aharon, D.Y., Demir, E. (2020). Infected arkets: Novel
coronavirus, government interventions, and stock return volatility around the
globe. Finance Research Letters, 101597 (forthcoming),
https://doi.org/10.1016/j.frl.2020.101597.
Zhang, D., Hu, M., Ji., Q. (2020). Financial markets under the global pandemic of
COVID-19. Finance Research Letters, 101528 (forthcoming),
https://doi.org/10.1016/j.frl.2020.101528.
Wooldridge, J.M. (2002). Introductory Econometrics: A Modern Approach (2nd ed.).
Cincinnati, Ohio: South-Western College Publishing.
8You can also read