Cape Winelands Regional Trends January-June 2017 - An inspiring place to know - Wesgro
←
→
Page content transcription
If your browser does not render page correctly, please read the page content below
Cape Winelands Regional Trends

January-June 2017                An inspiring place to know

Contents

1.   Methodology
2.   Participation and sample size
3.   Executive Summary
4.   Cape Winelands Visitor Trends & Patterns
       4.1     Origin of visitors
       4.2     Age profile of visitors
       4.3     Travel group size
       4.4     Mode of transport
       4.5     Main purpose of visit
       4.6     Top activities undertaken in the Cape Winelands
       4.7     Overnight vs. Day Visitors
       4.8     Length of stay
       4.9     Accommodation usage
       4.10    Average spend on accommodation and daily spend
       4.11    Top Information Sources
5.   Cape Winelands Towns
6.   Trends and patterns by origin of visitors
7.   Trends and patterns by top international market
8.   Trends and patterns by top domestic market
9.   Acknowledgements
1. Methodology

•   This report provides an overview of the tourism trends and patterns in the Cape Winelands. The findings will illustrate key visitor trends obtained from the regional visitor tracking survey.

•   Responses to the regional visitor tracking surveys are used as a proxy to indicate the key trends within the Western Cape and the various regions. It is important to note that absolute figures
    cannot be determined from these surveys, as the survey responses are a sample of the tourists into the respective tourism offices across the Western Cape, and would thus represent a
    sample of the visitors. Therefore, where statistically relevant absolute numbers may be given, however, a share is provided to indicate the trend. This is based on international best practice in
    the use of surveys within the tourism industry for determining key trends.

•   Definition: Tourist: refers to any visitor travelling to a place other than that of his/her own environment for more than one night, but less than 12 months and for whom the main purpose of the
    trip is other than the exercise of an activity remunerated for from within the place visited.

2. Participation and sample size
Between January and June 2017, a total of 3,838 responses to the regional visitor tracking survey were received from the respective Tourism Offices in the Cape Winelands. The participating
Tourism Offices were:

•   Paarl (1,600);
•   Tulbagh (751);
•   Wellington (599);
•   Stellenbosch (415);
•   Worcester (257);
•   Robertson (181) and
•   Ceres (35).
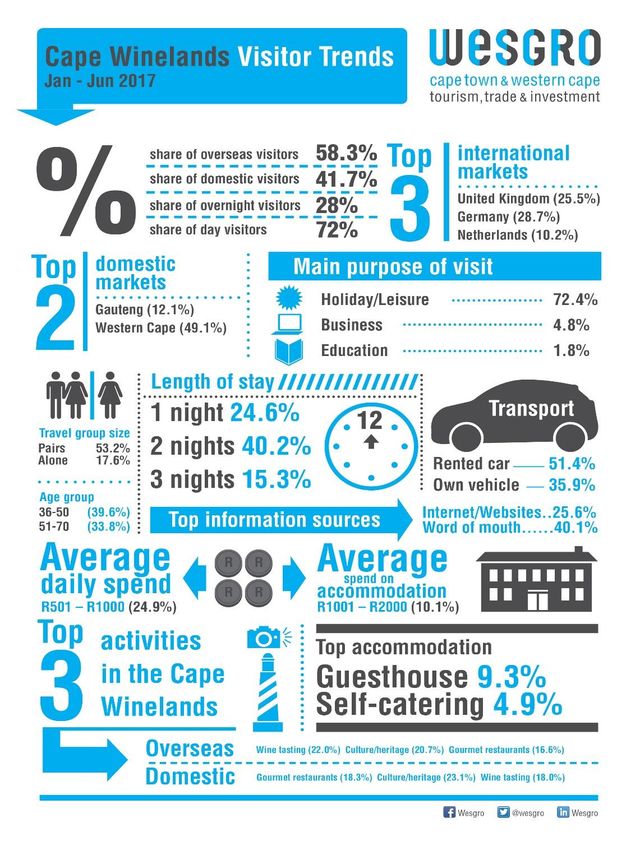
3. Executive Summary
•    Wine tourism is one of South Africa’s fastest growing industries. One would thus be remiss
     if one did not include the many wine routes of the Cape, some of which are an easy drive
     from Cape Town, such as the Constantia, Durbanville, Darling and Walker Bay wine routes.

•    Visitor surveys conducted between January and June 2017 reflected a fairly equal
     distribution of overseas (58.3%) and domestic (41.7%) visitors. Top international markets
     included Germany (28.7%), United Kingdom (25.5%) and Netherlands (10.2%).
     Provincially, these three markets rank as the Western Cape’s strongest contributors to
     tourism volume from Europe.

•    The Western Cape market ranked as the top domestic province to the region. According to
     the Statistics South Africa 2016 Domestic Tourism Survey, 99.2% of day travellers and
     69.9% of overnight travellers to the Western Cape originated from the province. Despite
     economic challenges, these trends confirm that the local Western Cape market continues
     to travel and seek leisure experiences within their own province.

•    The most prominent age profile of visitors to the Cape Winelands were between 36-50
     (39.6%) and 51-70 (33.8%) years. Over 70% of respondents indicated holiday as their top
     motivation for travelling to the Cape Winelands. Business travel (4.8%) and education
     (1.8%) followed as the second and third most popular reasons for travel.

•    The largest proportion of visitors travelled in pairs (53.2%) and 17.6% of visitors to the
     region were solo travellers. Top modes of transport used by visitors to the region included
     rented cars (51.4%) and own motor vehicles (35.9%).

•    72.0% indicated day visits to the region, while a share of 28.0% were overnight visitors. Of
     those who stayed overnight, the largest share stayed for two nights (40.2%), 1 night
     (24.6%) and 15.3% stayed for an average of three nights.

•    Guesthouses (9.3%) and self-catering (4.9%) ranked as the top accommodation choices
     amongst travellers. These visitors spent on average R1001-R2000 (10.1%) per day on
     accommodation in the Cape Winelands.

•    Word of mouth (40.1%) and internet/websites (25.6%) ranked as the top information
     sources used by visitors to obtain information on the region. On average, visitors indicated
     a daily expenditure of R501-R1000 (24.9%).

•    Wine tasting, culture/heritage and the local gourmet restaurants were equally enjoyed by
     the overseas and domestic markets.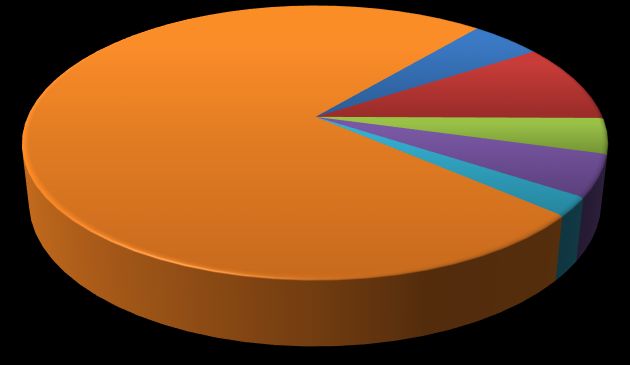
4. Cape Winelands Visitor Trends & Patterns
                                                                                                                                                 % SHARE OF OVERSEAS AND DOMESTIC VISITORS TO THE PARTICIPATING CAPE
4.1 Origin of Visitors                                                                                                                                            WINELANDS TOWNS, JAN-JUN 2016/17
                                                                                                                              70.0%
                                                                                                                                                                                                            58.3%
    •           Into the first six months of 2017, the Cape Winelands towns recorded a larger                                 60.0%
                share of travellers from the international market. Germany, the United Kingdom                                                                              50.1%
                                                                                                                                                          48.1%
                                                                                                                              50.0%
                and Netherlands ranked as the top markets across the period.                                                                                                                                                    41.7%

                                                                                                              % of visitors
                                                                                                                              40.0%
    •           Tourist arrivals to the Western Cape is driven by Europe, this market has also
                portrayed a positive shift in seasonality patterns and continue to travel to the                              30.0%
                province during the winter period.
                                                                                                                              20.0%

    •           The Western Cape emerged as the leading domestic market for the Cape                                          10.0%
                Winelands. The Cape Winelands is a very popular region amongst the local
                Western Cape market, this is evident in the solid demand for leisure travel.                                  0.0%
                                                                                                                                                              Jan-Jun 2016                                         Jan-Jun 2017

                                                                                                                                                                                  overseas       domestic

                                % SHARE OF VISITORS BY INTERNATIONAL MARKET, JAN-JUN 2016/17                                                                      % SHARE OF DOMESTIC TRAVELLERS BY PROVINCE, JAN-JUN 2016/17
                  35.0%
                                                                                                                                                      60.0%
                  30.0%                                                                                                                                                                                                 49.1%
                                                                                                                                                      50.0%                   45.9%
                  25.0%
                                                                                                                                                      40.0%
% of visitors

                  20.0%
                                                                                                                                      % of visitors
                  15.0%                                                                                                                               30.0%

                  10.0%                                                                                                                               20.0%
                                                                                                                                                                                                            12.1%
                   5.0%                                                                                                                                             8.8%
                                                                                                                                                      10.0%
                                                                                                                                                                                          3.2%                                      1.8%
                   0.0%
                       Germa                 Netherl            Switzerl          Belgiu           Australi                                           0.0%
                                      UK               France              USA             Italy                  Austria
                         ny                   ands                and               m                 a                                                                    Jan-Jun 2016                              Jan-Jun 2017
          Jan-Jun 2016 30.1%        27.3%     8.4%     3.9%      3.8%      4.8%   3.6%     1.5%     3.1%             1.1%
          Jan-Jun 2017     28.7%    25.5%    10.2%
                                                        2015
                                                       6.5%      4.6%      4.2%   3.5%     2.2%
                                                                                               20162.2%              2.1%                                                             Gauteng       Western Cape      KZN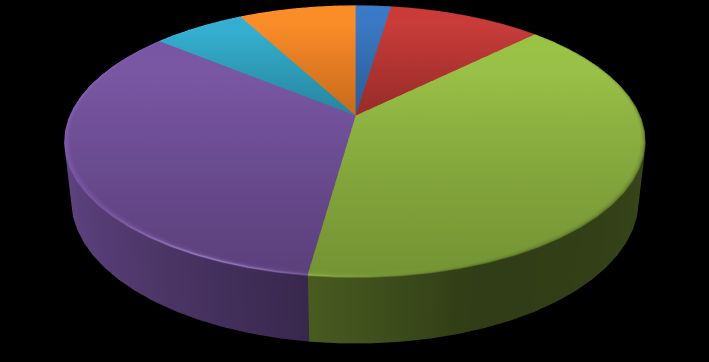
4. Cape Winelands Trends and Patterns

                            4.2 Age Profile of Visitors                                  •   The age profile of travellers to the Cape Winelands highlights a strong youth market for
                                                                                             the region. Approximately 50% of respondents were between the age groups of 21-35
                                                                                             years (10.2%) and 36-50 years (39.6%).
                        Non-respondents,       70, 6.2%                                                                          business. However, international wine tourism trends conducted by New Zealand
                                                                                             indicated that wine tourists are predominantly independent travellers.

                                                                                         •   Around 17.4% of respondents travelled in groups of four and more than five. This is
                                                                                             particularly popular amongst those who choose to explore the region and wine farms in
51-70, 33.8%                                                                                 tour groups.
                                                                          36-50, 39.6%
                                                                                         •   Due to the larger share of international respondents during the period, it is unsurprising
                                                                                             that rented car ranked as the top mode of transport (51.4%). Own motor vehicles were
                                                                                             largely indicated by the domestic market. Tour buses ranked as the third largest share
                                                                                             of respondents, a popular form of travelling to and discovering the region.

                               4.3 Travel Group Size                                                                   4.4 Mode of Transport

                Alone                      17.6%                                                                                           Non-respondents,
                                                                                                                   Other, 2.1%                   7.7%

                Pairs                                                      53.2%

                                                                                                                                                                  Rented Car, 51.4%
               Threes           7.8%
                                                                                                 Own Motor Vehicle,
                                                                                                      35.9%
                Fours              9.1%

          5 & more                 8.3%

                                                                                                                      Tour Bus, 2.9%
   Non-respondents          4.0%
4. Cape Winelands Trends and Patterns
• Holiday/leisure continued to rank as the leading driver for travel to the Cape Winelands.
4.5 Main Purpose of Visit • Business ranked as the second largest share of respondents. The close proximity between
Cape Town and the Cape Winelands provides ease of business and travelling time between
Non- the regions.
respondents,
18.8%
• Education and events/festivals followed as additional reasons for travelling to the region.
Other, 1.1% Despite the marginal share of travellers for events/festivals, the Cape Winelands holds a
strong share of visitors who specifically travels to the region for events. Top wine events
Events/Festiv includes the annual Wacky Wine Festival in Robertson, Stellenbosch Wine Festival, the Nuy
als, 1.1%
Valley Feast in Worcester amongst many others.
Education,
• Year in and year out, Cape Town and its surrounds play host to a kaleidoscope of annual
1.8%
events. While many have become institutions on the Cape’s calendar, others are just starting
Business, out and finding their roots.
4.8% Holiday/Leisu
re, 72.4%
4.6 Top Activities Undertaken in the Cape Winelands
• In addition to the exquisite wine tasting experiences the region has to offer,
culture/heritage, gourmet restaurants, outdoor activities and scenic drives ranked 25.0%
amongst the top activities enjoyed by travellers. 21.4% 20.8%
20.0%
• Crafts/food markets evolved into a popular activity enjoyed in the Cape Winelands. The 17.0%
increasing popularity can largely be attributed to the development of the “Arts & Crafts 15.0%
Route” project. % of visitors 11.5% 11.3%
10.0%
• In addition, Paarl is offering a prominent “Spice Route”. The route offers local and
international tourists a group of hand-picked artisanal producers. This gathering of 5.8%
4.7%
diverse artisans is offering a collection of flavours and a celebration of Cape cultures. 5.0% 3.5%
2.1%
Every artisan invited to be part of the Spice Route Destination community is handpicked 1.1% 0.7%
and different. 0.0%
• The above mentioned initiatives indicate that the Cape Winelands had much success in
combining different experiences and offering a unique tourism product. Another
example is the recent launch of the “African Food, Wine & Art” experience. This pairing
experience is aimed at enticing travellers’ taste buds, but will also expose tourists to the
cultural diversity and heritage of Stellenbosch. Other: Adventure, flowers, shark cage diving, golf, expos/exhibitions, astro tourism, cycling, meetings/incentives,
birding, health/wellness, ostrich farms, cruises, fishing, gambling and snow.4. Cape Winelands Trends and Patterns
• Findings obtained from our visitor tracking study between January and June 2017 indicated a larger
4.7 Overnight vs. Day Visitors proportion of day travellers to the Cape Winelands. A huge contributing factor to this trend is the
popularity in self-drives resulting in travellers moving between towns or regions.
80.0%
71.6% 72.0% • Another popular trend that leads to day trips is packaged tours. Tour operators often offer 1-day or
70.0% half-day wine tours, while some operators choose to combine wine with city or cultural tours.
60.0%
• Recent Hospitality trends released by Price Waterhouse Cooper (Outlook: 2015-2019) indicated
% of visitors
50.0% that the guest house and guest farm market was the best performing sector in 2014. This growth is
expected to continue with total room revenue for guest house and guest farms projected to be the
40.0%
fastest growing category with a 9.9% compound annual increase over the next five years.
28.4% 28.0%
30.0%
• The national trend and demand can correspondingly be seen on a regional level in the Western
20.0%
Cape. Travellers to the Cape Winelands preferred accommodation type was guesthouses (9.3%),
10.0% followed by self-catering (4.9%) establishments.
0.0%
• Visitors to the region predominantly stayed on average one (24.6%), two (40.2%) and three nights
Jan-Jun 2016 Jan-Jun 2017
(15.3%). A collective share of 13.1% stayed between 5-6 nights and up to a week and more in the
region. With new tourism developments and initiatives implemented across the region, travellers are
Overnight Visitor Day Visitor
staying longer which translates into an even greater economic contribution to the region.
4.8 Average Length of Stay 4.9 Accommodation Usage
Hotel, 4.7%
1 night 24.6%
Guesthouse,
9.3%
2 nights 40.2% Non-
respondents,
74.7% B&B, 4.2%
3 nights 15.3%
Self Catering,
4.9%
4 nights 6.6%
Other, 2.2%
5-6
5.3%
nights
7&more 7.8%4. Cape Winelands Trends and Patterns
• An average of R1001-R2000 (10.1%) emerged as the most common spending bracket
for accommodation.
4.10 Average Daily Expenditure
80.0% 75.4%
• The daily expenditure patterns amongst travellers ranged between R501-R1000
(24.9%) and R201-R500 (15.7%) per day. The high levels of expenditure can largely 70.0%
be attributed to the popularity of the local gourmet restaurants as well as the
60.0%
wine/cellar tours. These two activities ranked amongst the top three activities
0-R200
undertaken in the region. 50.0%
% of visitors
R201-R500
38.4%
• Stellenbosch alone holds the proud status as the Wine and Food Capital of South 40.0% R501-R1000
Africa. There are more than 80 restaurants offering the most basic dishes to over-the- R1001-R2000
30.0% 24.9%
top and 5-star dining experiences, set both in the town and on many of the wine farms.
More than R2000
20.0% 15.7%
Non-respondents
• Stellenbosch restaurants were also awarded Top 10 status in the Eat Out DStv Food 10.3% 10.1%
10.0% 6.5% 7.9%
Network Restaurant Awards in 2016. The high demand for cuisine and wine 4.2% 3.6%
1.5% 1.3%
experiences in the region directly impacts and significantly contributes to the local 0.0%
economy. Average daily spend Average spend on
accommodation
4.11 Top Information Sources • Word of mouth (40.1%) and internet/websites (25.6%) ranked as the top sources for
obtaining information on the Cape Winelands.
Word of mouth 40.1%
• In the most recent move to further open tourism to all, the Cape Winelands District
Municipality, in collaboration with Local Tourism Associations (LTA’s) launched brand
Internet/websites 25.6%
new tourism apps for the region's 13 idyllic towns.
VICs 15.6%
• The apps are aimed at working alongside existing tourism initiatives and hopes to put
Return visit 4.7% all small tourism businesses and communities on the map.
Brochures 4.4% • It not only gives travellers a real-time insight into what a specific town has to offer in
terms of accommodation, cafes, activities, attractions and events but also offers even
Other 5.4% the smallest of tourism contributors a chance to be seen.
Non-respondents 4.2%
• According to James Vos, the DA's Minister of Tourism; “the new initiative serves as a
beacon showing how technology can be utilised to create sustainable and inclusive
Other: TV/Radio, books/magazines, travel/agent/tour operator, newspaper and social media. development within smaller communities, and to include all members of a community”.5. Cape Winelands Towns
OVERVIEW OF REGIONAL TOWNS VISITOR TRENDS AND PATTERNS, JAN-JUN 2017
TOURISM INDICATOR Tulbagh Stellenbosch Paarl Wellington
% Share overseas 54.1% 96.4% 57.3% 33.4%
% Share domestic 45.9% 3.6% 42.8% 66.6%
% Share of overnight visitors 64.3% 37.3% 6.3% 15.4%
% Share of day visitors 35.7% 62.7% 93.7% 84.6%
Netherlands (23.4%) Germany (20.8%) Germany (39.0%) United Kingdom (40.5%)
Top international markets Germany (20.7%) United Kingdom (19.0%) United Kingdom (30.7%)
United Kingdom (18.5%) Netherlands (13.0%) France (5.7%) Germany (24.0%)
Western Cape (63.2%) Western Cape (31.4%) Western Cape (82.0%)
Top domestic markets -
Gauteng (26.1%) Gauteng (6.0%) Gauteng (13.8%)
Holiday/leisure (63.4%) Holiday/leisure (59.6%)
Main purpose of visit Holiday/leisure (94.4%) Holiday/leisure (95.9%)
Business (7.2%) Business (7.8%)
Age profile of visitors 51-70 years (36.0%) 36-50 years (37.8%) 36-50 years (52.8%) 36-50 (49.7%)
Pairs (52.5%) 5 & more (33.5%) Pairs (61.4%) Pairs (49.2%)
Most common travel group size
Fours (14.0%) Pairs (31.1%) Alone (20.5%) Alone (40.7%)
2 nights (42.4%) 2 nights (58.7%) 2 nights (38.6%) 2 nights (31.5%)
Most common length of stay
1 night (23.2%) 1 night (17.4%) 1 night (19.8%) 1 night (28.3%)
Rented car (51.3%) Rented car (69.9%) Rented car (58.1%) Own motor vehicle (60.1%)
Most common mode of transport
Own motor vehicle (46.2%) Tour bus (19.5%) Own motor vehicle (40.6%) Rented car (34.7%)
Internet/websites (33.6%)
Word of mouth (54.6%) Word of mouth (62.3%)
Top information sources Word of mouth (27.7%)
Return visits (16.7%) Internet/websites (28.8%) Internet/websites (26.9%)
Average daily spend R201-R500 (53.0%) R501-R1000 (21.7%) R501-R1000 (31.3%) R501-R1000 (14.5%)
Guesthouse (17.4%)
VICs (75.4%)
Type of accommodation Self-catering (17.3%) - -
Hotel (13.2%) Travel agent/tour operator (13.3%)
Average daily spend on accommodation R501-R1000 (30.9%) R1001-R2000 (20.0%) - -
Culture/heritage (24.2%) culture/heritage (39.9%) Gourmet restaurants (23.5%) Wine tasting (27.4%)
Top three activities undertaken in the Cape
Scenic drives (19.5%) Wine tasting (32.7%) Wine tasting (23.4%) culture/heritage (18.6%)
Winelands
Gourmet restaurants (17.8%) Shopping (10.3%) Outdoor activities (22.4%) Gourmet restaurants (18.6%)
Notes: Blank cells indicate that the sample was not big enough for a valid statistical interpretation.6. Trends and Patterns by Origin of Visitors
OVERVIEW OF TRENDS AND PATTERNS BY TOP INTERNATIONAL SOURCE MARKET, JAN-JUN 2017
TOURISM INDICATOR Overseas Domestic
% Share overnight visitors 34.5% 19.0%
% Share day visitors 65.5% 81.0%
Age profile of visitors 51-70 (40.7%) 36-50 (46.8%)
Main purpose of visit Holiday/leisure (91.6%) Holiday/leisure (45.6%)
Pairs (60.8%) Pairs (42.6%)
Most common travel group size
5 & more (11.4%) Alone (36.0%)
Most common length of stay per town 2 nights (41.2%) 2 nights (37.5%)
Mode of transport Rented car (84.5%) Own motor vehicle (82.8%)
Internet/websites (36.2%) Word of mouth (63.7%)
Top information sources
Word of mouth (23.2%) Internet/websites (10.8%)
Type of accommodation Guesthouse (11.9%) Self-catering (6.2%)
Average spend on accommodation R1001-R2000 (13.5%) R501-R1000 (7.3%)
Average daily spend R501-R1000 (29.6%) R201-R500 (22.6%)
Wine tasting (22.0%) Culture/heritage (23.1%)
Top three activities undertaken in the Cape Winelands Culture/heritage (20.7%) Gourmet restaurants (18.3%)
Gourmet restaurants (16.6%) Wine tasting (18.0%)
Notes: Blank cells indicate that the sample was not big enough for a valid statistical interpretation.7. Trends and Patterns by Top International Market
OVERVIEW OF TRENDS AND PATTERNS BY TOP INTERNATIONAL SOURCE MARKET, JAN-JUN 2017
TOURISM INDICATOR United Kingdom Germany
% Share overnight visitors 26.5% 27.8%
% Share day visitors 73.5% 72.2%
Age profile of visitors 51-70 (53.9%) 36-50 (41.2%)
Main purpose of visit Holiday/leisure (88.9%) Holiday/leisure (91.9%)
Pairs (66.3%) Pairs (65.8%)
Most common travel group size
Fours (10.9%) Fours (10.6%)
Most common length of stay per town 2 nights (45.7%) 2 nights (44.4%)
Mode of transport Rented car (87.0%) Rented car (88.5%)
Internet/websites (38.1%) Internet/websites (36.9%)
Top information sources
Word of mouth (27.9%) Word of mouth (29.7%)
Type of accommodation Guesthouse (10.4%) Guesthouse (10.8%)
Average spend on accommodation R1001-R2000 (9.6%) R1001-R2000 (11.4%)
Average daily spend R501-R1000 (32.1%) R501-R1000 (31.5%)
Wine tasting (23.5%) Wine tasting (24.8%)
Top three activities undertaken in the Cape Winelands Gourmet restaurants (20.4%) Culture/heritage (18.5%)
Culture/heritage (18.9%) Gourmet restaurants (18.2%)
Notes: Blank cells indicate that the sample was not big enough for a valid statistical interpretation.8. Trends and Patterns by Top Domestic Market
OVERVIEW OF TRENDS AND PATTERNS BY TOP DOMESTIC SOURCE MARKET, JAN-JUN 2017
TOURISM INDICATOR Western Cape Gauteng
% Share overnight visitors 18.8% 36.3%
% Share day visitors 81.2% 63.7%
Age profile of visitors 36-50 (48.7%) 36-50 (39.9%)
Holiday/leisure (50.8%)
Main purpose of visit Holiday/leisure (77.2%)
Business (9.5%)
Pairs (41.3%) Pairs (44.6%)
Most common travel group size
Alone (38.3%) Threes (13.5%)
2 nights (42.6%)
Most common length of stay per town -
1 night (24.3%)
Most common mode of transport Own motor vehicle (90.7%) Own motor vehicle (83.4%)
Word of mouth (67.9%) Word of mouth (52.8%)
Top information sources
Internet/websites (12.8%) Internet/websites (21.2%)
Self-catering (8.3%)
Most common type of accommodation Guesthouse (14.0%)
Guesthouse (4.6%)
Average daily spend R201-R500 (27.7%) R201-R500 (35.2%)
Average spend on accommodation R501-R1000 (8.0%) R501-R1000 (15.5%)
Culture/heritage (22.7%) Culture/heritage (26.2%)
Top three activities undertaken in the Cape Winelands Wine tasting (18.4%) Gourmet restaurants (20.0%)
Scenic drives (17.5%) Scenic drives (18.1%)
Notes: Blank cells indicate that the sample was not big enough for a valid statistical interpretation.9. Acknowledgements
Acknowledgements and many thanks go to the Cape Winelands District Municipality, as well as the following tourism offices for supplying the data which made this publication possible, and
whose continued and unwavering support will sustain the forthcoming issues.
The participating local tourism offices in the Cape Winelands:
• Tulbagh Tourism
• Ceres Tourism
• Stellenbosch Tourism
• Worcester Tourism
• Paarl Tourism
• Wellington Tourism
• Robertson Tourism
For more publications like this visit the Wesgro publications portal on our website at www.wesgro.co.za/research_articlesYou can also read