Investigation of Airflow from a Regular Ceiling fan using CFD Simulation
←
→
Page content transcription
If your browser does not render page correctly, please read the page content below
International Research Journal of Engineering and Technology (IRJET)                                          e-ISSN: 2395-0056
         Volume: 08 Issue: 07 | July 2021                  www.irjet.net                                              p-ISSN: 2395-0072

          Investigation of Airflow from a Regular Ceiling fan using CFD
                                    Simulation
                                                            Rehan Ansari1
    1Student,   Department of Mechanical Engineering, Rizvi college of Engineering, Mumbai, Maharashtra, India
---------------------------------------------------------------------***----------------------------------------------------------------------
Abstract - Ceiling fans are the most commonly used
electrical appliance in homes situated in tropical regions.
Although it has a simpler construction, the dynamics of airflow
behind it is quite complex as it depends upon various factors
such as the structural design of fan, size of the room,
environmental conditions, etc. In this study, airflow from a
regular ceiling fan is investigated using computational fluid
dynamics. Using 2k factorial design, the results from CFD
simulation are analyzed so as to reduce the number of
computational cases and investigate for the dominant
parameter affecting the airflow with the help of a Pareto
chart. The data is then used for obtaining a regression
equation for the same. From the study, it was found out that
the angle of attack and length of the blades were dominant
parameters in the airflow characteristics. Thus, modifications
in performance of the fan can be easily done on its structure               Figure 1: Different flow regions identified by A Jain [1]
without actually changing its drive unit which is beneficial in
high volumetric efficiencies with less power consumption.

Key Words: Ceiling fan, airflow, computational fluid
dynamics, dominant parameter, angle of attack, blade length,
speed.
1. INTRODUCTION

Ceiling fans are the most widely used electrical appliance in               Figure 2: Velocity streamlines of the airflow from CFD
homes situated in tropical regions. Compared to air
conditioners, a fan is less power consuming along with the               A. Jain et al. [1], in their work, demonstrated the flow field
ease of maintenance and thus is an economically viable                   around a ceiling fan with the help of an experimental setup.
choice to common-man for its comfort. A typical ceiling fan              The flow characteristics of the fan inside a closed room was
has the purpose of recirculating the air, enclosed in the                experimentally visualized and different flow regimes were
room, by accelerating it with the help of blades inclined at             studied, as from figure 1. It was observed that there were 8
specific angles. Thus, a ceiling fan recirculates the air in a           major flow regions under a ceiling fan. The region below the
room by means of external power via the blades.                          fan (region 1), was considered to be the one with high-
                                                                         velocity and swirling nature. It was found out that essentially
Generally, the power to the fan is provided by motors, placed
                                                                         this was the region where a person would feel the maximum
in its hub. A hub is the main, central rotating part to which
                                                                         comfort. The air from region 1 moves along the edges of the
the fan blades are connected. A typical ceiling fan consist of a         room which is region 2, characterized by its laminar
capacitor-start type of motor due to its high initial torque.
                                                                         property and low speed. Region 2 is bounded based on the
The speed of the motor in the fan can be controlled with the
                                                                         size of the room and space occupied by people. The air then
help of voltage regulators. The blades of fan are of specific
                                                                         gradually reaches region 3, which is above the blades of the
length and are inclined at specific angles to the hub, which is
                                                                         fan, where it thickens and develops a radial component in
known as the angle of attack. The entire assembly of the fan
                                                                         addition to its vertical component. It then enters the blades
is hung to the ceiling of the room by means of a rod. Thus,
                                                                         of the fan again. Region 4, as can be seen in figure 1, is
the airflow from a fan depends on the blade length, angle of             sandwiched between the region 1 and 2 respectively. The
attack, speed, size of the room, etc.                                    region is characterized with very small velocity as it is the
                                                                         region recognized to be less effective. Region 5 is the region
                                                                         where vortex formation from the tip of the blade is
                                                                         maximum, as seen in figure 2. Regions 6, above the fan, and

© 2021, IRJET          |     Impact Factor value: 7.529              |     ISO 9001:2008 Certified Journal                 |   Page 919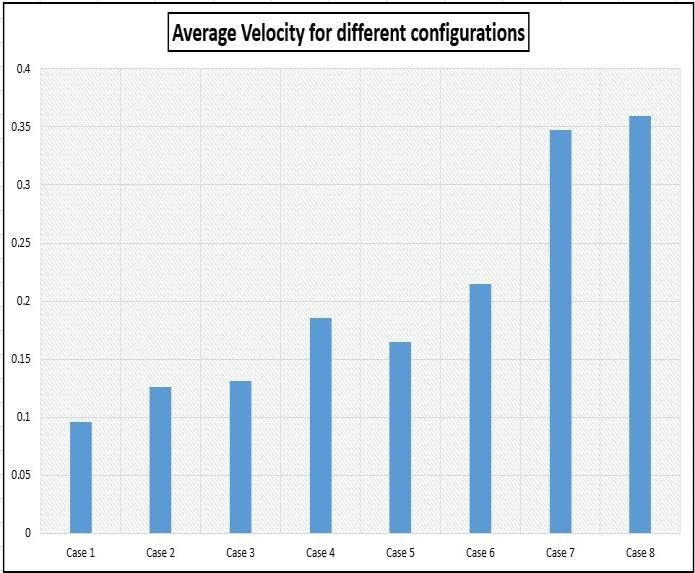
International Research Journal of Engineering and Technology (IRJET) e-ISSN: 2395-0056
Volume: 08 Issue: 07 | July 2021 www.irjet.net p-ISSN: 2395-0072
region 7, below the hub of fan are characterized by very low 2. METHODOLOGY
velocity profiles and are considered to be dead or
recirculation zones. The recirculation region between the 2.1. Design of the ceiling fan
blade and the hub is region 8. Like tip vortices, this region
too is attached to the blade and rotates with it. Air below the
blade turns around through this gap to reach the flow above
the blade. Figure 2 gives a better idea on the airflow
characteristics with the help of velocity streamlines.
S. Ho et al. [2] in their study for thermal comfort using ceiling
fans suggested several numerical formulations and
mathematical models for optimum thermal comfort. The
study considered the combined effect of the location (height)
of the inlet and the air speed from the fan (vertical to the
room or axial to the fan). Thus, average velocity was one of
the primary variable in the study which had a great effect on
the optimal thermal comfort. The study predicted that the Figure 3: Assembly of fan
inlet temperatures and high speed from the fans were one of
the major parameters in thermal comfort.
The study of Babich F. et al. [3] compared various turbulence
models for the CFD simulation of ceiling fans with
experimental data. The study suggested that k-ω SST model
developed accurate solutions when compared with the
experimental data. The simulated values for both the
swirling and axial movements of air showed greater
accuracy with this turbulence model.
The present work develops an understanding in the airflow
from a regular ceiling fan with the help of computational Figure 4: Position of fan in the control volume
fluid dynamics [4]. The parameters which are considered in
the study are mainly the fan’s structural parameters such as The assembly of fan consists of the hub, blades and rod as
speed, blade length and angle of attack. Other parameters shown in the figure 3. Based on the parametric study for
such as the size of the room, temperatures of the number of blades of Adeeb et al. [5][10], it was observed
surrounding, density of air, cross-ventilations in the room, that three blade configuration was desirable for good energy
etc. are also some of the parameters that might affect the efficiency and volumetric efficiency for the performance of
airflow but are not considered due to ease of computation. fan. Thus, a three blade configuration of fan is considered for
The dominant parameter in airflow characteristics is found the study. A set of 4 different blades with different angle of
out using 2k factorial design from the results of the attacks and dimensions are considered for different cases in
simulation. The present study also employed spectral the study. The angle of attack is varied between 6° to 12°
analysis technique to find out one of the cases of the design. based on the optimum performance results of J. Rao [6]. The
With the help of this study, modifications in fan can be done hub and the rod of the fan is considered to be the same for all
by the designer without changing the driving unit (motor) of iteration. The dimensions of the fan can be noted from table-
the fan. Thus, it is advantageous for a designer in terms of 1.
cost and complexity in design. It also provides a tool to the
Part Dimension
designer in designing and verifying the data.
Hub diameter 24 cm
Rod diameter 9 cm
Rod length 49 cm
Blade length 38 cm, 56 cm
Angle of attack 6°, 12°
Table 1: Dimensions of each component
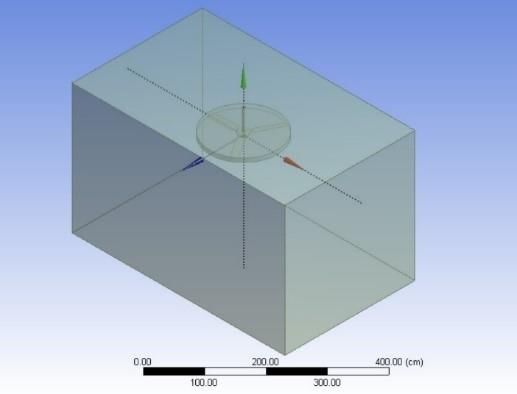
From figure 4, the position of the fan in the control volume
can be clearly observed. The assembly of fan is hung in the
centre of the control volume for uniform flow characteristics
[7] [12]. The size of the room is considered to be 4.5x3x3 m.
© 2021, IRJET | Impact Factor value: 7.529 | ISO 9001:2008 Certified Journal | Page 920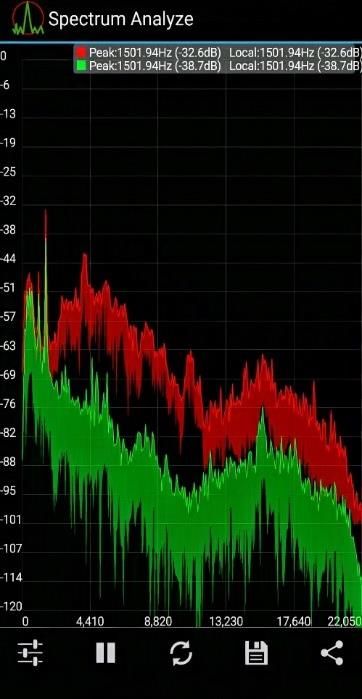
International Research Journal of Engineering and Technology (IRJET)                                  e-ISSN: 2395-0056
        Volume: 08 Issue: 07 | July 2021               www.irjet.net                                          p-ISSN: 2395-0072

2.2 Discretization of domain                                          Over time, the bearings in a typical fan becomes gummed
                                                                      up from dirt and oil, or may even dry out and may need
                                                                      proper lubrication, which is one of the main reasons in the
                                                                      reduction of speed. A spectral analysis of the noise
                                                                      generated by the fan is used to check the speed of the fan. A
                                                                      regular spectral analyzer application for phones is used for
                                                                      it. For the verification of the data showed by the
                                                                      application, a test noise of 1500 Hz was generated and
                                                                      tested on the application as from figure 6. The data showed
                                                                      by the application was found to be correct as shown in the
                                                                      figure 7.

    Figure 5: Cross-section of the discretized domain

The domain is discretized with ICEM-CFD in ANSYS. The
domain, as in figure 5, has unstructured mesh with an
average element size of 9.463e-02 m. As it can be observed
that the mesh is refined such that it is fine around the fan’s
blade so as to observe recirculation and vortices. Also, the
boundary or the walls of the control volume have fine mesh
too for observing the recirculation effects. The mesh is
similar for all the cases considered in the study.

2.3 Boundary conditions for the simulation
                                                                               Figure 6: Test frequency for verification
The air in the room is considered to be at STP for all the
cases in the study. For the sake of simplicity, it is assumed
that there is no external influence from the surrounding i.e.
assuming the windows and doors of the room to be closed.
For different cases of study, boundary conditions of the fan is
different although the room parameters remain the same.
Since 2k factorial design is used, each case has to have a
maximum and minimum value. Since there are 4 set of
blades, each blade has a blade length of 38 and 56 cm
respectively. Similarly the angle of attack is varied with a
minimum of 6° and maximum of 12° [6]. The speed of the fan
is an essential parameter since regular economical fans do
not exceed with a speed of 300 rpm. Thus, the maximum
speed for the simulation is 300 rpm at full voltage. For
determining the minimum speed that a fan can have at full
voltage, the speed of a fan-in-use is considered since it’s the
minimum speed that the fan achieves over time. To find that
speed, spectral analysis is used.

2.3.1 Determination for minimum speed at full                                 Figure 7: Screen capture of test frequency
voltage using spectral analysis
From the assembly of fan, it can be noted that a regular
ceiling fan has no proper arrangement for measuring its
speed without disassembling it. Thus, a different method is
incorporated to check the speed of the fan without actually
disassembling it. Since fans are durable and are used for a
long time, the rated speed and the actual speed may
definitely show variation due to the problems with the
bearings, bad capacitor usage, motor windings issue, etc.

© 2021, IRJET        |    Impact Factor value: 7.529              |    ISO 9001:2008 Certified Journal            |   Page 921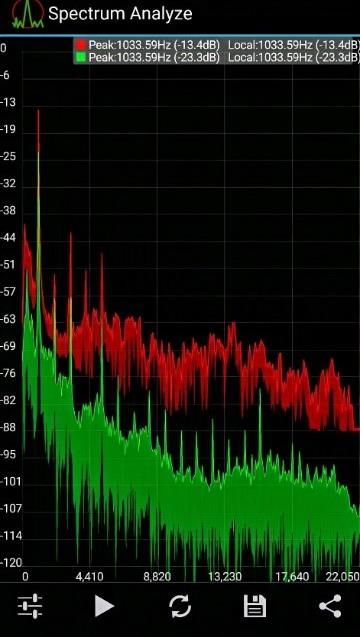
International Research Journal of Engineering and Technology (IRJET)                             e-ISSN: 2395-0056
          Volume: 08 Issue: 07 | July 2021              www.irjet.net                                      p-ISSN: 2395-0072

                                                                   3. RESULTS & DISCUSSIONS

                                                                   The simulation used k-ω turbulence model for solving the
                                                                   cases for the problem in ANSYS FLUENT [3]. The simulation
                                                                   was ran for all the cases as discussed in the table 2. The
                                                                   results are based on the average velocity from all of the
                                                                   cases. The reason for considering average velocity as a
                                                                   primary result is because the thermal comfort for humans is
                                                                   based on how well the convective heat transfer between the
                                                                   environment and the body takes place. Thus, velocity of air is
                                                                   a primary variable in optimum thermal comfort for people
                                                                   sitting below an ordinary ceiling fan [2] [8]. The results for
                                                                   all the cases are discussed below which consist of the
                                                                   velocity surface plots and the velocity contours.

        Figure 8: Screen capture of frequency of noise

Thus, based on the data recorded by the analyzer in figure
8, the peak frequency of noise generated by fan can be seen
as 1033.59 Hz. But this is the frequency of the noise
                                                                              Figure 9: Simulation results of Case 1
generated by the fan for all the 3 blades. Thus, the
frequency of each blade is 344.53 Hz. Also, the relation
between the frequency and angular speed is given by
          , wherein    is the angular speed and is the
frequency. Thus, the speed of the fan is approximately 227
rpm. Thus, we take the minimum speed for our case to be
227 rpm.

Thus, the boundary conditions for various cases of the
simulation is tabulated below.                                               Figure 10: Simulation results of Case 2

 Case        Angle of attack      Chord length    Speed
             (degrees)            (cm)            (rpm)

 Case 1      6                    38              227

 Case 2      6                    38              300

 Case 3      6                    56              227
                                                                             Figure 11: Simulation results of Case 3
 Case 4      6                    56              300

 Case 5      12                   38              227

 Case 6      12                   38              300

 Case 7      12                   56              227

 Case 8      12                   56              300
                                                                             Figure 12: Simulation results of Case 4
                  Table 2: Details of each case

© 2021, IRJET          |    Impact Factor value: 7.529         |    ISO 9001:2008 Certified Journal            |   Page 922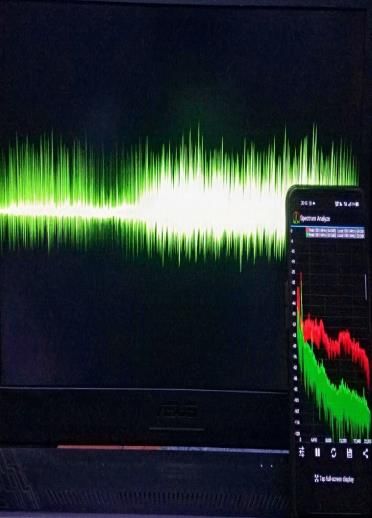
International Research Journal of Engineering and Technology (IRJET) e-ISSN: 2395-0056
Volume: 08 Issue: 07 | July 2021 www.irjet.net p-ISSN: 2395-0072
Figure 13: Simulation results of Case 5
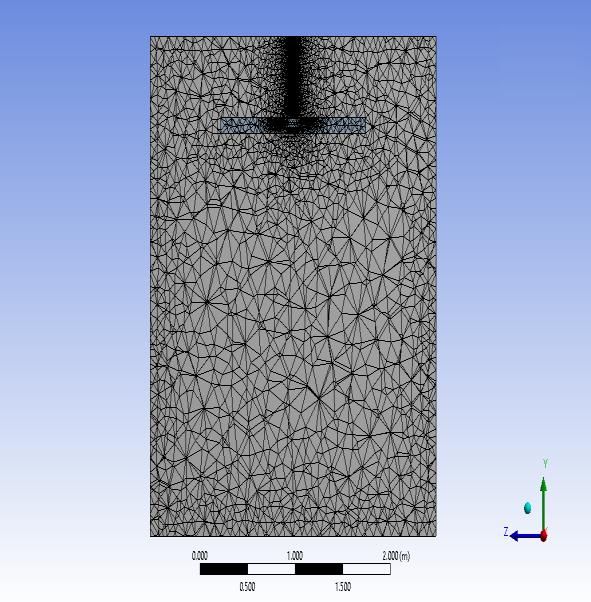
Figure 17: Overall comparison of all the cases
To get the relationship between each parameter considered
in the simulation, 2k factorial design is implemented. The
parameters considered in the study are the angle of attack,
Figure 14: Simulation results of Case 6 blade length and speed of the fan. Thus, with the help of a
Pareto chart, the dominant parameter and its relationship
with other parameters is found out. From CFD simulation,
the result (average velocity) of each case was found out.
Thus, the data for Pareto chart formation is tabulated below.
From table 3, it can be noted that angle of attack, speed &
blade length are the parameters and average velocity is the
effect to which the Pareto chart is formed.
Angle of Attack Speed Blade length Average
Figure 15: Simulation results of Case 7 (°) (rpm) (cm) Velocity
(m/s)
6 227 38 0.09596
12 227 38 0.164977
6 300 38 0.126266
12 300 38 0.214909
6 227 56 0.131501
12 227 56 0.347377
6 300 56 0.185615
Figure 16: Simulation results of Case 8 12 300 56 0.35935
Table 3: Average velocity for all cases from CFD
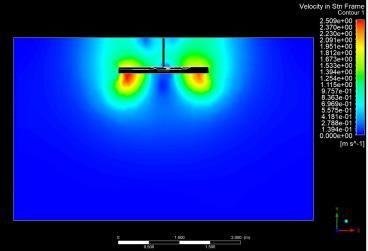
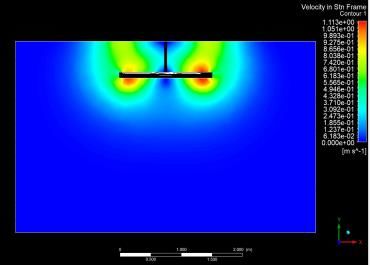
It can be observed that the surface plot for average velocity
for all the cases show similar trends. The area or distance of
the air dissipated remains the same. The peak velocity for all
the cases is in the centre of domain and ranges from 0.2 ms-1
to 0.7 ms-1. One peculiarity of the surface plot for all the
cases is that the velocity at boundaries is close to 0.1 m/s
since the region recirculates the airflow back to the top of
the domain. The velocity contours from the all the cases
show that the region below the blades have the highest
recirculation velocities. The air in the region below the fan
have high swirl nature and thus tend to form a half-cone or
frustum-like profile as it reaches the ground. Thus, it is the
region for maximum thermal comfort. From figure 17,
overall comparison for all the cases can be observed. It can Figure 18: Pareto chart of the effects
be observed that average velocity of case 7 and 8 are
From the Pareto chart, it is clear that the angle of attack
maximum while that of case 1 and case 2 is the least. along with the blade length was a dominant parameter in the
© 2021, IRJET | Impact Factor value: 7.529 | ISO 9001:2008 Certified Journal | Page 923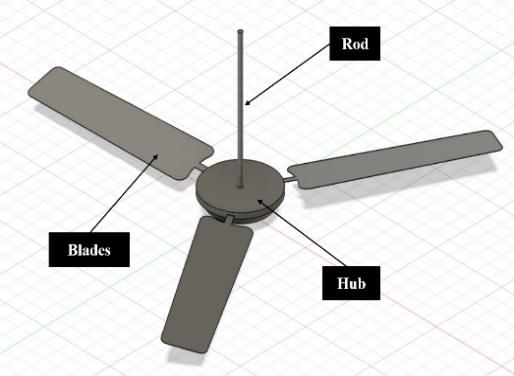
International Research Journal of Engineering and Technology (IRJET)                                    e-ISSN: 2395-0056
          Volume: 08 Issue: 07 | July 2021              www.irjet.net                                             p-ISSN: 2395-0072

airflow characteristics. Thus, a regression equation for the           [7]    Aynsley, Richard, and Mohamed Ali. "Optimizing Ceiling
average velocity as a function of the fan parameters is:                      Fan Locations with CFD." In Architectural Engineering
                                                                              2003: Building Integration Solutions, pp. 1-4. 2003.
        v = 0.7905 – (0.1179*a) – (0.002328*b) –                       [8]    Hsiao, Shih-Wen, Hsin-Hung Lin, and Chi-Hung Lo. "A
             (0.02097*c) + (0.000343*a*b) +                                   study of thermal comfort enhancement by the
                                                                              optimization of airflow induced by a ceiling fan." Journal
            (0.003138*a*c)                                                    of Interdisciplinary Mathematics 19, no. 4 (2016): 859-
            + (0.000065*b*c) – (0.000008*a*b*c)                               891.
Where, v = Average velocity, a = Angle of attack, b = Speed            [9]    Casseer, Dilshan, and Chathura Ranasinghe.
                                                                              "Assessment of spallart almaras turbulence model for
of the fan, c = Blade length.                                                 numerical evaluation of ceiling fan performance."
                                                                              In 2019 Moratuwa Engineering Research Conference
                                                                              (MERCon), pp. 577-582. IEEE, 2019.
4. CONCLUSION                                                          [10]   Adeeb, E., C. H. Sohn, A. Maqsood, and M. A. Afaq. "Design
                                                                              Optimization of Ceiling Fan Blades with Nonlinear
From the Pareto chart it was observed that the airflow                        Sweep Profile." Journal of Applied Fluid Mechanics 11,
characteristics are greatly influenced by the angle of attack                 no. 5 (2018): 1153-1162.
followed by the blade length. Thus, for increasing the                 [11]   Wang, Huan, Maohui Luo, Guijin Wang, and Xianting Li.
performance of the fan without altering the driving unit, the                 "Airflow pattern induced by ceiling fan under different
                                                                              rotation speeds and blowing directions." Indoor and
structural parameters such as the angle of attack and the                     Built Environment 29, no. 10 (2020): 1425-1440.
blade length can be improved by the designer. The
                                                                       [12]   Momoi, Yoshihisa, Kazunobu Sagara, Toshio Yamanaka,
regression equation from the study will help the designer in                  and Hisashi Kotani. "Effects Of Ceiling Fan On Velocity
altering the performance based on structural parameters.                      And Temperature Distribution In Office Room."
Also, it can be noted that a person with less experience in            [13]   Singh, Pushpesh, and Gajendra Vasantrao Patil. "DESIGN
working with drive units too can improve the performance                      AND CFD ANALYSIS OF CEILING FAN FOR REGULAR
of the fan by just optimizing the structure. Thus, it can be                  ROOM SIZE." (2020).
concluded from the study that not only does the speed
contribute to the overall performance of the fan but the
structural parameters such as angle of attack and blade
length contribute greatly too. This not only helps in
optimization but also helps in attaining higher efficiencies
and higher energy savings.

REFERENCES

[1]   Jain, Ankur, Rochan Raj Upadhyay, Samarth Chandra,
      Manish Saini, and Sunil Kale. "Experimental
      investigation of the flow field of a ceiling fan." In Heat
      Transfer Summer Conference, vol. 4692, pp. 93-99.
      2004.
[2]   Ho, Son, Luis Rosario, and Muhammad Rahman. "Effect
      of using ceiling fan on human thermal comfort in Air-
      conditioned space." In 3rd International Energy
      Conversion Engineering Conference, p. 5734. 2005.
[3]   Babich, Francesco, Malcolm Cook, Dennis Loveday, Rajan
      Rawal, and Yash Shukla. "Transient three-dimensional
      CFD modelling of ceiling fans." Building and
      Environment 123 (2017): 37-49.
[4]   J.D. Anderson, in computational fluid dynamics,
      MCGRAW-HILL, 2012.
[5]   Adeeb, Ehsan, Adnan Maqsood, and Ammar Mushtaq.
      "Effect of number of blades on performance of ceiling
      fans." In MATEC Web of Conferences, vol. 28, p. 02002.
      EDP Sciences, 2015.
[6]   J.Bala Bhaskara Rao, D. Bhanuchandra Rao, J.Siddhartha
      Yadav, M.Sreerama. “Simulation of Air Flow around
      Ceiling Fan in an Enclosed Space by Using Cfd.” In
      International Journal of Scientific & Technology
      Research, volume 9-issue 6, June 2020 edition.

© 2021, IRJET          |    Impact Factor value: 7.529             |    ISO 9001:2008 Certified Journal               |   Page 924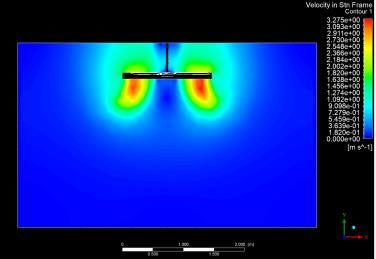
You can also read