Approaches for quantification of oligonucleotides in extracted plasma using high resolution mass spectrometry - Sciex
←
→
Page content transcription
If your browser does not render page correctly, please read the page content below
Approaches for quantification of oligonucleotides in extracted
plasma using high resolution mass spectrometry
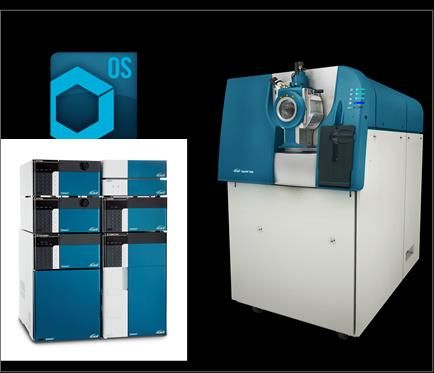
Featuring the SCIEX TripleTOF® 6600+ LC-MS/MS System and SCIEX OS-Q Software 1.7
Esme Candish, Dilip Reddy, Ji Jiang, Sean McCarthy,
Lei Xiong
SCIEX, Framingham MA, USA,
Oligonucleotide therapeutics and gene therapies are rapidly
gaining attention as their potency improves and delivery
challenges are addressed, this is particularly true of the
antisense oligonucleotide (ASO) and the small interfering RNA
(siRNA) therapeutics. Furthermore, the potential disease areas
in which oligonucleotide therapies are being developed is rapidly
expanding due to their potential for treating previously
undruggable targets.
The increased interest in these modalities necessitates the
development of flexible analytical approaches that can not only
be used for traditional bioanalysis to understand the
pharmacokinetic profiles but can also be employed to monitor
the presence of degradation and metabolism products as well as
confirm the target sequence. Routine approaches for high resolution mass spectrometry (LC-HRMS) is an attractive
oligonucleotide bioanalysis have involved hybridization-based technique for the analysis of oligonucleotide therapeutics.
ELISA (HELISA) primarily due to the low detection limits that can
be achieved. However, hybridization assays lack the specificity LC-HRMS can effectively discriminate and quantify not only the
to distinguish between the oligonucleotide product and related target analyte but also impurities/metabolites in the sample. The
impurities/metabolites and as such they cannot be identified and SCIEX TripleTOF 6600+ LC-MS/MS System combines excellent
subsequently quantified. Liquid chromatography coupled with quantitative performance with the selectivity of HRMS. In this
work, the quantitative capabilities of both TOF MS and MRMHR
scans were investigated. The unique quantitative mass
reconstruction capabilities within SCIEX OS-Q Software 1.7 are
presented in addition to the highly selective MRM-based
workflows. Finally, the HRMS benefits of the SCIEX TripleTOF
6600+ LC-MS/MS System are demonstrated for the detection
and relative quantification of impurities using TOF MS and the
Sample Prep. with SPE LC-HRMS & HRMS/MS determination of the target sequence with MRMHR.
Key features of the SCIEX solution for
oligonucleotides
• Exceptional negative ion performance with optimal sensitivity
• Selectivity benefits of HRMS to detect, identify and quantify
not only the analyte but also impurities in the sample
• Flexibility and unique quantitative capabilities of SCIEX OS-Q
Software 1.7
Impurities & Sequencing TOFMS & MRMHR Quant. • High-quality MS/MS spectra for oligonucleotide sequencing
Figure 1. A schematic representation of the HRMS workflow.
p1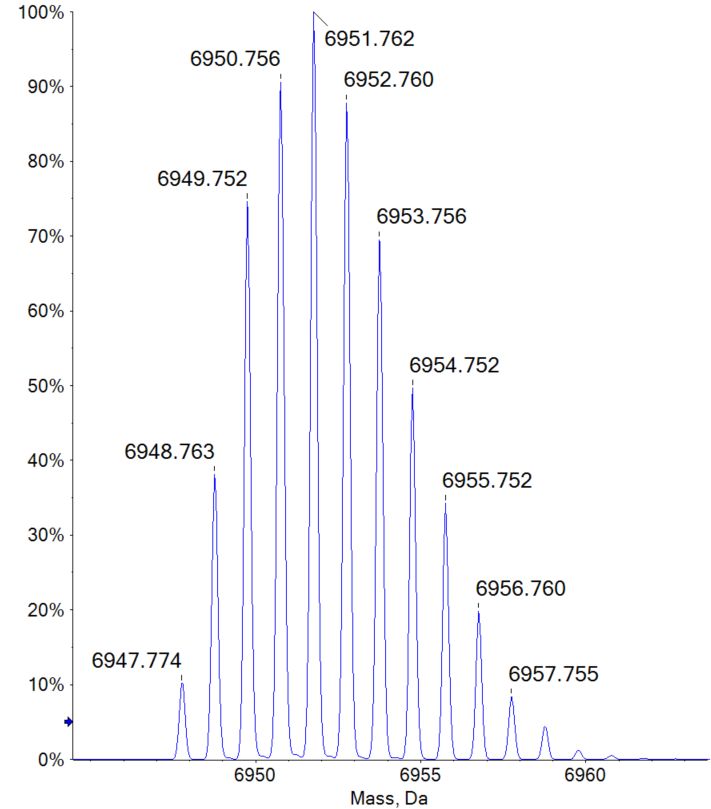
Methods                                                               Mass spectrometry: A SCIEX TripleTOF 6600+ LC-MS/MS
                                                                      System fitted with an IonDrive™ Turbo V Ion Source was utilized
Samples and reagents: All reagents were purchased from
                                                                      for all analyses. TOF MS and MRMHR were investigated for
Sigma Aldrich. This included the 1,1,1,3,3,3-hexafluoro
                                                                      quantification. The details of each scan type can be seen in
isopropanol ≥ 99.8% (HFIP), diisopropylethylamine 99.5%
                                                                      Table 2. The source conditions employed are listed in Table 3.
(DIEA), methanol and ethylenediaminetriacetic acid (EDTA). The
                                                                      The instrument was calibrated using the carrier oligonucleotide.
oligonucleotide standards were synthesized by Integrated DNA
                                                                      The calibration table is listed in Table 4. The data was acquired
Technologies (IDT). The analyte was a fully phosphorothioated
                                                                      using Analyst® TF Software 1.8.0.
20mer and each base was 2’-O-methylated. The sequence was
mU*mA*mU*mC*mC*mG*mC*mC*mU*mC*mG*mU*mG*mA*m
                                                                      Table 2. Acquisition parameters.
G*mA*mA*mG*mA*m‘. The internal standard (IS) was a fully
phosphorothioated 21mer with a sequence of.
G*C*G*T*T*T*G*C*T*C*T*T*C*T*T*C*T*T*G*C*G. A carrier                                                                     Value
oligonucleotide was also employed to help prevent non-specific        TOF MS scan
binding, the sequence was CATGGTCCTGCTGGAAGTTCGTG.
                                                                      Mass Range (m/z)                                 600 - 2800
The Clarity OTX SPE kit was purchased from Phenomenex.
Human plasma from BioIVT was employed as the matrix.                  Delustering Potential (V)                            -50

                                                                      Collision Energy (V)                                 -10
Sample preparation: Aliquots of 200 μL neat plasma were
combined with 200 μL of lysis-loading buffer. The lysed plasma        Accumulation Time (ms)                              200

samples were then extracted through the Clarity OTX SPE plate         MRMHR scan
using the recommended protocol. Briefly, the sorbent was              Product Ion -10 Charge State Analyte (m/z)          694.2
conditioned with 1 mL methanol and equilibrated with 1mL
                                                                      Product Ion -9 Charge State- IS (m/z)               741.4
equilibration buffer. Following equilibration, the lysed plasma was
loaded and then washed with 3 x 1 mL washing buffer. Finally,         Q1 Resolution                                       Low
the sample was eluted with 1 mL of elution buffer. The eluted         Mass Range (m/z)                                  300-1000
samples were dried down with N2 gas and reconstituted in 200
                                                                      Delustering Potential (V)                            -50
µL water containing 100 μM EDTA, 2 µg/mL carrier
oligonucleotide and 1 µg/mL IS. The calibration curve and quality     Collision Energy – Analyte (V)                       -35
control samples were then spiked between 0.5 ng/mL to 1000            Collision Energy – IS (V)                            -25
ng/mL with the analyte, assuming an 80% recovery.
                                                                      Accumulation Time (ms)                               50

Chromatography: The separation was accomplished using an
Agilent 1290 Infinity UHPLC fitted with a Waters Oligonucleotide
BEH Column, 2.1 mm x 50 mm with 1.7 μm particles. Mobile              Table 3. Source parameters.
phase A and B were 15 mM DIEA with 100 mM HFIP in water
and methanol respectively. The gradient used is shown in Table
                                                                                                                          Value
1. The column temperature was held at 70ºC. An injection
                                                                      Polarity                                           Negative
volume of 20 µL was employed.
                                                                      GS1 (psi)                                             70
Table 1. LC gradient.
                                                                      GS2 (psi)                                             70
     Time (min)          %A           %B       Flow Rate (μL/min)     Curtain Gas (psi)                                     40
        Initial          85           15               300            Temperature (°C)                                     400
         3.0             65           35               300            Spray Voltage (V)                                   -4500
         3.1              2           98               300

         4.5              2           98               300
                                                                      Data processing: Explorer and Bio Tool Kit within the SCIEX
         4.6             85           15               300            OS-Q Software 1.7 were employed to visualize data. The
         6.0             85           15               300            quantification was performed using Analytics within SCIEX OS-Q
                                                                      Software 1.7, this included quantification of selected charge

                                                                                                                                    p2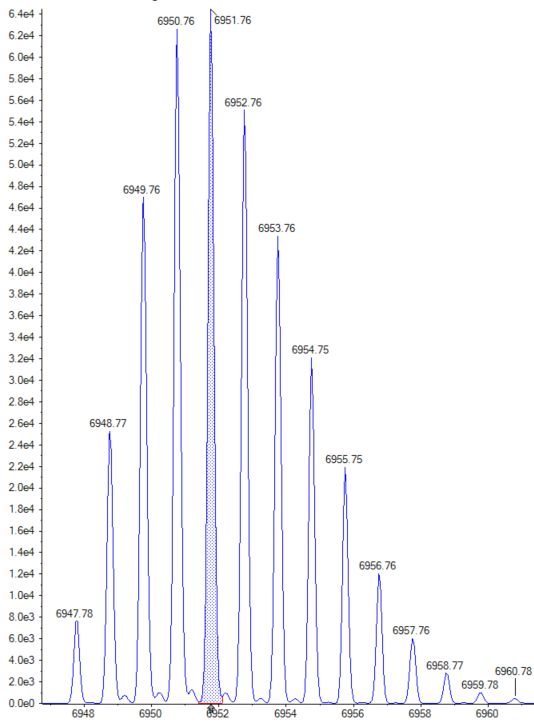
states of the mass reconstructed spectra and MRMHR                                      In this work, the fast scan speeds of the TOF instrumentation
quantification. ProMass was used to identify the impurities.                            were leveraged to undertake a rapid comparison of the
                                                                                        quantitative performance of the scan techniques simultaneously.
                                                                                        Both TOF MS and MRMHR were investigated. The acceptance
Table 4. Calibration table. The most abundant isotope of each charge
state was employed for MS calibration while [M-H]-9 was used for MS/MS.
                                                                                        criteria of the assay was +/- 15% deviation and +/- 20% deviation
                                                                                        at the LLOQ for both the calibration curve and the QCs and this
                                                                                        was used to assess the linear range of quantification for the
 MS    Precursor          CE for DP for RT (min)              Fragment       Fragment
          m/z             MS/MS MS/MS                          MS/MS            m/z     assay.

  -9    751.4526             -40         -50        2.1           PO3H       78.9591
                                                                                        TOF MS workflows
  -8    845.5112             -10         -50        2.1       PO5C5H7        176.9958
                                                                                        Mass reconstruction quantification: The acquired TOF MS
  -7    966.4412             -10         -50        2.1      *w2-H2O | b21 303.0388
                                                                                        data was first evaluated. Using this scan type all ions within the
  -6   1127.8497             -10         -50        2.1       *w3 | a21-B    506.0484   mass range of the experiment are detected. The key advantage
  -5   1353.6211             -10         -50        2.1            w2        650.1018   of this approach is the simplicity of MS method set up and the
                                                                                        ability to detect the presence of both the analyte and any
  -4   1692.0275             -10         -50        2.1       *w2 | a22-B    810.0944
                                                                                        potential impurities/metabolites. Figure 2 shows the charge state
  -3   2256.3799             -10         -50        2.1                                 envelope and the reconstructed mass of the analyte. The left
*Note: Multiple internal fragment possibilities with this mass                          pane reveals the charge state envelope which distributes the
                                                                                        signal from -11 to the -3 charge state. In the right pane, these
                                                                                        charge states are reconstructed to the intact mass of the analyte
                                                                                        (zero charge state) using the mass reconstruction algorithm.
Results
As mentioned above, HRMS is an attractive platform for the                              The SCIEX OS-Q Software 1.7 offers two approaches for
analysis of oligonucleotides as it is well suited towards sensitive                     quantification for enhanced flexibility. The first approach
bioanalysis and enables the ability to detect and quantify                              discussed is the mass reconstruction approach, here
impurities/metabolites within the sample. Additionally the full                         quantification is undertaken based on the reconstructed spectral
scan MRMHR data can be assessed to gain an understanding of                             peak of the oligonucleotide, a unique feature of the SCIEX OS-Q
the oligonucleotide and impurity sequences.                                             Software 1.7. The raw charge states are reconstructed and the
                                                                                        reconstructed MS spectral peaks are integrated for

                         Raw Spectra                                                                Reconstructed Spectra
                            -10                           Zoom of [M-H]-10                                                   Theoretical Mass
                            694.1688
                                                                                                                               6947.755 Da
                                                                                                                                Δ 2.6 ppm
             Intensity

                             -9
                         -11 771.4114

                                    -8
                                  867.9623

                                        -7
                                      992.2411
                                                -6
                                             1157.6124   -5            -4                   -3
                                                      1389.3338     1736.9182           2316.2221

Figure 2. The TOF MS raw and reconstructed spectra of mU*mA*mU*mC*mC*mG*mC*mC*mU*mC*mG*mU*mG*mA*mG*mA*mA*mG*mA*mU.

                                                                                                                                                       p3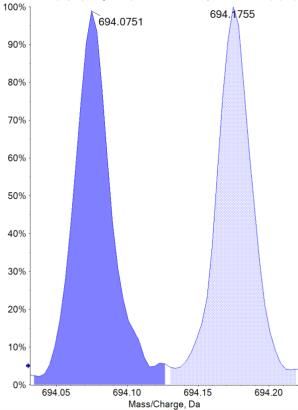
quantification. This approach has the potential to simplify data
processing and analysis as the appropriate charge states and
isotopes for quantification no longer need to be determined.

The reconstruction parameters employed for quantification can
be seen in Table 5.

Table 5. Source parameters.

                                                           Value

     Input Mass Range (m/z)                               600-2800

    Output Mass Range (Da)                                2000-7000

           Resolution                                      30000
                                                                       Figure 4. The calibration curve for the most abundant isotope of
           Step Mass                                          0.05
                                                                       the reconstructed spectra, 6951.8 Da. A linear regression with 1/x2
                                                                       weighting was applied to the data yielding r = 0.99199.

The most abundant isotope of the reconstructed mass spectra
was selected for quantification (Figure 3). The blue shading
shows the integrated area of this spectra peak which was
employed for quantification.

A linear regression with 1/x2 weighting was applied to the data         Table 6. The figures of merit for the calibration curve of the
                                                                        most abundant isotope of the analyte, 6951.8 Da.
with r = 0.99199. Figure 4 demonstrates the linear calibration
curve ranging from 1 – 1000 ng/mL. Table 6 and Table 7
                                                                               Actual             Calculated       Accuracy       CV
highlight the figures of merit of the assay for both the calibration           Conc.                Conc.            (%)          (%)
curve and the QCs respectively. While Figure 5 displays the                   (ng/mL)              (ng/mL)
signal of the blank and 1 ng/mL calibrant.                                        1                   1.1            107.2        17.3

                                                                                  2                   1.7             85.6         5.0

                                                                                  5                   4.7             94.4         2.3
                           6950.76      6951.76
                                                                                 10                   8.8             88.5         9.4

                                          6952.76                                20                  19.4             96.8         2.1

                                                                                 50                  54.5            108.9         1.2
                          6949.76
                                           6953.76                               100                 114.1           114.1         3.0

                                                                                 200                 217.3           107.6         5.1
            Intensity

                                                6954.75                          500                 225.4           100.5         0.5

                                                                                1000                 913.8            91.4         2.4
                        6948.76
                                                    6955.75

                                                      6956.76

                                                           6957.76

                                     Mass, Da

Figure 3. The most abundant isotope of the reconstructed spectra
was selected for quantification. The shaded blue integration of the
spectral peak is seen above.

                                                                                                                                         p4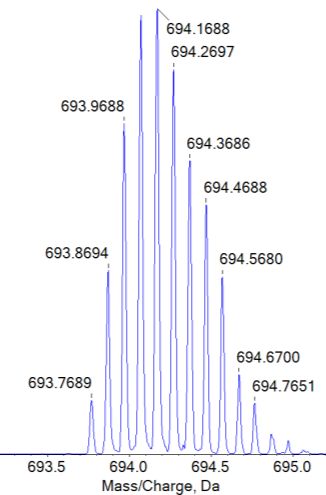
Blank                    LLOQ 1 ng/mL              Table 7. The figures of merit for the QCs for the most abundant
                                                                    isotope of the analyte, 6951.8 Da.

                                                                                      Actual                   Calculated          Accuracy           CV
                                                                                      Conc.                      Conc.               (%)              (%)
                                                                                     (ng/mL)                    (ng/mL)

                                                                                      Low                           4.49               89.8           2.3
     Intensity

                                                                                     Medium                         14.7               97.7           6.5

                                                                                      High                         694.0               92.5           2.7

                                                                    impurities was determined. A flagging threshold of >5% of the
                                                                    FLP was assigned to the percent relative abundances. The
                                                                    results are listed in Figure 6.
                             Time (min)

                                                                    Selected charge state quantification: The traditional approach
Figure 5. The blank sample and the LLOQ of 1 ng/mL for the
selected isotope, 6951.8 Da, used for mass reconstruction           for TOF MS quantification uses extracted ion chromatogram
quantification.                                                     (XIC) of chosen isotopic peaks of the selected charge states.
                                                                    This method can facilitate the quantification of using a discrete
                                                                    selected XIC peak or several XICs can be summed to improve
                                                                    S/N. In this example, the most abundant charge state, [M-H]-10,
                                                                    was selected for quantification and from the [M-H]-10 the two
The generated results demonstrate that the SCIEX TripleTOF          highest intensity isotopes were summed (Figure 7). As above a
6600+ LC-MS/MS System, in conjunction with the unique mass          linear regression of 1/x2 was applied to the data yielding r =
reconstruction feature of SCIEX OS-Q Software 1.7, was able to      0.99149 over the calibration range of 1 – 1000 ng/mL (Figure 8).
quantify the oligonucleotides extracted from plasma down to the
ng/mL level.                                                                         1. Two Selected Isotopes of [M-H]-10   2. XIC for Quantitation

As discussed, TOF MS is an attractive and flexible approach to
detect and quantify not only the FLP but also
impurities/metabolites in the sample as they can yield key
information. The highest calibrant sample was analyzed with
                                                                         Intensity

ProMass Software to identify and characterize the presence of
related impurities within the sample. For further details on this
workflow please refer to the SCIEX technical note “High
resolution analysis of synthetic oligonucleotides”.

The masses of the identified impurities were imported into
SCIEX OS-Q Software 1.7 and the relative abundances of the

                                                                    Figure 7. The most abundant isotopes of the [M-H]-10 selected
                                                                    for XIC generation and subsequent quantification.

                                                                    Table 8 and Table 9 highlight the figures of merit of the assay for
                                                                    both the calibration curve and the QCs, respectively.

Figure 6. The relative abundances of impurities in the sample.

                                                                                                                                                            p5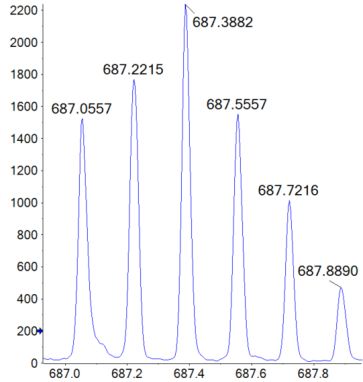
Table 8. The figures of merit for the calibration curve for the
summed isotopes of the selected [M-H]-10 charge state.

     Actual         Calculated         Accuracy           CV
     Conc.            Conc.              (%)              (%)
    (ng/mL)          (ng/mL)

       1                1.1              109.9            3.4

       2                1.7               87.6            9.5

       5                4.3               85.2            7.2

      10                8.8               88.5            5.8

      20                20.4             102.1            3.2

      50                55.9             111.8            4.6        Figure 8. The calibration curve for the summed isotopes of the [M-
                                                                     H]-10 charge state. A linear regression with 1/x2 weighting yielded r =
      100              109.4             109.4            2.9
                                                                     0.99149.
      200              224.0             112.0            4.7
                                                                     product ions with a m/z greater than 300 m/z were chosen for
      500              499.4              99.9            1.3
                                                                     quantification. Figure 10 shows the product ion spectra of
     1000              919.9              91.9            4.0
                                                                     [M-10]-10 with a collision energy of -35V.

                                                                     In this analysis the product ion 374.03 Da (mG*-) was the most
                                                                     intense and as such the transition 694.16 → 374.03 m/z was
Table 9. The figures of merit for the QCs for the summed
isotopes of the selected [M-H]-10 charge state.                      utilized for quantification. Again a linear regression of 1/x2
                                                                     provided the best fit for the data yielding r = 0.99116 over the
                                                                     calibration range of 1 – 1000 ng/mL (Figure 11). Table 10 and 11
      Actual           Calculated       Accuracy            CV
      Conc.              Conc.            (%)               (%)      display the figures of merit for both the calibrants and the QCs.
     (ng/mL)            (ng/mL)
                                                                     Finally, Figure 12 displays the signal of the blank and the LLOQ,
       Low                 4.3             86.4             3.9
                                                                     the 1 ng/mL calibrant. In this example, the enhanced selectivity
     Medium               15.7            104.5             4.9      of the MRMHR assay almost entirely removes any interferences
       High              718.7             95.8             4.3      from the extracted plasma matrix as seen in the blank spectra.
                                                                     This advantage is clear when comparing between Figure 9 and
                                                                     Figure 12.

The [M-H]-10 charge state of each impurity can also be employed                             Blank                     LLOQ 1 ng/mL

to assess the relative abundance of each impurity, this yielded
similar results (data not shown).

MRMHR workflows
MRMHR is a powerful targeted quantitative approach offering
                                                                                Intensity

additional selectivity than the TOF MS workflow. When an
MRMHR scan type is employed, the Q1 selects only the defined
precursor ion, this ion is then fragmented within Q2 and all
fragment ions are detected. The advantage of MRMHR is that all
product ions are detected, which enables the post-acquisition
selection of the most suitable product ion(s). Another key benefit
of this scan type is the ability to obtain sequence information
                                                                                                         Time (min)
about the analyte. The most abundant charge state [M-10]-10 was
selected for fragmentation. To ensure assay specificity only           Figure 9. The blank and the LLOQ of 1 ng/mL for summed
                                                                       isotopes of the selected [M-H]-10 charge state.

                                                                                                                                          p6
Table 10. The figures of merit for the calibration curve for the
MRMHR transition 694.16 → 374.03 m/z.

                  Actual      Calculated        Accuracy          CV
                  Conc.         Conc.             (%)             (%)
                 (ng/mL)       (ng/mL)

                   1              1.1             106.2           9.5

                   2              1.8             91.7            9.7

                   5              4.8             95.4            2.5

                   10             8.6             86.5            4.9

                   20             17.6            87.9            4.7

                   50             56.5            113.0           9.4

                  100             94.1            94.1            10.4
                                                                              Figure 11. The calibration curve for the transition 694.16 →
                  200            223.1            111.5           4.2
                                                                              374.03 m/z. A linear regression with 1/x2 weighting was applied to
                  500            526.4            105.3           3.2         the data yielding r = 0.99116.

                  1000          1070.0            107.0           5.1

Table 11. The figures of merit for the QCs for the MRMHR
transition 694.16 → 374.03 m/z.

                  Actual       Calculated        Accuracy          CV                         Blank                  LLOQ 1 ng/mL
                  Conc.          Conc.             (%)             (%)
                 (ng/mL)        (ng/mL)

                   Low             4.4              88.0           9.4

                 Medium            12.8             85.6           10.4

                   High           800.4            106.7           9.4
                                                                                  Intensity

                                                           mG*-
                                        mU*-

                                mC*-
                                                  mA*-                                                  Time (min)

                                                                          Figure 12. The blank and the LLOQ of 1 ng/mL for the transition
                                                                          694.16 → 374.03 m/z.
 Intensity (%)

                                  mU*mA*-

Figure 10. The MRMHR product ion spectra of the [M-H]-10 ion.

                                                                                                                                               p7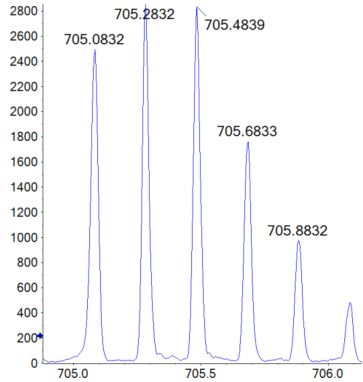
While a CE of -35V was optimal for quantification as it provided
the most intense product ions a lower CE of -20V for fragmenting
[M-H]-10 was more suitable for sequencing as it yielded larger
and more specific product ions. Given the fast scan speeds of
the TOF an additional transition could be included in the
experiment with a CE selected for sequencing. However, in this
investigatory example we elected only to consider the terminal
fragments and, therefore, a neat standard was injected (100 ng
on column) so low abundant fragments could be detected. The
fragment ion assessed were b and d-H2O from the 5’ end and y
and w-H2O from the 3’ end. A survey of the data for these ion
series revealed the instrument was able to provide 100%
sequence coverage of the analyte.

Figure 10 shows the MS/MS scan while Figure 14 shows six
                                                                              Figure 13. The identified fragments of the analyte, b and d-H2O
selected fragments ions, three from the 5’ end and three from the             from the 5’ end and y and w-H2O from the 3’ end.
3’ end. The demonstrated fragment ions were selected across a
wide intensity range to showcase the superior instrument
performance of the SCIEX TripleTOF 6600+ LC-MS/MS System
in negative ion mode and the ability to generate product ion
spectra of exceptional quality.

                 5’-mU*mA*mU*mC*mC*mG*mC*mC*mU*mC*mG*mU*mG*mA*mG*mA*mA*mG*mA*mU-3’

                      5’-
                                           d5-H2O-3                           d9-H2O-4                         d12-H2O-6
                 Intensity

                                                                        m/z

                                                                                                                           -3’
                                                y10-5                             y4-1                              y3-2
                 Intensity

                                                                      m/z

Figure 14. Selected fragments ions, three from the 5’ end and three from the 3’ end over a wide range of intensities.

                                                                                                                                            p8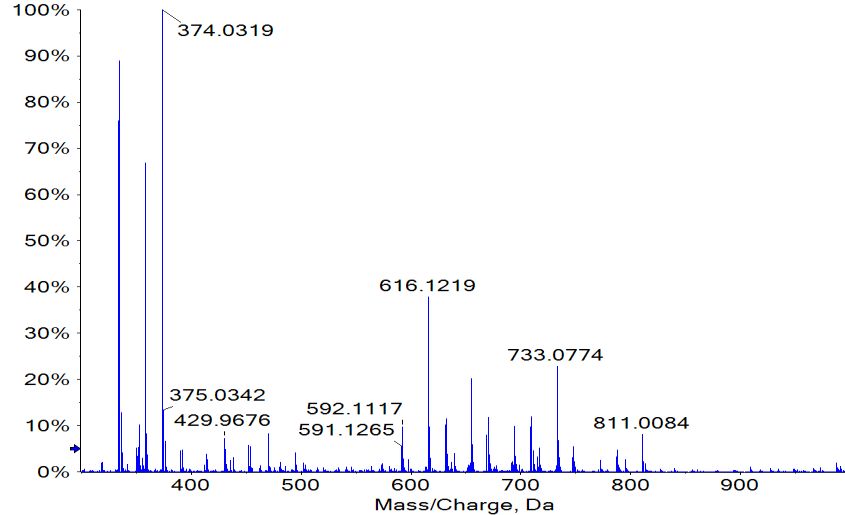
Conclusions                                                                                          References
• The three demonstrated workflows have provided similar                                             1.     Candish E, et al. 2019. High resolution analysis of synthetic
  quantitative performance with LLOQs of 1 ng/mL for                                                        oligonucleotides. SCIEX technical note RUO-MKT-02-
  mU*mA*mU*mC*mC*mG*mC*mC*mU*mC*mG*mU*mG*mA*                                                                10050-A.
  mG*mA*mA*mG*mA*mU in extracted plasmams/ms
• The SCIEX TripleTOF 6600+ LC-MS/MS and SCIEX OS-Q
  Software 1.7 offer the flexibility to select a quantitative
  workflow works best for your analyses
• Utilizing this HRMS platform the identity of the impurities was
  determined and quantified with TOF MS
• The generated high-quality MS/MS spectra was used to
  confirm the target sequence of the analyte

The SCIEX clinical diagnostic portfolio is For In Vitro Diagnostic Use. Rx Only. Product(s) not available in all countries. For information on availability, please contact your local sales
representative or refer to https://sciex.com/diagnostics. All other products are For Research Use Only. Not for use in Diagnostic Procedures.

Trademarks and/or registered trademarks mentioned herein, including associated logos, are the property of AB Sciex Pte. Ltd. or their respective owners in the United States and/or certain
other countries.

© 2020 DH Tech. Dev. Pte. Ltd. RUO- MKT-02 -11675-A. AB SCIEX™ is being used under license.

                                                                                                                                                                                               p9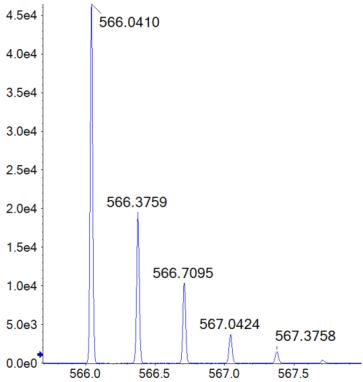
You can also read