AUSTRALIAN INFLUENZA SURVEILLANCE REPORT - Department of Health
←
→
Page content transcription
If your browser does not render page correctly, please read the page content below
AUSTRALIAN INFLUENZA
SURVEILLANCE REPORT
No. 07, 2018
13 to 26 August 2018
The Department of Health acknowledges the providers of the many sources of data used in this report and
greatly appreciates their contribution.
KEY MESSAGES
• Activity –Person to person transmission of influenza and influenza-like illness (ILI) in the community is low
and remains within or below the bounds of previous years. Rhinovirus was the most common respiratory
virus detected in patients presenting with ILI to sentinel general practices this fortnight.
• Severity –Clinical severity for the season to date, as measured through the proportion of patients
admitted directly to ICU, and deaths attributed to influenza, is low.
• Impact – Currently, the impact of circulating influenza on society is low.
• Virology – This fortnight, the majority of confirmed influenza cases reported nationally were
influenza A (85%).
ANALYSIS
1. Activity
Activity measures the capacity of the circulating influenza to spread person to person and may be measured
indirectly through systems that monitor influenza-like illness and more directly through systems that monitor
laboratory confirmed influenza.
Influenza-like illness
Overall, ILI in the community is low, at inter-seasonal levels and is within the historical range.
• Flutracking: 1.9% of Flutracking participants reported ILI (fever and cough) in the week ending
26 August 2018 (week 34; Figure 1). This is a slight decrease from the proportion reported in week 33
(2.0%). Activity this fortnight is below the range of the last five years.
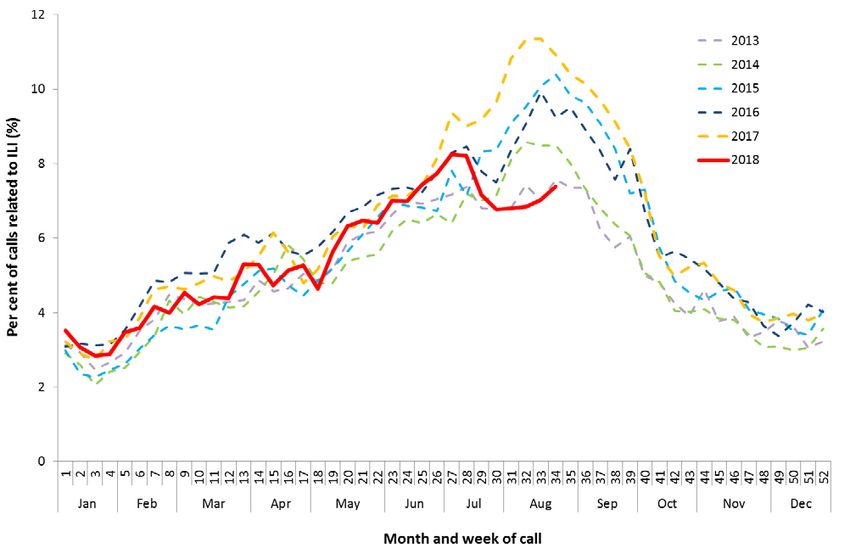
• Healthdirect: 7.4% and 7.0% of calls to the Healthdirect public health hotline were related to ILI in weeks
33 and 34, respectively (Figure 2). When compared to trends in recent years, the level of ILI activity
amongst callers is similar.
• Sentinel General Practitioners (ASPREN and VicSPIN): 5.5 per 1,000 consultations in sentinel general
practices were due to ILI in week 34 (Figure 3). This is an increase on the previous week of 4.6/1,000
consultations. ILI consultations have been increasing since May, but remain low. ILI consultations are
below the historical range for this time of year and have an overall increasing trend in activity.
Confirmed influenza
Influenza is circulating at low levels and is not a major cause of ILI this fortnight.
• Proportion of ILI with confirmed influenza seen by sentinel GPs: Of the 122 ILI cases presenting to
sentinel ASPREN GPs this fortnight who were tested for influenza, 7 (5.7%) had a positive result. This is a
decrease from the previous fortnight when 7.3% (11/150) of swabbed ILI patients tested positive for
influenza. Rhinovirus was the most common respiratory virus detected in swabbed patients this fortnight
(n=25, 20.5%).
• Proportion of ILI with confirmed influenza in sentinel labs: Detections of influenza across all sentinel
laboratories this reporting fortnight remained low (Figure 4). The pooled unweighted percentage of tests
positive for influenza across all sentinel laboratories was 7.9% in week 34, an increase from 6.1% reported
in week 33. Respiratory syncytial virus (RSV) was the respiratory virus most commonly detected by
PathWest and the Institute of Clinical Pathology and Medical Research this reporting fortnight. The most
commonly detected respiratory virus detected by the Victorian Infectious Disease Reference Laboratory
(VIDRL) was picornavirus in week 33, and coronavirus and in week 34. Rhinovirus was the respiratory virus
most commonly detected by Tasmania this reporting fortnight.
• NNDSS notifications: This fortnight there were 3,251 notifications of laboratory confirmed influenza to
the National Notifiable Diseases Surveillance System (NNDSS), which is an increase in reported cases
Page 1 of 12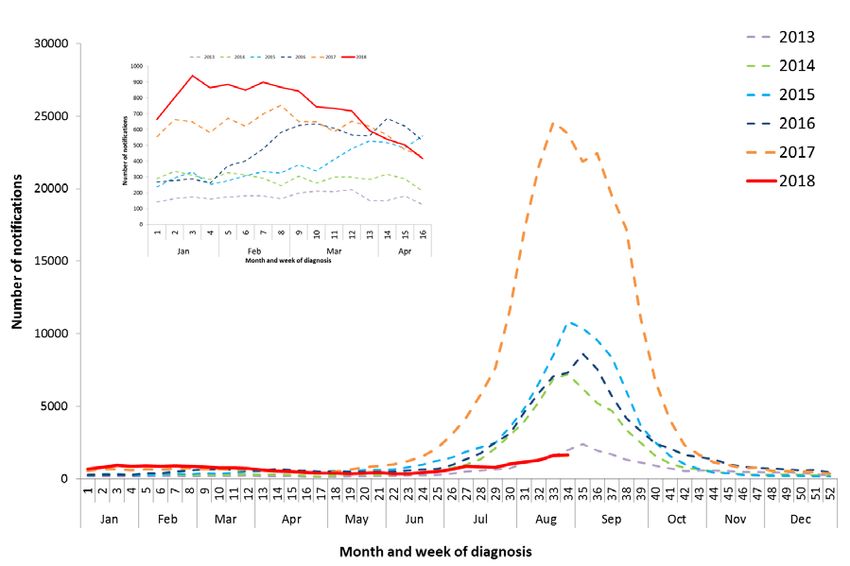
compared to the previous fortnight (n=2,436). There have been 25,291 notifications year to date. While
     national notifications of laboratory confirmed influenza were higher than usual in January and February,
     consistent with high activity experienced in the Northern Hemisphere at that time, notifications returned
     to normal range by March (Figure 5).
•   FluCAN: Since seasonal sentinel hospital surveillance began on 3 April 2018, a total of 293 people have
    been admitted with confirmed influenza (Figure 6). This is fewer hospitalisations than the 5 year average
    for the same period (n=1,226).
    Figure 1. Proportion of fever and cough among FluTracking participants, Australia, between May and
    October, 2013 to 2018, by month and week.

                                                                                                 Source: FluTracking

                                                                                                   Page 2 of 12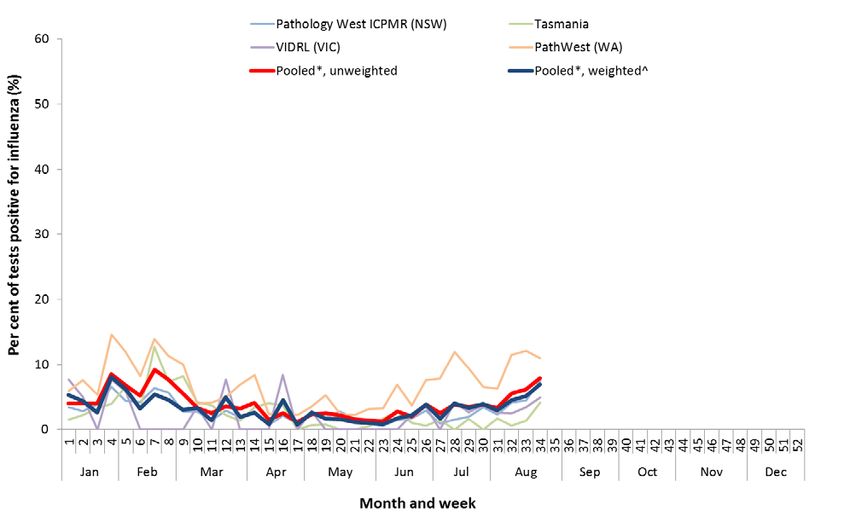
Figure 2. Per cent of calls to Healthdirect related to ILI, Australia, 1 January 2013 to 26 August 2018, by
month and week of call.

                                                                                                   Source: Healthdirect

Figure 3. Unweighted rate of ILI reported from sentinel GP surveillance systems, Australia, 1 January 2013 to
26 August 2018, by month and week.*

                                                                                            Source: ASPREN and VicSPIN

                                                                                                      Page 3 of 12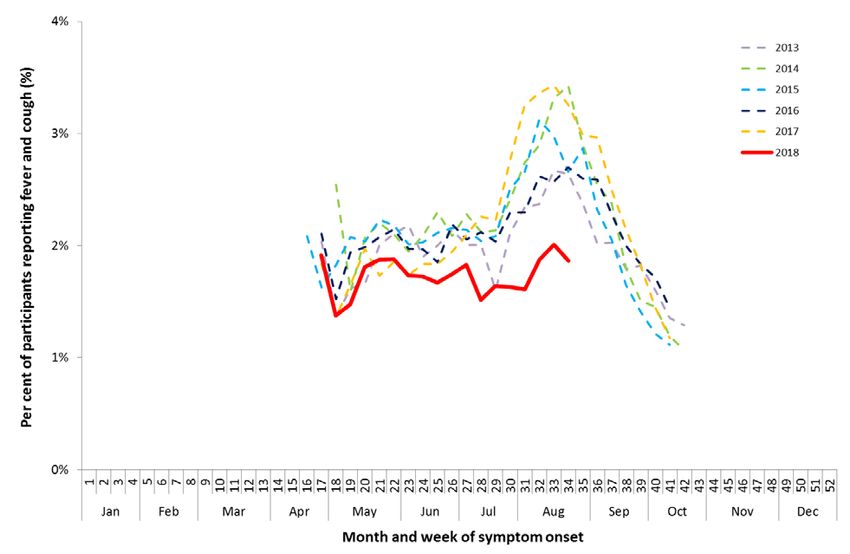
Figure 4. Proportion of sentinel laboratory tests positive for influenza, 1 January to 26 August 2018, by
contributing laboratory1 or jurisdiction and month and week.

          * Pooled percentage positive indicators should be interpreted with caution, noting that collectively pooled contributing laboratories are not
    representative of testing across Australia and individually contributing laboratories may not be representative of the jurisdiction in which they are
                                                                                                                                                    located.
                                                                     ^ Weighted according to jurisdictional population in which laboratories are located.
      The percentage of tests positive for influenza in the interseasonal period should be interpreted with caution due to small numbers of tests being
                                                                                    undertaken in this time, resulting in high variability in the indicators.

Figure 5. Notifications of laboratory confirmed influenza, Australia, 1 January 2013 to 26 August 2018, by
month and week of diagnosis.

                                                                                                                                             Source: NNDSS

                                                                                                                                           Page 4 of 12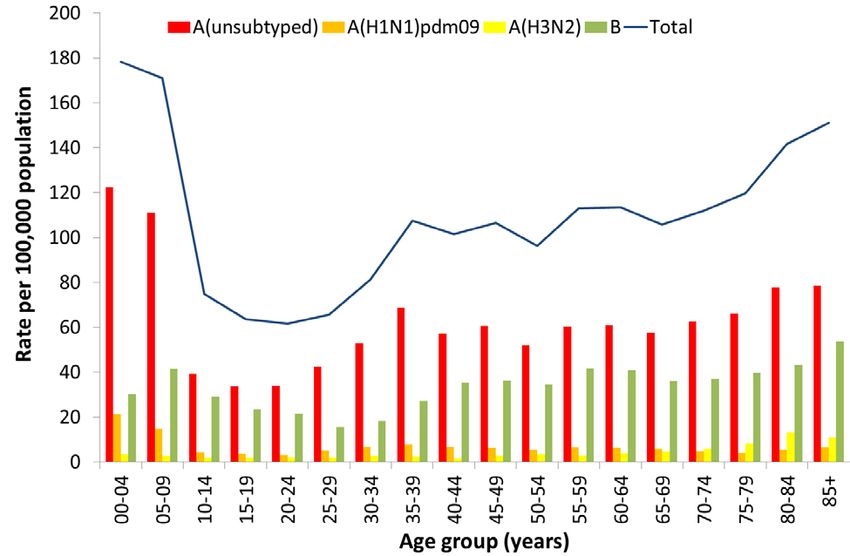
Figure 6. Number of influenza hospitalisations at sentinel hospitals, between March and October, 2013 to
2018 by month and week.

                                                                                                        Source: FluCAN
Geographical distribution of activity
• Jurisdictional reports: In the fortnight ending 26 August 2018, the geographic spread of influenza activity
   was reported by state and territory health departments as being sporadic in the Australian Capital
   Territory (ACT), both regions of Northern Territory (NT), Tasmania (TAS) and the Northwest region of
   Western Australia (WA). Activity was reported as being localised in all regions of QLD, South Australia (SA),
   Victoria (VIC) and the Rural South region of WA. New South Wales (NSW) and the Perth metro region of
   WA reported widespread levels of activity. There was no change in influenza activity compared to the
   previous fortnight in ACT, both regions of NT, the tropical region of QLD, TAS and the Northwest region of
   WA. An increase in activity was reported for NSW, the southern and central regions of QLD, SA, VIC, and
   the Perth Metro and Rural South regions of WA. (Figure 7).
• NNDSS: Of the 3,251 notifications of influenza reported to the NNDSS in the last fortnight, 1,386 were
   from NSW, 957 from QLD, 374 from VIC, 366 from WA, 115 from SA, 40 from ACT, 9 from TAS and 4 from
   NT (Figure 8). Of the 25,291 notifications of influenza reported to the NNDSS this year to 26 August 2018,
   8,592 from NSW, 7,656 were from QLD, 3,659 from VIC, 3,000 from WA, 1,818 from SA, 258 from ACT, 170
   from TAS and 138 from the NT.
For further information regarding influenza activity at the jurisdictional level, please refer to the following
State and Territory health surveillance reports:
•   ACT: Influenza report (http://health.act.gov.au/node/41)
•   NSW: Influenza Surveillance Report
    (http://www.health.nsw.gov.au/Infectious/Influenza/Pages/reports.aspx)
•   QLD: Statewide Weekly Influenza Surveillance Report (https://www.health.qld.gov.au/clinical-
    practice/guidelines-procedures/diseases-infection/surveillance/reports/flu)
•   SA: Weekly Epidemiological Summary (Influenza section)
    (http://www.sahealth.sa.gov.au/wps/wcm/connect/public+content/sa+health+internet/about+us/health+
    statistics/surveillance+of+notifiable+conditions)
•   TAS: fluTAS Reports (http://www.dhhs.tas.gov.au/publichealth/communicable_diseases_prevention_unit)

                                                                                                       Page 5 of 12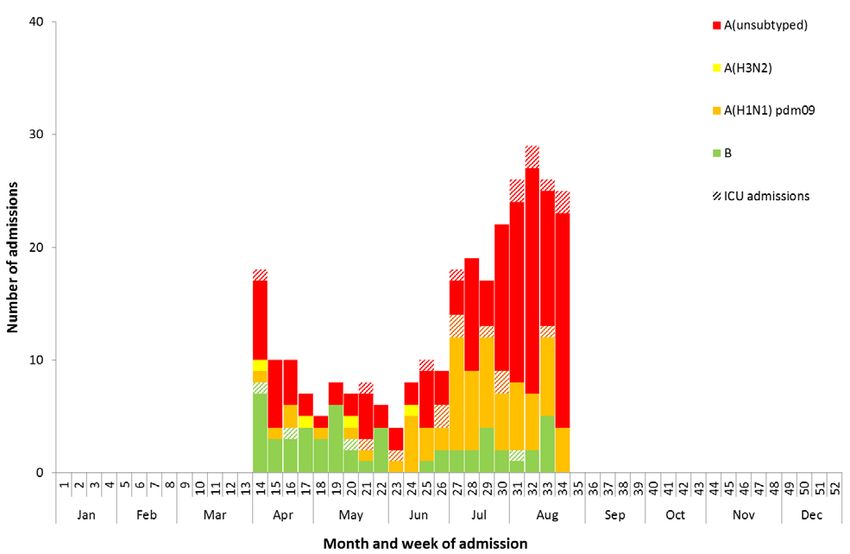
•   VIC: Influenza Surveillance Reports (https://www2.health.vic.gov.au/public-health/infectious-
    diseases/infectious-diseases-surveillance/seasonal-influenza-reports)
•   WA: Virus WAtch (http://ww2.health.wa.gov.au/Articles/F_I/Infectious-disease-data/Virus-WAtch)

Figure 7. Map of influenza activity by state and territory, Australia, 18 June to 26 August 2018.

Figure 8. Notifications of laboratory confirmed influenza, 1 January to 26 August 2018, by state or territory
and week.

                                                                                                     Source: NNDSS

                                                                                                    Page 6 of 12
2. Severity
Severity is a measure of adverse outcomes or complications as a result of influenza or influenza-like illness (ILI)
such as hospital referrals, admissions, need for intensive care and deaths. Measuring and understanding the
severity of circulating influenza is difficult to establish at the beginning of the influenza season. The proportion
of confirmed influenza cases with serious outcomes might be skewed initially because there are only a small
number of people notified with influenza at the beginning of the season. This means that the measure of
severity will vary substantially fortnight to fortnight until after the peak of the season when there is enough
data for measurements to stabilise. An assessment of severity be provided once the signals become clearer.
Intensive care admissions
• FluCAN: This fortnight, four of the 52 people admitted to sentinel hospitals with confirmed influenza were
admitted to ICU. Since seasonal sentinel hospital surveillance began on 3 April 2018, 25 (8.5%) of the 293
people admitted to sentinel hospitals with confirmed influenza were admitted to ICU.
Deaths in confirmed influenza cases
• NNDSS: So far in 2018, 40 influenza associated deaths have been notified to the NNDSS. The majority of
deaths were due to influenza A (75%, n=30). The median age of deaths notified was 80 years (range 2 to
100 years). The number of influenza-associated deaths reported to the NNDSS does not represent the true
mortality associated with this disease. The number of deaths is reliant on the follow up of cases to
determine the outcome of their infection. The follow up of cases is not a requirement of notification, and
are only inclusive of laboratory-confirmed cases of influenza. Due to retrospective revision, the variation
across jurisdictions in methodology, representativeness and timeliness of death data, and reporting of an
outcome of infection not being a requirement of notification, year on year comparisons of deaths in
notified cases of influenza may not be reliable.
3. Impact
Impact measures how the influenza epidemic affects society, including stress on health-care resources and
societal and economic consequences.
Absenteeism
• Flutracking: 1.4% and 1.2% of Flutracking survey respondents reported having ILI and taking time off
regular duties while unwell in the weeks 33 and 34, respectively. This is a low level of impact when
compared to trends in recent years.
Use of hospital beds
• FluCAN: Since seasonal sentinel hospital surveillance began on 3 April 2018, 4.3% of hospital beds
available in FluCAN hospitals were occupied by patients with confirmed influenza. This is a low level of
impact when compared to temporal trends.
4. Virology
National notification data
• NNDSS: In the reporting fortnight, 85% of notifications of laboratory confirmed influenza to the NNDSS
were influenza A (75% influenza A(unsubtyped), 8% influenza A(H1N1)pdm09 and 2% influenza A(H3N2)),
15% were influenza B and less than 1% were influenza A&B co-infections (Figure 9).
• NNDSS: For the year to 26 August 2018, 69% of notifications of laboratory confirmed influenza to the
NNDSS were influenza A (59% influenza A(unsubtyped), 7% influenza A(H1N1)pdm09 and 3% influenza
A(H3N2)), 30% were influenza B and less than 1% were influenza A&B co-infections or untyped. The
proportion of all notifications year to date reported as influenza A has ranged across jurisdictions from
55% in the NT to 77% in WA (Figure 10).
Reference Laboratory data
• World Health Organization Collaborating Centre for Reference and Research on Influenza (WHOCC):
From 1 January to 27 August 2018, the WHOCC characterised 568 influenza viruses. Of these, 52% were
influenza A(H1N1)pdm09, 28% were influenza A(H3N2), 19% were influenza B Yamagata lineage and 1%
were influenza B Victoria lineage.
Page 7 of 12Sentinel laboratory surveillance
• In the reporting fortnight, 93% of influenza positive samples detected in sentinel laboratories were
influenza A (55% were influenza A(unsubtyped), 34% influenza A(H1N1)pdm09, and 4% were influenza
A(H3N2)) and 7% were influenza B (Figure 11).
Sentinel GP surveillance
• ASPREN: Of the 7 influenza positive samples detected this fortnight through swab testing patients
presenting with ILI to ASPREN sentinel GPs, 6 were influenza A (H1N1)pdm09 and 1 was influenza B
(Figure 12).
Sentinel hospital surveillance
• FluCAN: Since seasonal sentinel hospital surveillance began on 3 April 2018, 79% of confirmed influenza to
sentinel hospitals were influenza A (51% A(unsubtyped), 27% influenza A(H1N1)pdm09 and 1% influenza A
(H3N2)) and 20% were influenza B. (Figure 13). Of the 25 patients admitted directly to ICU, 85% were
infected with influenza A (46% influenza A(unsubtyped) and 39% influenza A(H1N1)pdm09) and 15% were
infected with influenza B.
• The proportion of patients admitted directly to ICU was higher in patients infected with influenza
A(H1N1)pdm09 (14.6%), than in admitted patients infected with influenza A(H3N2) (8.0%) and influenza B
(7.4%).
Figure 9. Per cent of laboratory confirmed influenza, Australia, 1 January to 26 August 2018, by subtype and
week.
Source: NNDSS
Page 8 of 12Figure 10. Per cent of notifications of laboratory confirmed influenza, Australia, 1 January to 26 August 2018,
by subtype and state or territory.
Source: NNDSS
Figure 11. Proportion of sentinel laboratory tests positive for influenza and total number of specimens
tested, 1 January to 29 July 2018, by subtype and month and week.*
Page 9 of 12Figure 12. Proportion of respiratory viral tests positive for influenza in ASPREN ILI patients and ASPREN ILI
consultation rate*, Australia, 1 January to 26 August July 2018, by month and week.
Source: ASPREN
*unweighted ILI consultation rate is not available for week 30 due to data transmission issues.
Figure 13. Number of influenza hospitalisations at sentinel hospitals by subtype and ICU admission, 3 April
to 26 August 2018, by month and week.
Source: FluCAN
Page 10 of 125. At-risk Populations
National notification data
• NNDSS: So far in 2018, notification rates have been highest in children aged under 10 years (174.6
notifications per 100,000), with a secondary peak in adults aged 80 years or older (146.6 notifications per
100,000) (Figure 14). Where subtyping information is available, notifications of influenza A(H1N1)pdm09
were highest in children aged less than 4 years (21.3 per 100,000) and notifications of influenza A(H3N2)
were highest in adults aged 75 years and older (12.0 per 100,000). Notification rates for influenza B were
highest in adults aged 80 years and over (48.6 per 100,000), followed by adults aged 55-59 (41.6 per
100,000) and children aged 5-9 (41.5 per 100,000).
Sentinel hospital surveillance
• FluCAN: Since seasonal sentinel hospital surveillance began on 3 April 2018, 38% of people admitted with
confirmed influenza were children aged 15 years and younger, 38% were adults aged between 16 and 64
years, and 24% were adults aged 65 years and older.
Figure 14. Rate of notifications of laboratory confirmed influenza, Australia, 1 January to 26 August 2018, by
age group and subtype.
Source: NNDSS
6. Vaccine effectiveness
Australian Influenza Vaccines Composition 2018
The influenza virus strains included in the 2018 seasonal influenza vaccines in Australia are:
• A/Michigan/45/2015, (H1N1)pdm09-like virus;
• A/Singapore/INFIMH-16-0019/2016, (H3N2)-like virus; and
• B/Phuket/3073/2013-like virus, Yamagata lineage.
• B/Brisbane/60/2008-like virus, Victoria lineage.
The best way to determine how well the vaccine protects against circulating viruses during the season is by
determining the vaccine effectiveness. These estimates provide an indication of how effective the vaccine was
in providing protection against influenza infection, but can only be determined towards the end of the
influenza season.
Page 11 of 12WHOCC
From 1 January to 27 August 2018, 362 isolates were characterised for similarity to the corresponding vaccine
components by haemagglutination inhibition (HI) assay (Table 1). Influenza A(H1N1)pdm09 viruses and
viruses from both influenza B lineages appeared to be antigenically similar to the corresponding vaccine
components. Two each of Influenza A(H1N1)pdm09 and influenza B(Yamagata), and no influenza B(Victoria)
isolates were characterised as low reactors. The influenza A(H3N2) isolates that were able to be assessed by HI
assay appeared to be reasonably matched, although there are ongoing technical issues that significantly limit
the WHOCC’s capacity to fully assess the similarity of circulating viruses to the vaccine strain. Three
influenza A(H3N2) isolates were characterised as low reactors, and an additional 23 isolates were unable to be
characterised in the HI assay due to insufficient haemagglutination titre.
Table 1. Australian influenza viruses typed by HI from the WHOCC, 1 January to 27 August 2018.
Type/Subtype ACT NSW NT QLD SA TAS VIC WA TOTAL
A(H1N1) pdm09 13 66 2 71 9 0 1 35 197
A(H3N2) 3 27 3 39 5 0 0 1 78
B/Victoria lineage 0 1 1 2 0 0 0 0 4
B/Yamagata
lineage
3 35 10 27 4 0 0 4 83
Total 19 129 16 139 18 0 1 40 362
SOURCE: WHO CC
Note: Viruses tested by the WHO CC are not necessarily a random sample of all those in the community.
State indicates the residential location for the individual tested, not the submitting laboratory.
There may be up to a month delay on reporting of samples.
7. Antiviral Resistance
The WHOCC reported that from 1 January to 27 August 2018, none of the 190 influenza viruses tested for
neuraminidase inhibitor resistance, demonstrated reduced inhibition to the antiviral drugs Zanamivir or
Oseltamivir.
8. Data considerations
No one single system, including notification data, provides the full picture on influenza, because influenza is a
common disease and its presenting symptoms are non-specific. The epidemiology of influenza is informed by a
number of different systems based in the community, laboratories, primary care and hospitals, as well as
official deaths and notifiable diseases data. The information in this report is reliant on the surveillance sources
available to the Department of Health at the time of production.
Data in this summary is reported by International Organization for Standardization (ISO) 8601 weeks, with the
week ending on Sunday. Throughout the summary, where the year to date is presented, this includes data
from 1 January to 26 August 2018. NNDSS data were extracted on 29 August 2018. Due to the dynamic nature
of the NNDSS and other surveillance systems, data in this report are subject to retrospective revision and may
vary from data reported in other national reports and reports by states and territories. Detailed notes on
interpreting the data presented in this report are available at the Department of Health’s Australian Influenza
Surveillance Report website (www.health.gov.au/flureport).
While every care has been taken in preparing this report, the Commonwealth does not accept liability for any
injury or loss or damage arising from the use of, or reliance upon, the content of the report. Delays in the
reporting of data may cause data to change retrospectively. For further details about information contained in
this report please contact the Influenza Surveillance Team (flu@health.gov.au).
Page 12 of 12You can also read