How far does the use of concrete learning resources improve times table recall among low attaining Year 3 and 4 pupils?
←
→
Page content transcription
If your browser does not render page correctly, please read the page content below
How far does the use of concrete learning resources
improve times table recall among low attaining Year 3 and
                                      4 pupils?

                  Orchard Primary School, Lower KS2 Phase

Abstract

This study aims to investigate the efficacy of using concrete learning resources as a
times table teaching aide with underperforming pupils. It provides a review of the
existing literature on the subject, explains the contextual factors for the study, sets out
the research process, and provides an analysis of the data collected. Overall, this
study found that there is there is some emerging evidence that concrete learning
resources may have improved times table recall, along with preliminary evidence that
gender and teaching assistant may play a role in the efficacy of such resources for
improving outcomes. Qualitative evidence suggests that pupils may prefer digital
methods for learning times tables, rather than concrete resources.

Introduction

Orchard Primary School is a larger than average and high-achieving primary school
in Hackney, London. The school serves a diverse and vibrant community, with a higher
than average number of disadvantaged pupils. Working in this context, Orchard
Primary School is able to achieve excellent results in statutory national tests, in part
through a combination of rigorous ongoing assessment and targeted interventions.

In 2018, Schools Minister Nick Gibb announced the decision that in the academic year
2019/20 schools would be required to carry out a new ‘Multiplication Tables Check’.
He noted that fast recall of times tables were “critical for everyday life” and would allow
children to “solve problems quickly and flexibly”. This provided a new impetus to
ensure that pupils at Orchard were able to recall all their times tables to 12 with speed
and review our assessment and intervention provision to achieve this end.
There is a growing body of evidence on the effectiveness of particular techniques and pedagogies for supporting the learning of times tables. A study by Monica Wong and David Evans (2007) found that regular times table practise over a four week period led to improvements in test score and this improvement was maintained when the pupils were re-tested after a four week interval with no practise. A further study made by a group of Camden teachers found that developing pupil fluency and seeing links between known and unknown facts was key to developing speed of recall in times tables (Frood, 2017). In addition, Brendefur (2015) found that by combining different methods of representing and discussing times tables, greater progress was made in recall as compared to the control group who only memorised facts by rote. More broadly, work on the use of concrete resources as a teaching aide is considerable. Originally conceptualised by Bruner as a model from enactive to iconic to symbolic (Leong, Ho, & Cheng, 2015) the theory has gained further popularity from its use in the Singapore maths program’s focus on a concrete – pictorial – abstract (CPA) framework. Chang S. H., Lee N. H., and Koay P. L., (2015) argue that the CPA model is best implemented with close co-ordination between teacher and learner. After this review of existing research, a project was developed to investigate the impact of using concrete learning resources as a teaching aid. The target of the study would be lower attaining pupils in years 3 and 4. The measure of impact: their accuracy of times table recall under a fixed time limit. This target group would be an ideal group as they were already underperforming their peers - by on average one term's progress - and any additional progress made due to the intervention would enable them to effectively close the gap. The aim of the action research project was, in brief, to measure the impact of concrete resources on the times tables progress of underperforming pupils in Years 3 and 4. By ascertaining the degree of impact from an intervention of this type, we can refine our deployment of additional support staff and hone our intervention strategy across the phase for further impact in the academic year 2020-2021.
To further target the research project the intervention was limited to Lower Key Stage
2 (Years 3 and 4); a key age group as they are directly in line to sit the new
Multiplication Tables Check. The intervention would be delivered by classroom
support staff during the start of the maths lesson for 5 minutes for each child involved.
The intervention ran from January to March 2020. Key data collection points would be
a baseline data collection in September and October 2019 and then collection at
intervals during the intervention.

Research Process
The intervention was to expose the target children to different concrete models that
would represent the times table that they were learning. This would include resources
such as numicon, arrays and peg boards. The teaching assistant would ask the
children to match the times table, the answer and then create a model of the
calculation using the selected resource for that day. The teaching assistant would
discuss the problem with the child and encourage the child to talk through what they
were doing as they matched the resources.

The multiplicity of different resources were used to provide many different models and
ways of looking at the problem. As Lee (2010) writes, providing a range of models can
“allow pupils to reflect on difficult concepts … and allow them access to some of the
nuances of these”. Each week would focus on a different times table and the pupils
would be exposed to multiple ways of looking at the same times table across the week.
Over a number of weeks, it was hoped that the children would develop a deeper and
more concrete understanding of the maths behind the times table and their fluency of
recall would subsequently improve.

Robust data is already collected by the school to support accurate times table teaching
across the school. This data collection took the form of a fortnightly times table test
that all pupils sit. The test was 35 questions that were presented cold (e.g. 5 x 7 =)
although they also included missing number problems that tested pupils' knowledge
of the inverse (e.g. _ x 7 = 35).
This research project adopted an interrupted time series design. This involved
exploring the times table recall progress of pupils at three points in time prior to the
intervention (tests 1, 2 and 3), to establish their progress trajectories without the
intervention, followed by exploring their progress after the intervention for a further
three points in time (tests 7, 8 and 9). Their trajectories prior to the intervention were
then compared with their progress after the intervention, with any differences in
progress trajectories revealing how impactful the use of concrete resources are. The
whole data sets are available in appendix 1. As an additional point of comparison, data
from other low performing pupils was collected to provide a control group.

To deepen the study, three ‘case studies’ were selected to qualitatively explore how
and why concrete resources do or don’t improve times table recall. Three pupils were
selected: one pupil whose performance worsened, one pupil who continued to
underperform, and one pupil whose performance improved. The researcher carried
out semi-structured interviews with each pupil to explore their experiences of the
concrete learning resources and if and how they made a difference to their experience
of learning times tables. The range of questions asked during the interview process
can be found in appendix 2.

Findings

Data    was    analysed    in   two    key   ways:    raw    attainment   and   percentage
increase/decrease in test score over time.

As can be seen in Chart 1, the mean data scores for pupils went up over time, as was
expected given that they were participating in weekly times table learning every week
over the period. There is also evidence of heightened progress after the intervention
compared with before; the biggest jump in test score took place between week 7, just
after the intervention, and week 8. However, this was not sustained, and average
attainment fell at test 9 (albeit still above test 7 results).

There was no clear difference between boys and girls although boy’s attainment did
dip between the administration of test 3 and 7, whereas girls’ attainment rose. This
provides some preliminary evidence that girls may respond better to concrete
resources than boys, but this warrants further investigation.

Chart 1: Average percentage score of all pupils.

Chart 2: Average percentage score of girls.

Chart 3: Average percentage score of boys.
Very significant variation in attainment can be seen when the data is broken down by
class (Chart 4).
Chart 4: Average test score (%) by class.
Pupils from Year 4 classes (Classes 4 – 6) achieved higher scores on average with
Class 6 outperforming the others. While it would be expected that pupils a year older
would perform better – the reasons for Class 6 outperforming are less clear. It could
be due to having a more consistent teaching assistant performing the intervention or
due to other confounding factors. The role of the teaching assistant in influencing the
extent to which concrete resources help to improve times table recall warrants further
investigation. As well as analysing mean test score, it is also useful to examine the
rate of week on week progress between tests, and before and after the intervention.
By looking at the rate of progress across the study shows there was no overall trend
(Table 1). The percentage change ranged from -21% to +71%. There was a significant
drop in progress when pupils sat the last test. This was particularly noticeable in Year
3 pupils whose progress was negative whereas the Year 4 pupils plateaued.
Table 1: Showing average scores and % increase in scores week on week.
Average % increase, week on % increase, week on week % increase, week on week
Score week (year 3) (year 4)
Test 1 5
Test 2 8 60 0 114
Test 3 11 38 133 7
Intervention
Test 7 14 27 -14 44
Test 8 24 71 133 52
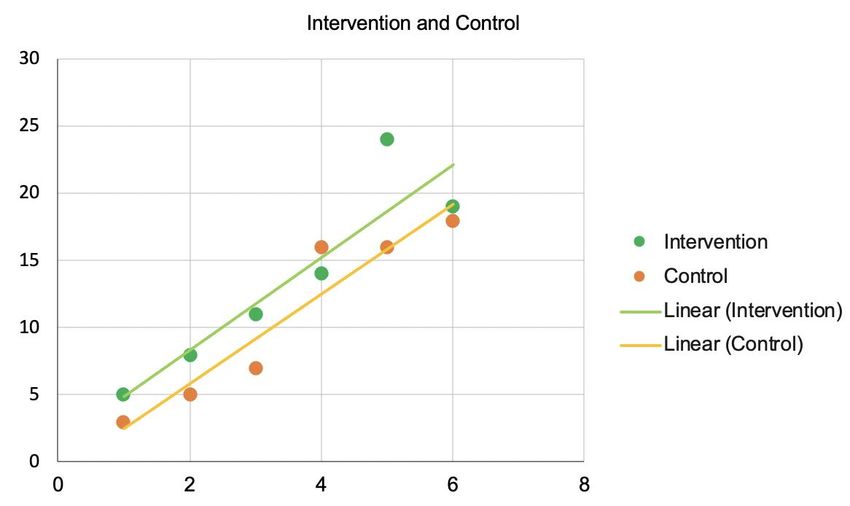
Test 9 19 -21 -57 0In order to assess how far these changes over time would have happened had there been no intervention, it is useful to compare the results of the pupils in the intervention with the results of the pupils in the control group (who had no intervention). By comparing to the control group (Chart 5), it is clear that average trends in progress were not significantly different when children took part in the intervention. Trend lines remain close to each other and no accelerated progress is noticeable in the intervention group. However, conclusions drawn by comparing to the control group should be treated with some caution as the control group are not an ideal comparator due to them being selected from slightly higher attaining pupils, and therefore differences between groups other than the intervention may explain differences in test scores. Chart 5: Intervention and control group average progress. Qualitative findings To explore the quantitative findings in more depth, qualitative interviews were also conducted with pupils in the intervention group. Interviews revealed that in general
pupils enjoyed using concrete resources and found that the intervention was
something that they looked forward to. One pupil stated: “I like the work I do with Miss
___ … it helps me with my times table and I can get a good score” The intervention
was found to be of a good length and the fast pace suited pupils, “It is fun when we do
it as it is quick”. Pupils felt that they made progress when doing the intervention, “I
have worked hard on my times table … working with Mr ___ has made me better at
my 3s”.

Interestingly though, when asked what the pupils felt helped them learn their times
tables the most, all favoured digital methods of learning: “I think times tables
RockStars is the best because it is fun”, one reported, “I like to use the iPad and it
helps me because it is fast,” another added.

Conclusion

While this research project has illuminated and clarified thinking about times table
teaching, it has also posed new questions and challenged notions of how to effectively
intervene to accelerate progress among lower attaining groups. The results show that
while progress was made, concrete resources are not a panacea. Indeed, although to
develop a good understanding of mathematic concepts, concrete resources are an
invaluable teaching aide, in this study their use in developing fast recall of
memorisable facts remains inconclusive.

Understanding how fast recall can be developed more broadly will remain a key focus
for teaching at Orchard and this project was a valuable exercise to further refine the
suite of tools available to the teaching body. To further understand the effectiveness
of the various methods for teaching times tables, an approach that trialled different
resources or techniques in parallel might prove to be enlightening. There have been
previous studies made on the use of times table websites to improve recall, but
carrying out a further comparison of concrete vs digital resources (or a combination
thereof) could provide interesting insights into their relative merits. Another interesting
avenue to explore would be to engage parents in the research process and gather
data about the impact the home environment on pupil attainment and progress. Lastly,
the role of gender and teaching assistant in influencing the efficacy of concrete
resources in times table learning warrants further investigation.

References

Brendefur, J., Strother, S., Thiede, K., and Appleton, S. (2015) Developing
Multiplication Fact Fluency. Advances in Social Sciences Research Journal

Available at:
https://scholarworks.boisestate.edu/cgi/viewcontent.cgi?referer=&httpsredir=1&articl
e=1150&context=cifs_facpubs

Chang S. H., Lee N. H., and Koay P. L., (2015) Concrete-Pictorial-Abstract:
Surveying its origins and charting its future. Association of Mathematics Educators,
Singapore. Available at: https://repository.nie.edu.sg/bitstream/10497/18889/1/TME-
16-1-1.pdf

Frood, K. (2017) Learning the Times Tables: teachers collaborate to find the most
effective strategies. Primary and Early Years Magazine. Available at:
https://www.ncetm.org.uk/resources/50240

Gibb, N. (2018) Multiplication tables check trials to begin in schools. Department for
Education. Available at: https://www.gov.uk/government/news/multiplication-tables-
check-trials-to-begin-in-schools

Lee, C. (2010) Modelling In The Mathematics Classroom. Association of Teachers of
Mathematics. Available at:
https://www.atm.org.uk/write/MediaUploads/Journals/MT171/Non-Member/ATM-
MT171-28-31.pdf

Leong, Y. H., Ho, W. K., and Cheng, L. P. (2015). Concrete-Pictorial-Abstract:
Surveying its origins and charting its future. The Mathematics Educator, 16(1), 1-18.
Available at: http://math.nie.edu.sg/ame/matheduc/tme/tmeV16_1/TME16_1.pdf

Wong, M., and Evans, D. (2007) Improving basic multiplication fact recall for primary
school pupils. Mathematics Education Research Journal. Available at:
https://link.springer.com/article/10.1007/BF03217451
Appendices

Appendix 1

Raw percentage scored by all pupils.

                       Test 1    Test 2   Test 3   Test 7   Test 8   Test 9

Student 1                0         0        0        3       14        0

Student 2                0         0        0        9        9        20

Student 3                6         9        0       14       23        14

Student 4               14         3       17        6       14        11

Student 5                0         6        0        3        6        0

Student 6                0         3        6        6       17        0

Student 7                6         3        6        3       14        0

Student 8                0         0        9        3        3        3

Student 9                3         0       26        9       26        6

Student 10               0        11       20       31       37        45

Student 11               9        14       11       20       23        23

Student 12               0        11       11        9       14        6

Student 13              11        14       14       11       37        17

Student 14               3         3        6        6       20      no data

Student 15              14        17       14       31       37        37

Student 16               9        20       26       46       51        51

Student 17              11        29       26       31       60        63

Average                  5         8       11       14       24        19
Appendix 2 Interview questions: What resources help you to learn your times tables? What makes learning your times tables difficult? Do you enjoy using numicon to learn your times tables? Do you enjoy using pegboards to learn your times tables? Do you enjoy using arrays to learn your times tables? How long do you practise your times tables for? Do you enjoy learning your times tables? In the last week, how often did you practise your times tables? This year how have you improved in your times table knowledge?
You can also read