Meteors and meteorites spectra - Meteor News
←
→
Page content transcription
If your browser does not render page correctly, please read the page content below
Proceedings of the IMC, Egmond, 2016                                                                                        1

                               Meteors and meteorites spectra
Jakub Koukal1,2, Jiří Srba1,2, Sylvie Gorková1,2, Libor Lenža1, Martin Ferus3, Svatopluk Civiš3, Antonín
                      Knížek3, Petr Kubelík3, Tereza Kaiserová3 and Pavel Váňa3
                1
                    Valašské Meziříčí Observatory, Vsetínská 78, 75701 Valašské Meziříčí, Czech Republic
                        j.koukal@post.cz, sgorkova@astrovm.cz, jsrba@astrovm.cz
            2
                SMPH, Society for Interplanetary Matter, Kraví hora 522/2, 61600 Brno, Czech Republic
            3
                J. Heyrovský Institute of Physical Chemistry, Academy of Sciences of the Czech Republic,
                                     Dolejškova 3, 18223 Prague 8, Czech Republic
                   martin.ferus@jh-inst.cas.cz, svatopluk.civis@jh-inst.cas.cz

   The main goal of our meteor spectroscopy project is to better understand the physical and chemical properties of
   meteoroids. Astrometric and spectral observations of real meteors are obtained via spectroscopic CCD video
   systems. Processed meteor data are inserted to the EDMOND database (European viDeo MeteOr Network
   Database) together with spectral information. The fully analyzed atmospheric trajectory, orbit and also spectra of a
   Leonid meteor/meteoroid captured in November 2015 are presented as an example. At the same time, our target is
   the systematization of spectroscopic emission lines for the comparative analysis of meteor spectra. Meteoroid
   plasma was simulated in a laboratory by laser ablation of meteorites samples using an (ArF) excimer laser and the
   LIDB (Laser Induced Dielectric Breakdown) in a low pressure atmosphere and various gases. The induced plasma
   emissions were simultaneously observed with the Echelle Spectrograph and the same CCD video spectral camera
   as used for real meteor registration. Measurements and analysis results for few selected meteorite samples are
   presented and discussed.

1 Introduction                                                  qualitative determinations of the impacting body
                                                                composition but also the assignment of spectral lines for
Main goal in the meteors spectroscopy is to better              products from the meteorite alterations and plasma
understand the physical and chemical properties of              interactions in atmosphere.
meteoroids by using simultaneous video and spectral
observations of meteors compared with meteoritic
                                                                2 Equipment and data reduction
material laboratory spectra. Spectral observations of
meteors are now obtained via fixed (at Valašské Meziříčí        Spectrographs use a highly sensitive CCD video camera
Observatory) and mobile spectroscopic CCTV systems.             VE 6047 EF/OSD (spectrograph VM_N) and CMOS
All records of meteors and processing data (orbital             video cameras QHY5L-IIM (spectrographs VM_NW and
elements, speed of deceleration, etc.) are inserted to the      VM_SW). The VE 6047 EF/OSD camera is equipped
EDMOND database (European viDeo MeteOr Network                  with a 1/3” CCD chip Sony ICX 673AKA with an
Database) together with spectral information (Kornoš et.        effective resolution of 720 × 576 px, resolution of the
al., 2014a). Another very valuable source of the physical       VM_N spectrograph is 30,4 Å/px (Koukal et. al, 2015).
and chemical properties of meteoroids are spectra taken         The QHY5LII-M camera is equipped with a 1/3” CMOS
by BRAMON (BRAzilian Meteor Observation Network).               chip Aptina MT9M034 with an effective resolution of
This network covers the southern hemisphere and is a            1280 × 960 px. The field of view is 80 o × 60o
source of information about the little-known southern           (spectrograph VM_SW) and 89o × 67o (spectrograph
hemisphere meteor showers.                                      VM_NW), these systems use fast Tamron megapixel
                                                                lenses (f/1.0) with a variable focal length (3-8 mm). FOV
Simultaneously, our target is the systematization of            and resolution of the CMOS chip enables the use of
spectroscopic emission lines for the comparative analysis       holographic diffraction grating with a density of 1000
of meteor spectra. The solids will be irradiated using          lines/mm. In this configuration the spectrograph reaches a
excimer and PALS lasers (Na, Ti, Mg, Al, Si, Fe, and            stellar limiting magnitude of +4.5m, the faintest recorded
Ca), their simple binary oxides, sulfides, minerals and         meteors then have a relative magnitude of up to +2.0 m.
real sample of meteorites. The LIDB (laser-induced              The magnitude of meteors with measurable spectrum
dielectric breakdown) in a gas media representing the           have to be at least –2.0m.
atmospheres (O2, N2, Ar and CO2) will also be
spectroscopically characterized. These spectra will be          The detection of meteors is done by UFOCapture
recorded in situ on the discharges and excimer laser            software1, and for the astrometric and photometric
ablations using a Fourier time resolved high resolution         processing UFOAnalyzer software2 (SonotaCo, 2009) is
spectrometer Bruker, a high resolution Echelle                  used. The resulting video is divided into individual
spectrograph LLA and a CCD spectrograph Ocean
Optics. Complying data will allow for not only                  1
                                                                    http://sonotaco.com/soft/UFO2/help/english/index.html
                                                                2
                                                                    http://sonotaco.com/soft/download/UA2Manual_EN.pdf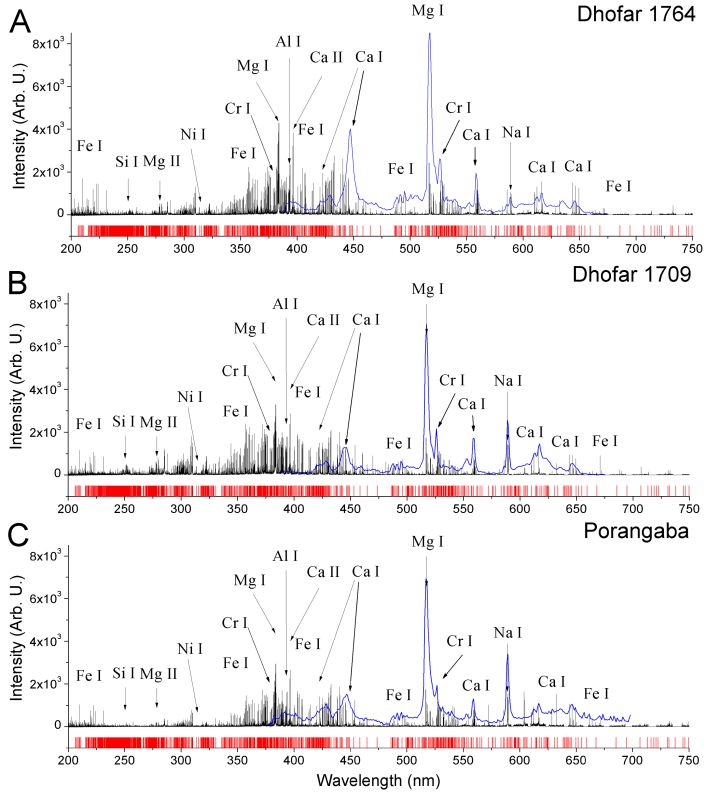
2 Proceedings of the IMC, Egmond, 2016
images (frames), every image is subsequently a dark In our measurement, the spectrograph was set to trigger a
frame and flat field corrected with frames captured by the 500 ns leaser pulse and to start the measurement with a
cameras VE 6047 EF/OSD and QHY5LII-M. Orbits of delay of 4 μs with a gate open for 5 μs with the
meteoroids in the solar system are calculated using the accumulation of 3500 counts and 30 accumulations of the
software UFOOrbit3 (SonotaCo, 2009). The deceleration signal. The positive column discharge was maintained by
is derived from this software as an exponential fit of the a high-voltage transistor switch applied between the
actual speed of the meteor for each frame. Spectrograph stainless steel anode and the grounded cathode of the
calibration in the x-axis (wavelength) was performed discharge tube (25 cm long with an inner diameter of 12
using a calibration neon lamp. Calibration was performed mm). The air plasma was cooled by water in the outer
as non-linear, using 6 multiplets of neon emission lines at jacket of the cell. The voltage drop across the discharge
wavelengths between 5852 and 7032 Å. The resulting was 1200 V, and the current was 250 mA.
basic spectrograph resolution was determined from 5
independent measurements at 9.7 Å/px (spectrograph
VM_SW) and 10.8 Å/px (spectrograph VM_NW). The
calibration of the emission line intensity (y-axis) was
performed using a diagram of relative sensitivity CMOS
Aptina MT9M034 at a wavelength between 3500 and
9000 Å (Figure 1). For the identification of the emission
wavelengths of the individual elements the revised tables
were used (Moore, 1972).
Figure 2 – Comparative spectroscopy in the laboratory of the J.
Heyrovsky Institute of Physical Chemistry (the Czech Academy
of Sciences) – the Echelle ESA 4000 high resolution
spectrograph and the astronomical spectrograph QHY5LII-M.
Figure 1 – Relative spectral sensitivity of CMOS chip Aptina
MT9M034.
3 Comparative experiments with LIBS
The meteoroid plasma was simulated in our laboratory by
a laser ablation of meteorites samples using a Lambda
Physik (ArF) excimer laser. Comparative experiments
with atmospheric gases have been performed using a
Laser Induced Breakdown in gases and electric
discharges. The emission spectra of plasma were
simultaneously observed with the Echelle Spectrograph
and the astronomical camera (Figure 2, 3 and 8).
The laser emits ~10- ns pulses on a wavelength of 193
nm and an energy of 200 mJ. The Laser beam was
focused using a calcium fluoride lens (focal length of 50
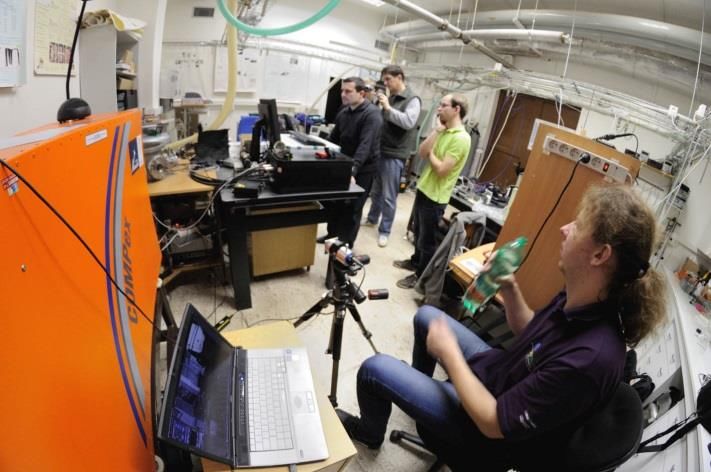
mm) on a solid target (a sample of a meteorite) attached Figure 3 – Global survey on ablation emission spectra of all
on the XYZ rotation stage. The system is placed in a three samples of meteorites with assignment of the most
vacuum interaction chamber equipped with a collimator prominent lines. The spectrum is also filled with a large number
connected directly with a high resolution Echelle of Fe lines. Their positions are marked by red sticks below. In
the figure, the spectrum recorded by the meteor spectrographic
Spectrograph (ESA 4000, LLA Instruments GmbH,
camera is imprinted in blue.
Germany). The spectrograph allows simultaneous
measurement of complex spectra within the entire 200 –
780 nm UV / VIS – region with an effective resolution First of all, high resolution spectra of ablation plasma
ranging from 0.005 nm (200 nm) to 0.019 nm (780 nm). measured by Echelle spectrograph have been processed
by the Calibration Free Method. The positions of the
most prominent lines are depicted in Figure 3.
3
http://sonotaco.com/soft/UO2/UO21Manual_EN.pdf
Proceedings of the IMC, Egmond, 2016 3
Figure 4 shows a Lorentzian fit of the Fe I 426.03 nm prominent emission lines, i.e. Na, Mg, Fe, Ni, Cr, Al, Si
emission line in case of all the ablation spectra. and Ca (Figure 7).
Figure 4 – Lorentzian fits of the Fe I emission line in all three
ablation samples. For this clearly detectable line, Konjevič et al.
estimated a line parameter of 0.11 A/nm. Using this values and
FWHM of this line in all three measurements estimated using
the fit, we obtain from the equation a mean electron density of
3.02 × 1016 cm-3.
Figure 5 – Simulation of the meteoroid airglow by a laser
induced breakdown in the air (black curve, low resolution
spectrum) and an electric discharge (upper red low resolution
and lower red high resolution spectra).
Spectra of laser induced breakdown and discharges in the
air have been measured and assigned in order to identify
using experimental methods the atmospheric bands
featuring in the meteor spectra (Figure 5). In the
discharge, we detected strong emission spectrum of N2
(C3Πu – B3Πg, around 330 nm, second positive band),
B3Πg – A3Σu+, around 650 nm, the first positive band)
and very weak emission of N2+ (B2Σu+ – X2Σg+, first
negative band). The most prominent atomic species are
ions O II, N II and weak lines of N III together with
neutral N I and O I above 700 nm.
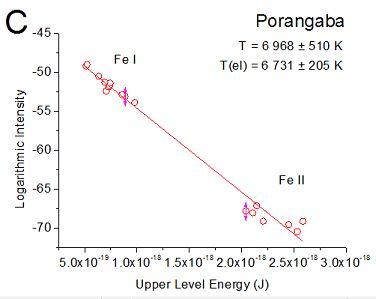
The temperature of the experimental high resolution Figure 6 – The temperature of experimental high resolution
spectra was estimated by using a Boltzmann and Saha- spectra was estimated using a Boltzmann and Saha-Boltzmann
Boltzmann plot of the Fe I and Fe lines in the spectra. plot of Fe I and Fe lines in the spectra. Every particular line of
Every particular line of Fe was fitted by a Lorentz profile Fe was fitted by a Lorentz profile and the integral intensity was
and the integral intensity was calculated (Figure 6). calculated. The slopes correspond to an electron temperature
Te = 8 566 ± 115 K.
Using calibration free data processing we calculated
concentrations CS of the elements with the most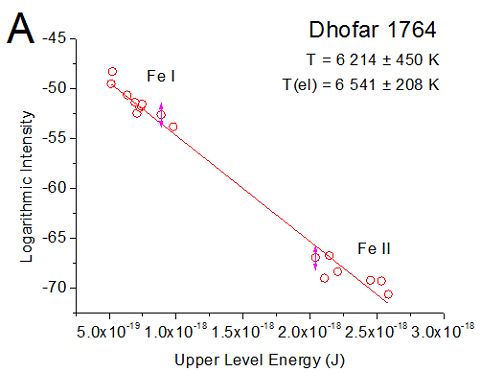
4                                                                                       Proceedings of the IMC, Egmond, 2016

Figure 7 – Elemental abundances in all three samples of meteorites estimated using CF-LIBS technique.

Figure 8 – The ablation emission spectrum of the Jiddat al Harasis meteorite (JAH 815) – the comparative measurement from the three
sources. The measurement was performed using an Echelle ESA 4000 high resolution spectrograph, a CCD spectrograph Ocean Optics
and an astronomical spectrograph QHY5LII-M with diffraction grating. The identified emission lines in the spectrum of the meteorite
JAH 815 are listed in the table on the right.

4 Observations and results
Bolide 20151119_034504 (#013 LEO). The 2nd order is
obvious in the recorded spectrum as well as the spectrum
of the persistent trail (Figure 9).

Figure 9 – Combined     spectrum  image          of     bolide
20151119_034504 - spectrograph VM_NW.

Overall 9 video frames of the bolide with 1 st order
spectrum were analyzed (spectrograph VM_NW) and a
time resolved evolution of emission in the range from
3500 to 9000 Å was examined (Figure 10).
                                                                    Figure 10 – Uncalibrated evolution of meteor spectrum in
                                                                    selected frames – 1st order, spectrum of the persistent trail is
                                                                    marked with blue, frame with the strongest emissions is marked
                                                                    with red.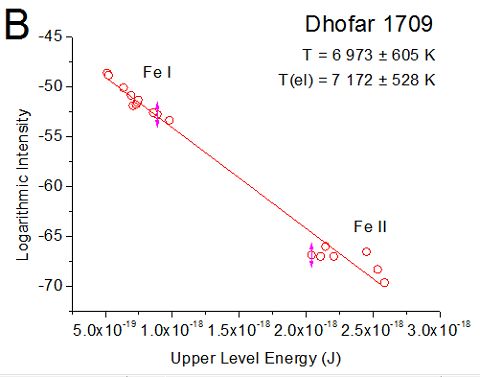
Proceedings of the IMC, Egmond, 2016                                                                                          5

Except of the dominant emissions of MgI-2, NaI-1 and
CaII-1, the FeI-15 (5270, 5328 and 5405 Å) multiplet,
MgI (3, 13 and 14 multiplets), CrI (1), CaI (4), FeI (318),
and SiII (2) in combination with the emission line of the
atmospheric elements (NI, OI, N2 – 1st positive) identified
in the 1st order (Figure 11, 12).

                                                              Figure 13 – Orbit of bolide 20151119_034504 (#013 LEO).

                                                              5 Summary and conclusion
                                                              The Observatory in Valašské Meziříčí has been
                                                              successfully employed in the European Video Meteor
                                                              Network (EDMONd), which consists of 265 CCD
                                                              cameras across Europe. The main goal of this network is
                                                              the determination of meteoroid trajectories. Additionally,
Figure 11 – Calibrated spectrum of bolide 20151119_034504
                                                              we increase the scientific quality of the data by upgrading
(1st order) in the range from 3500 to 9000 Å.
                                                              our EDMOND stations by spectrographs. For instance,
                                                              recently (April 30, 2016), there are 74 spectra in the
                                                              EDMOND database, of which 63 were recorded using
                                                              spectroscopic systems in Valašské Meziříčí and 11 with
                                                              mobile spectrographs (Figure 14, 15).

Figure 12 – Calibrated spectrum of bolide 20151119_034504
(1st order) in the range from 3500 to 7700 Å.

To calculation of the atmospheric path of the bolide and
the orbit of the meteoroid in the Solar system the
recordings from the stations Otrokovice, Zlín and
Valašské Meziříčí (camera N) have been used. The
projection of the beginning of the atmospheric path was
located at coordinates N50.571° E17.603° near the
village of Goszczowice (PL), the height of the bolide at
this time was 126.6 kilometers above the Earth’s surface.     Figure 14 – Position of the parent shower of meteoroids in the
The end of the projection of the atmospheric path was         ternary graph of the Mg I (2), Na I (1), and Fe I (15) multiplet
located at coordinates N50.805° E17.292° near the             relative intensities. Every shower is represented with a different
village of Brylów (PL), the height of the bolide at this      symbol.
time was 74.7 kilometers above the Earth’s surface, the
bolide reached an absolute brightness of -8.6m (Figure
13).
6                                                                                   Proceedings of the IMC, Egmond, 2016

                                                                   Acknowledgment
                                                                   The research has been funded by the Program of regional
                                                                   cooperation of the Czech Academy of Sciences, grant no.
                                                                   R200401521.

                                                                   References
                                                                   Kornoš L., Koukal J., Piffl R. and Tóth J. (2014a).
                                                                         “EDMOND Meteor Database.”. In Gyssens M.
                                                                         and Roggemans P., editors, Proceedings of the
                                                                         International Meteor Conference, Poznañ, Poland,
                                                                         August 22-25, 2013. IMO, pages 23–25.
Figure 15 – Intensity ratio of the Na/Mg lines in meteor spectra   Koukal J., Gorková S., Srba J., Ferus M., Civiš S., Di
as a function of the geocentric velocity.                                Pietro C. A. (2015). “Meteor Spectra in the
                                                                         EDMOND database.” In Rault J.-L. and
Within the frame of the EDMOND database a new                            Roggemans P., editors, Proceedings of the
section of meteor spectra is gradually arising, which                    International Meteor Conference, Mistelbach,
contains the combined observations taken with a mobile                   Austria, Aug. 27-30, 2015. IMO, pages 149–154.
spectrograph in 2013, and observations collected since
2014 with spectrographs in Valašské Meziříčí. In the               Moore Ch. E. (1972). “A Multiplet Table of
database there are also 19 meteor spectra (April 30, 2016)               Astrophysical Interest – Revised Edition”.
from BRAMON, which were recorded using the same                          NSRDS-NBS 40, U.S. Nat. Bur. Stand., reprint of
spectroscopic system as the mobile spectrograph (Watec                   NBS Technical note 36 (PB151395).
902H2 Ultimate, diffraction grating 500 lines/mm).
                                                                   SonotaCo (2009). “A meteor shower catalog based on
                                                                         video observations in 2007-2008”. WGN, Journal
                                                                         of the IMO, 37, 55–62.
You can also read