Supplemental Financial & Operating Data - Q2 2021 - Seeking Alpha
←
→
Page content transcription
If your browser does not render page correctly, please read the page content below

Supplemental Financial & Operating Data
                               Q2 2021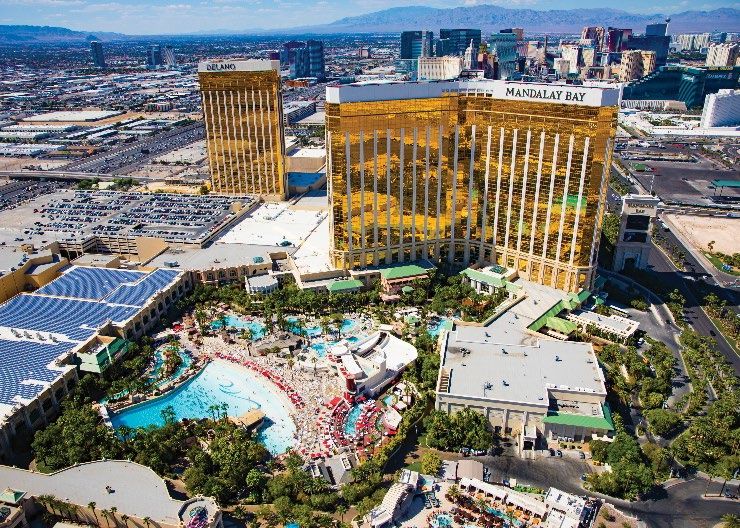
Disclaimers

Forward-Looking Statements

Statements in this presentation that are not historical facts are "forward-looking" statements and "safe harbor statements" within the meaning of the Private
Securities Litigation Reform Act of 1995 that involve risks and/or uncertainties, including those described in the Company's public filings with the Securities and
Exchange Commission (the “SEC”) and any amendments thereto. The Company has based forward-looking statements on management's current expectations
and assumptions and not on historical facts. Examples of these statements include, but are not limited to, the Company’s expectations regarding the closing of
the pending transaction with VICI Properties, Inc. (the “VICI Transaction”) and the Springfield transaction and any benefits expected to be received from such
transactions and the Company’s ability to further grow its dividend and add to its portfolio on an accretive basis. These forward-looking statements involve a
number of risks and uncertainties. Among the important factors that could cause actual results to differ materially from those indicated in such forward-looking
statements include risks related to the Company’s ability to receive, or delays in obtaining, any regulatory approvals required to own its properties, or other
delays or impediments to completing the Company’s planned acquisitions or projects, including any acquisitions of properties from MGM Resorts International
(“MGM” or “MGM Resorts”); the ultimate timing and outcome of any planned acquisitions or projects; the Company’s ability to maintain its status as a REIT; the
availability of and the ability to identify suitable and attractive acquisitions and development opportunities and the ability to acquire and lease those properties on
favorable terms; the Company’s ability to access capital through debt and equity markets in amounts and at rates and costs acceptable to the Company;
changes in the U.S. tax law and other state, federal or local laws, whether or not specific to REITs or to the gaming or lodging industries; and other factors
described in the Company's public filings with the SEC. In providing forward-looking statements, the Company is not undertaking any duty or obligation to
update these statements publicly as a result of new information, future events or otherwise, except as required by law. If the Company updates one or more
forward-looking statements, no inference should be drawn that it will make additional updates with respect to those other forward-looking statements. In
addition, the Company has included certain historical information in this presentation related to the Company and MGM, including historical information related
to the Company’s and MGM’s business, financial condition and results of operations. The delivery of this presentation is not intended to and does not create any
implication that there have been no changes to the Company’s or MGM’s affairs since the date of any of the historical information provided.

Non-GAAP Disclaimer

This presentation includes certain “non-GAAP financial measures” as defined in Regulation G under the Securities Exchange Act of 1934, as amended.
Schedules that reconcile the non-GAAP financial measures to the most directly comparable financial measures calculated and presented in accordance with
Generally Accepted Accounting Principles in the United States are included herein and in MGP’s earnings releases that have been furnished with the SEC and
are available on MGP’s website at http://www.mgmgrowthproperties.com.

Note: Enumerated amounts presented in tables and statements may not always agree with the calculated sum of the related line items due to rounding
differences. The aim is for each line item to agree with its source and therefore there may be rounding differences affecting the total when adding up the
presented line items.

                                                                                                                                                                          2
Table of Contents

Corporate Overview                     4

Quarterly Financial Highlights         5

Consolidated Statements of
                                       6
Operations

Non-GAAP Financial Measures            7

Consolidated Balance Sheets            8

Debt Summary                           9

Capitalization & Financial Ratios   10-11

Transaction Activity                  12

Portfolio Overview                  13-14
Corporate Overview
About MGM Growth Properties Senior Management
MGM Growth Properties LLC (NYSE:MGP) is one of the leading publicly James Stewart, Chief Executive Officer
traded real estate investment trusts engaged in the acquisition, ownership
and leasing of large-scale destination entertainment and leisure resorts, Andy Chien, Chief Financial Officer
whose diverse amenities include casino gaming, hotel, convention, dining,
entertainment and retail offerings. MGP, together with its joint venture,
currently owns a portfolio of properties, consisting of 12 premier destination Corporate Headquarters
resorts in Las Vegas and elsewhere across the United States, MGM 1980 Festival Plaza Dr
Northfield Park in Northfield, OH, Empire Resort Casino in Yonkers, NY, as Suite 750
well as a retail and entertainment district, The Park in Las Vegas. As of Las Vegas, Nevada 89135
December 31, 2020, MGP’s portfolio of destination resorts, the Park, Phone: (702) 669-1480
Empire Resort Casino, and MGM Northfield Park collectively comprised IR Contact: IR@Mgmgrowthproperties.com
approximately 32,400 hotel rooms, 1.6 million casino square footage, and Media: media@mgpreit.com
3.6 million convention square footage. As a growth-oriented public real
estate entity, MGP expects its relationship with MGM Resorts and other
entertainment providers to attractively position MGP for the acquisition of
Transfer Agent
additional properties across the entertainment, hospitality and leisure
industries. For more information about MGP, visit the Company’s website Computershare
at http://www.mgmgrowthproperties.com. (US) 1-877-272-7494
(International) 1-201-680-6578
www.computershare.com/investor
Common Stock Dividend Information as of June 2021
MGP’s Class A Shares are traded on the New York Stock Exchange under Current annualized dividend of $2.06 per share
the symbol “MGP”. Increased dividend 13 out of the 21 dividends paid to date
June 30, 2021 Credit Ratings
S&P / Moody’s / Fitch
Closing price $36.62
MGP Unsecured Rating BB- / B1 / BB+
Shares and units outstanding (1) 268,018,385
MGP Secured Rating BB / Ba3 / BBB-
Total Equity Value $9,814,833,259 MGP Corporate Family Rating B+ / Ba3 / BB+
4
(1) Represents outstanding Class A shares and Operating Partnership units held by MGM, which are convertible into Class A shares on a 1:1 basis
2Q 2021 Financial Highlights
Three Months Ended June 30, 2021
Consolidated Rental Revenue of $188.3 million
Consolidated Net Income of $73.7 million, or $0.281 per diluted OP unit
Consolidated Funds from Operations of $142.0 million, or $0.531 per diluted OP unit
Consolidated Adjusted Funds from Operations of $171.8 million, or $0.651 per diluted OP unit
Annualized Dividend of $2.06 per total OP units & Class A shares outstanding
Cash rent payments received by MGP and Joint Venture:
Master Lease Cash Rent of $211 million
Share of Joint Venture Lease Cash Rent of $37 million2
MGM Growth Properties
1
Quarter Ended 6/30/2021 ($ in millions) Per Diluted Unit
Consolidated Rental Revenue $188.3 --
Consolidated Net Income $73.7 $0.28
Consolidated Funds From Operations $142.0 $0.53
Consolidated Adjusted Funds From Operations $171.8 $0.65
Consolidated Adjusted EBITDA $244.3 --
(1) Diluted weighted average operating partnership units outstanding as of June 30, 2021: 265,919,959 5
(2) Based on MGP’s 50.1% ownership of the Joint Venture that owns the real estate of MGM Grand Las Vegas and Mandalay Bay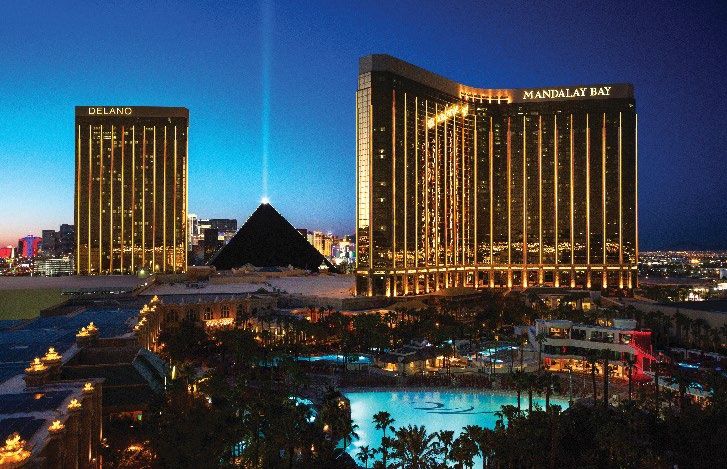
Consolidated Statements of Operations
                                                                             Three Months Ended
($ in millions, except share and per share amounts)                       6/30/2021        3       6/30/2020
Revenues
   Rental revenue                                                     $          188.3         $          188.3
   Ground lease and other                                                          6.0                      6.0
Total Revenues                                                                   194.3                    194.3
Expenses
   Depreciation                                                                  $57.8                    $58.4
   Property transactions, net                                                      0.0                     (0.1)
   Ground lease expense and other                                                  5.9                       5.9
   Acquisition-related expenses                                                    0.3                       0.4
   General and administrative                                                      4.3                       3.7
Total Expenses                                                                    68.3                      68.3
Other income (expense)
   Income from unconsolidated affiliate                                           $25.3                    $25.5
   Interest income                                                                   0.1                      2.3
   Interest expense                                                              (68.7)                   (55.4)
   Gain (loss) on unhedged interest rate sw aps, net                               (6.5)                      1.6
   Other                                                                           (0.7)                    (0.4)
                                                                                 (50.6)                   (26.5)
Income (loss) before income taxes                                                   75.5                     99.5
    Provision for income taxes                                                     (1.8)                    (2.5)
Net Incom e (loss)                                                                  73.7                     97.0
    Less: Net (income) loss attributable to noncontrolling interest              (29.8)                   (56.0)
Net Incom e (loss) attributable to Class A Shareholders                           $43.9                    $41.0
Weighted average Class A shares outstanding:
    Basic                                                                  154,366,954              131,526,763
    Diluted                                                                154,547,202              131,637,018
Earnings per share attributable to Class A shareholders:
    Basic                                                             $           0.28         $           0.30
    Diluted                                                           $           0.28         $           0.30

                                                                                                                    6
Non-GAAP Financial Measures
($ in millions, except share and per share amounts)                                                  Three Months Ended
Reconciliation of Non-GAAP Financial Measures:                                                    6/30/2021         6/30/2020
Net income (loss)                                                                                        $73.7             $97.0
   Depreciation                                                                                           57.8              58.4
   Share of depreciation of unconsolidated affiliate                                                      10.5              10.6
   Property transactions, net                                                                                 0.0           (0.1)
Funds From Operations (FFO)                                                                             $142.0            $165.9
FFO per Diluted Operating Partnership Unit                                                               $0.53             $0.52

   Amortization of financing costs and cash flow hedges                                                       9.6               3.8
   Share of amortization of financing costs of unconsolidated affiliate                                       0.1               0.1
   Non-cash compensation expense                                                                              0.8               0.6
   Straight-line rental revenues, excluding lease incentive asset                                         17.4              13.6
   Share of straight-line rental revenues of unconsolidated affiliate                                    (12.1)            (12.9)
   Amortization of lease incentive asset and deferred revenue on non-normal tenant improvements               4.6               4.6
   Acquisition-related expenses                                                                               0.3               0.4
   Non-cash ground lease rent, net                                                                            0.3               0.3
   Other expenses                                                                                             0.7               0.4
   (Gain) loss on unhedged interest rate sw aps, net                                                          6.5           (1.6)
   Provision for income taxes                                                                                 1.8               2.5
   Share of provision for income taxes on unconsolidated affiliate                                             –            (0.0)
Adjusted Funds From Operations (AFFO)                                                                   $171.8            $177.7
AFFO per Diluted Operating Partnership Unit                                                              $0.65             $0.56

   Interest income                                                                                        (0.1)             (2.3)
   Interest expense                                                                                       68.7              55.4
   Share of interest expense of unconsolidated affiliate                                                  13.6              13.4
   Amortization of financing costs and cash flow hedges                                                   (9.6)             (3.8)
   Share of amortization of financing costs of unconsolidated affiliate                                   (0.1)             (0.1)
Adjusted EBITDA                                                                                         $244.3            $240.3
                                                                                                                                      7
Consolidated Balance Sheets
($ in millions)                                                                                     6/30/2021       12/31/2020
                                                             ASSETS
   Real estate investments, net                                                                 $      8,194    $       8,311
   Lease incentive asset                                                                                 497              507
   Investment in unconsolidated affiliate                                                                814              810
   Cash and cash equivalents                                                                             298              626
   Prepaid expenses and other assets                                                                      24               26
   Above market lease, asset                                                                              39               40
   Operating lease right-of-use assets                                                                   281              281
Total assets                                                                                         $10,147          $10,600
                                            LIABILITIES AND SHAREHOLDERS' EQUITY
Liabilities
   Debt, net                                                                                    $      4,163    $       4,169
   Due to MGM Resorts International and affiliates                                                         0                0
   Accounts payable, accrued expenses and other liabilities                                               76              124
   Accrued interest                                                                                       63               49
   Dividend and distribution payable                                                                     138              136
   Deferred revenue                                                                                      187              157
   Deferred income taxes, net                                                                             33               33
   Operating lease liabilities                                                                           342              341
Total liabilities                                                                                      5,001            5,010
Commitments and contingencies
Shareholders' equity
   Class A shares: no par value, 1,000,000,000 shares authorized, 156,645,628 and 131,459,651
                                                                                                           –                –
   shares issued and outstanding as of June 30, 2021 and December 31, 2020, respectively
   Additional paid-in capital                                                                           3,555            3,114
   Accumulated deficit                                                                                  (476)            (423)
   Accumulated other comprehensive loss                                                                  (52)             (51)
   Total Class A shareholders' equity                                                                   3,026            2,640
   Noncontrolling interest                                                                              2,120            2,951
Total shareholders' equity                                                                              5,146            5,591
Total liabilities and shareholders' equity                                                      $     10,147    $      10,600
                                                                                                                                 8
Consolidated Debt Summary
                                                                                                                                                            Interest Rate as Weighted Avg. Yrs
      ($ in millions)                                                                                     Maturity Date                Balance                of 6/30/2021     until Maturity
      Senior Secured Credit Facility
                                          (1)
           Revolving Credit Facility                                                                         6/14/2023                                  –                 N/A           2.0 Years
      Senior Unsecured Notes
           5.625% Notes Due 2024                                                                              5/1/2024                            1,050                 5.625%          2.8 Years
           4.625% Notes Due 2025                                                                             6/15/2025                              800                 4.625%          4.0 Years
           4.500% Notes Due 2026                                                                              9/1/2026                              500                 4.500%          5.2 Years
           5.750% Notes Due 2027                                                                              2/1/2027                              750                 5.750%          5.6 Years
           4.500% Notes Due 2028                                                                             1/15/2028                              350                 4.500%          6.5 Years
           3.875% Notes Due 2029                                                                             2/15/2029                              750                 3.875%          7.6 Years
      Principal Amount                                                                                                                          $4,200                                  5.0 Years
      Unamortized discount and debt issuance costs                                                                                                  (37)
      Carrying Value                                                                                                                            $4,163
                                                                                   Maturity Schedule ($ in millions)

                                                               $1,350
                                                                                   $1,050
                                                                                                       $800                                   $750                               $750
                                                                                                                           $500
                                                                                                                                                                 $350
                                                                   $1
                          2021                  2022             2023               2024               2025                2026               2027               2028            2029
                                                            Bonds             Drawn Credit Facility                     Undrawn Credit Facility

                                                                                                                                                                                                    9
(1)   The company has effective LIBOR interest rate swap agreements where it pays a weighted average fixed rate of 1.783% on a total notional amount of $700 million.
Capitalization & Financial Ratios

  ($ in millions)
  Debt                                                                                       Principal Balance     Pro Rata Capitalization Mix as of 6/30/2021
      Credit Facility                                                                                          –
      Senior Unsecured Notes                                                                             4,200

      MGP Pro Rata Share of Joint Venture Debt 1                                                         1,503

  Pro Rata Total Debt                                                                                   $5,703

  Equity                                             Shares / Units Share Price                 Market Value
      Class A Shares (NYSE: MGP)                                156.6             $36.62                $5,736
                                                                                                                    Equity Value         Fixed Rate Debt
      MGM OP Units                                              111.4             $36.62                 4,078
                                                                                                                       63.2%                  36.8%
  Total Equity                                                                                          $9,815

  Total Capitalization                                                                                 $15,518

  Pro Rata Debt / Total Capitalization                                                                  36.8%

  Consolidated Liquidity as of June 30, 2021
      Cash and Cash Equivalents                                                                          $298
      Total Revolver Capacity                                                                            1,350
      Drawn Amounts on Revolver                                                                                –
  Total Liquidity                                                                                       $1,648

                                                                                                                                                                 10
(1)   MGP’s 50.1% Pro Rata Share of the MGM Grand Las Vegas / Mandalay Bay Joint Venture $3.0B debt
Pro Rata Net Debt / Adjusted EBITDA Reconciliation
MGP 50.1% Share of
Quarter Ended June 30, 2021 Wholly Owned Joint Venture Pro Rata
Reconciliation of Non-GAAP Financial Measures:
Net income $48 $25 $74
Real estate depreciation 58 – 58
Share of depreciation of unconsolidated affiliate – 10 10
Property transactions, net 0 – 0
Non-cash compensation expense 1 – 1
Straight-line rental revenues, excluding lease incentive asset 17 – 17
Share of straight-line rental revenues of unconsolidated affiliate – (12) (12)
Amortization of lease incentive asset and deferred revenue on non-
5 – 5
normal tenant improvements
Non-cash ground lease rent, net 0 – 0
Other expenses 1 – 1
Loss on unhedged interest rate swaps, net 6 – 6
Provision for income taxes 2 – 2
Interest income (0) – (0)
Interest expense 69 – 69
Share of interest expense of unconsolidated affiliate – 14 14
Adjusted EBITDA $207 $37 $244
x4 x4 x4
Annualized Adjusted EBITDA $829 $149 $977
Pro Rata Net Leverage:
Total principal amount of debt $4,200 – 4,200
Less: Cash and cash equivalents (298) – (298)
Plus: 50.1% of joint venture net debt – 1,503 1,503
Pro Rata Net Debt $3,902 $1,503 5,405
Pro Rata Net Leverage 4.71x 65% LTV 5.53x
11Transaction Activity
Net Investment Activity
Net
1
Property Location Close Date Consideration EV / EBITDA Cap Rate % Total Rent
MGM Springfield2 Springfield, MA Pending $400 13.3x 7.5% $30
MGM Grand Las Vegas / Mandalay Bay Joint Venture3 Las Vegas, NV 2/14/2020 2,304 15.8x 6.3% 146
Park MGM4 Las Vegas, NV 3/7/2019 638 12.8x 7.8% 50
Empire City Casino Yonkers, NY 1/29/2019 625 12.5x 8.0% 50
MGM Northfield Park 5 Northfield, OH 7/6/2018 697 11.6x 8.6% 60
National Harbor Prince George’s County, MD 10/5/2017 1,188 12.5x 8.0% 95
Borgata Atlantic City, NJ 8/1/2016 1,175 11.8x 8.5% 100
Annual Acquisition Volumes
MGM Assets Acquired: $4.5bn
3rd Party Assets Acquired: $2.6bn $2,304
$1,188 $1,263
$1,175
$1,063
OpCo Sale
$400
2016 2017 2018 2019 2020 2021
(1) “Enterprise Value / EBITDA” defined as net consideration over the initial annual rent of the property
(2) Subject to closing conditions and regulatory approvals
(3) MGM Grand Las Vegas / Mandalay Bay Joint Venture transaction figures are shown at MGP’s 50.1% pro rata share of the joint venture
(4) MGP paid consideration of $637.5 million for investments made to reposition Park MGM and NoMad Las Vegas, which was formerly known as Monte Carlo Resort and Casino 12
(5) “Net Consideration” defined as Real estate purchase price net of OpCo sale and interim adjusted funds from operations collected during TRS ownershipPortfolio Map
1
3
New York, NY
Detroit, MI
Cleveland, OH Springfield, MA
Atlantic City, NJ
Las Vegas Washington D.C.
Tunica, MS
Biloxi, MS
1
Las Vegas Assets Regional Assets ROFO Asset2
(1) MGP owns a 50.1% interest in MGM Grand Las Vegas and Mandalay Bay Park MGM
(2) MGP has a right of first offer on future Empire City gaming facility developments 13
(3) Subject to closing conditions and regulatory approvalsProperty Stats (1)
Hotel Casino Convention Slot Table
Property Location Rooms Acres Sq. Ft. Sq. Ft. Machines Games
Las Vegas Strip
MGM Grand Las Vegas 2 Las Vegas, NV 4,993 102 169,000 850,000 1,270 98
Mandalay Bay 2 Las Vegas, NV 4,750 124 152,000 2,121,000 1,117 60
The Mirage Las Vegas, NV 3,044 77 94,000 170,000 819 69
New York - New York and The Park Las Vegas, NV 2,024 23 81,000 31,000 992 51
Luxor Las Vegas, NV 4,397 58 101,000 35,000 859 48
Park MGM Las Vegas, NV 2,898 21 66,000 77,000 766 58
Excalibur Las Vegas, NV 3,981 51 94,000 25,000 927 41
Subtotal 26,087 456 757,000 3,309,000 6,750 425
Regional
MGM Grand Detroit Detroit, MI 400 24 151,000 30,000 3,079 127
Beau Rivage Biloxi, MS 1,740 26 87,000 50,000 1,681 75
Gold Strike Tunica Tunica, MS 1,133 24 48,000 17,000 948 66
Borgata Atlantic City, NJ 2,767 37 160,000 106,000 2,856 189
MGM National Harbor Prince George’s County, MD 308 23 146,000 50,000 2,603 171
MGM Northfield Park Northfield, OH — 113 92,000 — 1,869 —
Empire City Yonkers, NY — 41 137,000 — 4,693 —
Subtotal 6,348 288 821,000 253,000 17,729 628
Total 32,435 744 1,578,000 3,562,000 24,479 1,053
Note: Does not give effect to announced MGM Springfield acquisition
(1) As of 12/31/2020. The information above reflects amenities prior to the temporary closure of the properties and subsequent re-opening of the properties without certain amenities as a result of the COVID-
19 pandemic and without giving effect to any COVID-19 mitigation procedures implemented at the properties. In addition, as a result of the enactment of certain health and safety measures in order to
mitigate the effects of COVID-19, including measures to promote social distancing, table games (and seats available at table games), and slot machines available for play are currently limited. 14
(2) MGP owns a 50.1% interest in MGM Grand Las Vegas and Mandalay Bay.You can also read