Illumina Investor Presentation - May 3, 2018
←
→
Page content transcription
If your browser does not render page correctly, please read the page content below

Illumina Investor
Presentation
May 3, 2018

© 2017 Illumina, Inc. All rights reserved.

Safe Harbor Statement
    This communication may contain forward-looking statements that involve risks and
    uncertainties, including our financial outlook and guidance for fiscal 2018 and
    expectations regarding the development and commercialization of new products. Among
    the important factors that could cause actual results to differ materially from those in any
    forward-looking statements are (i) challenges inherent in developing, manufacturing, and
    launching new products and services, including expanding manufacturing operations and
    reliance on third-party suppliers for critical components; (ii) the timing and mix of
    customer orders among our products and services; (iii) the impact of recently launched or
    pre-announced products and services on existing products and services; (iv) our ability to
    further develop and commercialize our instruments and consumables and to deploy new
    products, services, and applications, and expand the markets for our technology
    platforms; (v) our ability to manufacture robust instrumentation and consumables; (vi) the
    success of products and services competitive with our own; (vii) our ability to successfully
    identify and integrate acquired technologies, products, or businesses; (viii) our
    expectations and beliefs regarding future conduct and growth of the business and the
    markets in which we operate; and (ix) the application of generally accepted accounting
    principles, which are highly complex and involve many subjective assumptions, estimates,
    and judgments, together with other factors detailed in our filings with the Securities and
    Exchange Commission, including our most recent filings on Forms 10-K and 10-Q, or in
    information disclosed in public conference calls, the date and time of which are released
    beforehand. We undertake no obligation, and do not intend, to update these forward -
    looking statements, to review or confirm analysts’ expectations, or to provide interim
    reports or updates on the progress of the current quarter.
2
Our Mission

    To improve human health by unlocking the power of the genome

3
Our Technology
    Integrated workflows from sample-to-answer

                     SEAMLESS WORKFLOW SOLUTIONS ENABLE MARKETS

                                              Flexible,
                Simplified      Custom                     Integrated
                                             economical
               library prep     content                      analysis
                                             sequencing

4
Sequencing Power for Every Scale
    The broadest portfolio offering available

    Sequencing                      ™                     ™                   ®                     ®                   ®                    ®                ®
                             iSeq               MiniSeq               MiSeq              NextSeq               HiSeq                  HiSeq X       NovaSeq
    System

                                                                                                                 4000                   Five/Ten       6000

    Output per run           1.2 Gb              7.5 Gb               15 Gb               120 Gb                1.5 Tb                  1.8 Tb     1 Tb - 6 Tb 1

    Instrument
                             $19.9K              $49.5K                $99K                $275K               $900K                  $6M2/$10M2      $985K
    price

    Installed base3            NA                 ~600                ~6,000               ~2,400                           ~2,3004                   ~285

             1.   Output per run for the S1, S2 and S4 flow cells equal 1 Tb, 2 Tb and 6 Tb, respectively assuming two flow cells per run
             2.   Based on purchase of 5 and 10 units for HiSeq X Five and HiSeq X Ten, respectively
5            3.   Based on end of fiscal year 2017
             4.   Combined HiSeq family
Product & Customer Diversity
    Robust recurring revenue with balanced customer base1

            Revenue by Product/Service                Revenue By Geography

                                                                Asia
                                                               Pacific
                      Consumables                      Greater   8%
                          64%                           China
                                                         11%

                                                      Europe             Americas
                                                       23%                 58%
                                         Instrument
                                            19%
                         Service /
                          other
                           17%

6      1.    Based on fiscal year 2017
First Quarter Results1
    Revenue and Non-GAAP EPS exceeded expectations

              Revenue                          Non-GAAP EPS2                             Non-GAAP                           Non-GAAP
            ($ in millions)                                                             gross margin                     operating margin
                                                                   $1.45
                          $782                                                                                                            29.5%
                                                                                                       69.8%
       $598
                                                $0.64                                  66.4%
                                                                                                                           17.5%

                   31%                                     127%                                  340
                                                         Increase                                                                  1200
                 Increase                                                                        bps                                bps

       Q1’17             Q1’18                  Q1’17              Q1’18               Q1’17           Q1’18              Q1’17           Q1’18

7      1.    Financials include $48 million and $50 million of stock-based compensation expense in Q1’18 and Q1’17, respectively
       2.    Non-GAAP attributable to Illumina stockholders
Balance Sheet1 / Cash Flow2
    Strong cash position

                 Cash Flow from                             Free Cash Flow                                Cash and Short-
                   Operations                                ($ in millions)                             term Investments
                  ($ in millions)                                                                           ($ in millions)
                                   $255                                       $165                                    $2,373

                 $168                                                                                   $1,778
                                                              $85

                            52%                                       94%                                            33%
                          Increase                                  Increase                                       Increase

                                                                                                          As of           As of
                 Q1’17             Q1’18                    Q1’17            Q1’18                        4/2/17          4/1/18

8       1.   Balance sheet includes the consolidated amounts from Helix
        2.   Cash flow includes the consolidated amounts from GRAIL and Helix in Q1‘17 and only Helix in Q1’18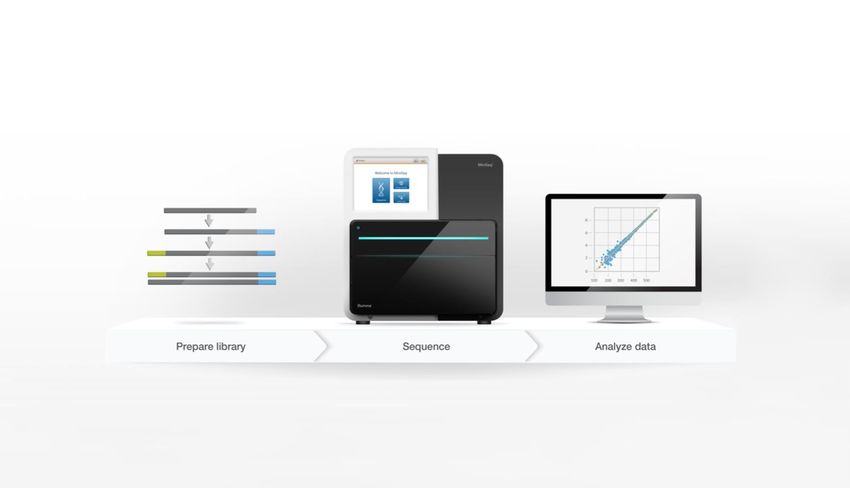
Historic Revenue and Non-GAAP EPS
    Innovation drives profitable growth

                                  Revenue CAGR: 19%                                                 EPS CAGR1: 20%

                                                                                                                             Non-GAAP EPS1
     Revenue ($millions)

                           $3,000                                                                                    $4.00

                                                                                                                     $3.50
                           $2,500
                                                                                                                     $3.00
                           $2,000
                                                                                                                     $2.50

                           $1,500                                                                                    $2.00

                                                                                                                     $1.50
                           $1,000
                                                                                                                     $1.00
                                $500
                                                                                                                     $0.50

                                  $0                                                                                 $0.00
                                            2012                2013                  2014   2015     2016   2017

9
                           1.    Non-GAAP EPS attributable to Illumina stockholders
2018 Guidance
     Double-digit revenue growth in 2018

                                                                        20181

                                                                        Revenue1
                                                                       15% - 16%

                                                                      GAAP EPS2
                                                                     $4.45 - $4.55

                                                                 Non-GAAP EPS2
                                                                     $4.75 - $4.85

10       1.   Guidance given via 8-k and press release on April 24, 2018; assumes constant currency rates from April 24, 2018
         2.   Attributable to Illumina stockholders
Who We Serve
Innovation drives expanding market opportunities
Reproductive Health Oncology Population Sequencing
Research Complex Disease Consumer Infectious Disease
Forensics Agriculture Genetic Health BioPharm
11Appendix Non-GAAP Reconciliations 12
Itemized Reconciliation Between GAAP and Non-GAAP
Earnings Per Share Attributable to Illumina Stockholders:
                                                                                                       Years Ended
 Dollars in millions, except per share amounts                   December 31,     January 1,     January 3,   December 28, December 29, December 30,
                                                                     2017           2017           2016           2014         2013         2012
 GAAP earnings per share attributable to Illumina                 $       4.92   $       3.07   $       3.10   $       2.37 $       0.90 $       1.13
 stockholders - diluted
 Pro forma impact of weighted average shares (a)                           —               —             —              —              0.01             0.02
 Adjustments to net income:
    Amortization of acquired intangible assets                            0.30           0.33           0.35           0.32             0.32             0.12
    Non-cash interest expense (b)                                         0.20           0.20           0.26           0.26             0.26             0.27
    Legal contingencies (c)                                                 —          (0.06)           0.13         (0.24)             0.96             0.02
    Contingent compensation expense (d)                                     —            0.01             —            0.03             0.10             0.07
    Headquarter relocation (e)                                              —            0.01         (0.02)           0.04             0.02             0.20
    Deemed dividend (f)                                                     —          (0.01)             —              —                —                —
    Cost/equity method investment gain, net                             (0.01)             —          (0.10)         (0.03)           (0.44)           (0.35)
    Acquisition related (gain) expense, net (g)                         (0.01)             —          (0.04)         (0.02)           (0.08)             0.02
    Loss on extinguishment of debt                                          —              —            0.03           0.21               —                —
    Impairments (h)                                                       0.15             —              —              —              0.18             0.16
    Unsolicited tender offer related expense                                —              —              —              —              0.10             0.17
    Inventory revaluation adjustment (i)                                    —              —              —              —                —              0.01
    Recovery of previously impaired note receivable                         —              —              —              —                —            (0.05)
    Restructuring                                                         0.03             —              —              —                —              0.03
    Gain on deconsolidation of GRAIL (j)                                (3.07)             —              —              —                —                —
    Performance-based compensation related to GRAIL series                0.03             —             —              —                —                —
    B financing (k)
     Incremental non-GAAP tax expense (l)                                 0.80         (0.17)         (0.22)         (0.20)           (0.53)           (0.23)
     Tax benefit related to cost-sharing arrangement (m)                    —          (0.05)         (0.17)             —                —                —
     U.S. Tax Reform (n)                                                  1.01
     Excess tax benefit from share-based compensation (o)               (0.35)             —             —              —                —                —
     )
 Non-GAAP    earnings per share attributable to Illumina          $       4.00   $       3.33   $      3.32    $      2.74    $        1.80    $        1.59
 stockholders– diluted (p)
 Shares used in calculating non-GAAP diluted earnings per                 148            148            149            149              139              133
 share attributable to Illumina stockholders

 ITEMIZED RECONCILIATION BETWEEN GAAP AND NON-GAAP NET INCOME ATTRIBUTABLE TO ILLUMINA STOCKHOLDERS:
 GAAP net income attributable to Illumina stockholders $ 726     $ 463       $ 462         $ 353                                  $     125        $    151
     Amortization of acquired intangible assets                             45            49              52            48                45              16
     Non-cash interest expense (b)                                          30            30              39            38                36              35
     Legal contingencies (c)                                                —             (9)             19          (36)              134                3
     Contingent compensation expense (d)                                    —               2              1             4                14               9
     Headquarter relocation (e)                                             —               1            (3)             6                 3              26
     Cost/equity method investment gain, net                               (2)             —            (16)           (4)              (61)            (46)
     Acquisition related (gain) expense, net (g)                           (1)             —             (6)           (3)              (12)               3
     Loss on extinguishment of debt                                         —              —               4            31                 1              —
     Impairments (h)                                                        23             —              —             —                 25              21
     Unsolicited tender offer related expense                               —              —              —             —                 14              23
     Inventory revaluation adjustment (i)                                   —              —              —             —                 —                1
     Recovery of previously impaired note receivable                        —              —              —             —                 —              (6)
     Restructuring                                                           4             —              —             —                 —                4
     Gain on deconsolidation of GRAIL (j)                                (453)             —              —             —                 —               —
     Performance-based compensation related to GRAIL series
                                                                            4              —             —              —                —                —
     B financing (k)
    Incremental non-GAAP tax expense (l)                                 117            (26)           (32)          (30)           (74)             (30)
    Tax benefit related to cost-sharing arrangement (m)                    —             (7)           (25)            —              —                —
    U.S. Tax Reform (n)                                                  150              —              —             —              —                —
    Excess tax benefit from share-based compensation (o)                 (52)             —              —             —              —                —
 Non-GAAP net income attributable to Illumina stockholders (p)         $ 591          $ 503          $ 495         $ 407          $ 250            $ 210

 ITEMIZED RECONCILIATION BETWEEN GAAP AND NON-GAAP DILUTED NUMBER OF SHARES ATTRIBUTABLE TO ILLUMINA
 STOCKHOLDERS:
 Weighted average shares used in calculation of GAAP diluted   148  148         149          149                                        140             134
 net income per share
 Weighted average dilutive potential common shares issuable of  —    —           —            —                                          (1)             (1)
 redeemable convertible senior notes (a)
 Weighted average shares used in calculation of non-GAAP                  148            148            149            149              139             133
 diluted earnings per share attributable to Illumina
 stockholders

13
Footnotes to the Itemized Reconciliation Between GAAP and Non-GAAP Measures: All amounts in tables are rounded to the nearest millions, except as otherwise noted. As a result, certain amounts may not recalculate using the rounded amounts provided. (a) Pro forma impact of weighted-average shares includes the impact of double dilution associated with the accounting treatment of the company’s outstanding convertible debt and the corresponding call option overlay. (b) Non-cash interest expense is calculated in accordance with the authoritative accounting guidance for convertible debt instruments that may be settled in cash. (c) Legal contingencies primarily represent charges and settlements related to patent litigation. (d) Contingent compensation expense relates to contingent payments for post-combination services associated with acquisitions. (e) The company relocated its headquarters to a new facility in San Diego, California, in 2011. Headquarter relocation for fiscal 2016, 2015, 2014, and 2013 consisted of accretion of interest expense on lease exit liability and changes in related costs. Headquarter relocation for fiscal 2012 and fiscal 2011 consisted of cease-use loss, double rent expense during the transition to the new facility, accretion of interest expense on lease exit liability, and moving costs. (f) Amount represents the impact of a deemed dividend, net of Illumina’s portion of the losses incurred by GRAIL’s common shareholders resulting from the company’s common to preferred share exchange with GRAIL. The amount was added to net income attributable to Illumina stockholders for purposes of calculating Illumina’s consolidated earnings per share. The deemed dividend, net of tax, was recorded through equity. (g) Acquisition related (gain) expense, net consists primarily of net gains and expense from changes in fair value of contingent consideration and transaction related costs. (h) Impairments in fiscal 2017 represents impairment of an acquired intangible asset and in-process research and development of $18 million and $5 million, respectively. Impairments in fiscal 2014 consisted of a gain on an asset sale associated with a non-core product line discontinued in 2013, partially offset by an intangible asset impairment. Impairments in fiscal 2013 represent asset impairment charges recorded upon the decision to discontinue the non-core product line. Impairments in fiscal 2012 related to an in-process research and development intangible asset. (i) Inventory revaluation adjustments represent additional cost of goods sold recognized from inventories revalued upon acquisitions of Verinata Health, Inc. in 2013 and BlueGnome Ltd in 2012. (j) Amount represents the gain recognized as a result of the deconsolidation of GRAIL in Q1 2017. The $150 million tax effect of the gain is included in incremental non-GAAP tax expense. Subsequent to the transaction, our remaining interest is treated as a cost-method investment. (k) Amount represents performance-based stock which vested as a result of the financing, net of attribution to noncontrolling interest. (l) Incremental non-GAAP tax expense reflects the tax impact related to the non-GAAP adjustments listed above. (m) Tax benefit related to cost-sharing arrangement refers to the exclusion of stock compensation from prior period cost- sharing charges as a result of a tax court ruling. (n) In accordance with the Tax Cuts and Jobs Act enacted on December 22, 2017 (U.S. Tax Reform), amount primarily consists of a provisional estimate of the one-time transition tax on earnings of certain foreign subsidiaries that were previously tax deferred. (o) Excess tax benefits from share-based compensation are recorded as a discrete item within the provision for income taxes on the consolidated statement of income pursuant to ASU 2016-09, which was previously recognized in additional paid-in capital on the consolidated statement of stockholders’ equity. (p) Non-GAAP net income attributable to Illumina stockholders and diluted earnings per share attributable to Illumina stockholders exclude the effect of the pro forma adjustments as detailed above. Non-GAAP net income attributable to Illumina stockholders and diluted earnings per share attributable to Illumina stockholders are key components of the financial metrics utilized by the company’s board of directors to measure, in part, management’s performance and determine significant elements of management’s compensation. Management has excluded the effects of these items in these measures to assist investors in analyzing and assessing our past and future core operating performance. 14
Reconciliation Between GAAP and Non-GAAP Earnings Per
Share and Net Income Attributable to Illumina Stockholders:

                                                                                               Three Months Ended
                                                                                              April 1,       April 2,
                                                                                               2018           2017
     GAAP earnings per share attributable to Illumina stockholders - diluted              $        1.41 $           2.48
       Amortization of acquired intangible assets                                                  0.06             0.09
       Non-cash interest expense (a)                                                               0.05             0.05
       Strategic investment related gains (b)                                                     (0.05)           (0.01)
       Restructuring (c)                                                                           0.02               —
       Gain on deconsolidation of GRAIL (d)                                                          —             (3.07)
       Impairments (e)                                                                               —              0.15
       Legal contingencies (f)                                                                       —              0.05
        Performance-based compensation related to GRAIL Series B financing (g)                       —              0.03
        Acquisition related gain (h)                                                                 —             (0.01)
        Incremental non-GAAP tax expense (i)                                                      (0.02)            0.93
        Excess tax benefit from share-based compensation (j)                                      (0.02)           (0.05)
     Non-GAAP earnings per share attributable to Illumina stockholders - diluted (k)      $        1.45    $        0.64

     ITEMIZED RECONCILIATION BETWEEN GAAP AND NON-GAAP NET INCOME ATTRIBUTABLE TO ILLUMINA
     STOCKHOLDERS:
     GAAP net income attributable to Illumina stockholders             $       208 $        367
        Amortization of acquired intangible assets                               9           13
        Non-cash interest expense (a)                                            8            7
        Strategic investment related gains (b)                                  (8)          (2)
        Restructuring (c)                                                        3           —
        Gain on deconsolidation of GRAIL (d)                                    —          (453)
        Impairments (e)                                                         —            23
        Legal contingencies (f)                                                 —             8
       Performance-based compensation related to GRAIL Series B financing (g)                        —                4
       Acquisition related gain (h)                                                                  —               (1)
       Incremental non-GAAP tax expense (i)                                                          (3)            136
       Excess tax benefit from share-based compensation (j)                                          (3)             (8)
     Non-GAAP net income attributable to Illumina stockholders (k)                        $         214 $            94
     __________________________________________________________
     All amounts in tables are rounded to the nearest millions, except as otherwise noted. As a result, certain amounts
     may not recalculate using the rounded amounts provided.

15
Footnotes to the Reconciliation Between GAAP and Non-
GAAP Measures:
(a) Non-cash interest expense is calculated in accordance with the authoritative accounting guidance for
convertible debt instruments that may be settled in cash.
(b) Amount consists primarily of mark-to-market adjustments from our strategic investments.
(c) Amount consists primarily of employee costs related to restructuring that occurred in Q1 2018 and Q4 2017.
(d) Amount represents the gain recognized as a result of the deconsolidation of GRAIL in Q1 2017. The $150 million
tax effect of the gain is included in incremental non-GAAP tax expense.
(e) Amount for 2017 represents impairment of an acquired intangible asset and in-process research and
development of $18 million and $5 million, respectively.
(f) Legal contingencies for 2017 represent charges related to patent litigation.
(g) Amount represents performance-based stock which vested as a result of the financing in Q1 2017, net of
attribution to noncontrolling interest.
(h) Acquisition related gain consists of change in fair value of contingent consideration.
(i) Incremental non-GAAP tax expense reflects the tax impact related to the non-GAAP adjustments listed above.
(j) Amount represents tax deductions taken in excess of stock compensation cost.
(k) Non-GAAP net income attributable to Illumina stockholders and diluted earnings per share attributable to
Illumina stockholders exclude the effect of the pro forma adjustments as detailed above. Non-GAAP net income
attributable to Illumina stockholders and diluted earnings per share attributable to Illumina stockholders are key
components of the financial metrics utilized by the company’s board of directors to measure, in part,
management’s performance and determine significant elements of management’s compensation. Management
has excluded the effects of these items in these measures to assist investors in analyzing and assessing our past and
future core operating performance.
16Reconciliation Between GAAP and Non-GAAP Results of
Operations as a Percent of Revenue:
Three Months Ended
April 1, April 2,
2018 2017
GAAP gross profit $ 538 68.8 % $ 368 61.5 %
Amortization of acquired intangible assets 8 1.0 % 11 1.9 %
Impairment (a) — — 18 3.0 %
Non-GAAP gross profit (b) $ 546 69.8 % $ 397 66.4 %
GAAP research and development expense $ 137 17.5 % $ 145 24.2 %
Impairment (a) — — (5) (0.9 )%
Non-GAAP research and development expense $ 137 17.5 % $ 140 23.3 %
GAAP selling, general and administrative expense $ 183 23.5 % $ 171 28.6 %
Restructuring (c) (3) (0.5 )% — —
Amortization of acquired intangible assets (1) (0.1 )% (2) (0.2 )%
Performance-based compensation related to GRAIL Series B financing (d) — — (10) (1.7 )%
Legal contingencies (e) — — (8) (1.3 )%
Acquisition related gain (f) — — 1 0.2 %
Non-GAAP selling, general and administrative expense $ 179 22.9 % $ 152 25.6 %
GAAP operating profit $ 218 27.8 % $ 52 8.7 %
Amortization of acquired intangible assets 9 1.2 % 13 2.1 %
Restructuring (c) 3 0.5 % — —
Impairments (a) — — 23 3.9 %
Performance-based compensation related to GRAIL Series B financing (d) — — 10 1.7 %
Legal contingencies (e) — — 8 1.3 %
Acquisition related gain (f) — — (1) (0.2 )%
Non-GAAP operating profit (b) $ 230 29.5 % $ 105 17.5 %
GAAP other income, net $ 3 0.4 % $ 451 75.4 %
Non-cash interest expense (g) 8 1.0 % 7 1.2 %
Strategic investment related gains (h) (8) (1.0 )% (2) (0.2 )%
Gain on deconsolidation of GRAIL (i) — — (453) (75.9 )%
Non-GAAP other income, net (b) $ 3 0.4 % $ 3 0.5 %
__________________________________________________________
All amounts in tables are rounded to the nearest millions, except as otherwise noted. As a result, certain amounts
may not recalculate using the rounded amounts provided.
17Footnotes to the Reconciliation Between GAAP and Non-
GAAP Results of Operations:
(a) Impairments for 2017 include $18 million impairment of an acquired intangible asset and $5 million
in-process research and development.
(b) Non-GAAP gross profit, included within non-GAAP operating profit, is a key measure of the
effectiveness and efficiency of manufacturing processes, product mix and the average selling prices of
our products and services. Non-GAAP operating profit, and non-GAAP other income, net, exclude the
effects of the pro forma adjustments as detailed above. Management has excluded the effects of these
items in these measures to assist investors in analyzing and assessing past and future operating
performance.
(c) Amount consists primarily of employee costs related to restructuring that occurred in Q1 2018 and
Q4 2017.
(d) Amount represents performance-based stock which vested as a result of the financing in Q1 2017.
(e) Legal contingencies for 2017 represent charges related to patent litigation.
(f) Acquisition related gain consists of change in fair value of contingent consideration.
(g) Non-cash interest expense is calculated in accordance with the authoritative accounting guidance
for convertible debt instruments that may be settled in cash.
(h) Amount consists primarily of mark-to-market adjustments from our strategic investments.
(i) Amount represents the gain recognized as a result of the deconsolidation of GRAIL in Q1 2017.
18Reconciliation of Non-GAAP Financial Guidance
Our future performance and financial results are subject to risks and uncertainties, and actual results could differ
materially from the guidance set forth below. Some of the factors that could affect our financial results are
stated above in this press release. More information on potential factors that could affect our financial results is
included from time to time in the public reports filed with the Securities and Exchange Commission, including
Form 10-K for the fiscal year ended December 31, 2017 filed with the SEC on February 12, 2018. We assume no
obligation to update any forward-looking statements or information.
Fiscal Year
2018
GAAP diluted earnings per share attributable to Illumina stockholders $4.45 - $4.55
Amortization of acquired intangible assets 0.24
Non-cash interest expense (a) 0.21
Strategic investment related gains (b) (0.05)
Restructuring (c) 0.03
Incremental non-GAAP tax expense (d) (0.11)
Excess tax benefits from share-based compensation (e) (0.02)
Non-GAAP diluted earnings per share attributable to Illumina stockholders $4.75 - $4.85
(a) Non-cash interest expense is calculated in accordance with the authoritative accounting guidance for
convertible debt instruments that may be settled in cash.
(b) Amount consists primarily of mark-to-market adjustments from our strategic investments.
(c) Amount consists primarily of employee severance and retention costs related to the restructuring that
occurred in Q1 2018 and Q4 2017.
(d) Incremental non-GAAP tax expense reflects the tax impact related to the non-GAAP adjustments listed
above.
(e) Amount represents tax deductions taken in excess of stock compensation cost.
19You can also read