Third Quarter 2016 Earnings Call - November 10, 2016 - Constellium
←
→
Page content transcription
If your browser does not render page correctly, please read the page content below
Third Quarter 2016
Earnings Call
November 10, 2016
Forward-looking statements
Certain statements contained in this presentation may constitute forward-looking statements within the meaning of the Private Securities Litigation

Reform Act of 1995. This presentation may contain “forward looking statements” with respect to our business, results of operations and financial

condition, and our expectations or beliefs concerning future events and conditions. You can identify forward-looking statements because they contain

words such as, but not limited to, “believes,” “expects,” “may,” “should,” “approximately,” “anticipates,” “estimates,” “intends,” “plans,” “targets,”

likely,” “will,” “would,” “could” and similar expressions (or the negative of these terminologies or expressions). All forward-looking statements involve

risks and uncertainties. Many risks and uncertainties are inherent in our industry and markets. Others are more specific to our business and

operations. These risks and uncertainties include, but are not limited to, the ability of Constellium and Wise Metals to achieve expected synergies

and the timing thereof, Constellium’s increased levels of indebtedness which could limit Constellium’s operating flexibility and opportunities; the

potential failure to retain key employees, the loss of customers, suppliers and other business relationships as a result of the acquisition of Wise

Metals; disruptions to business operations; slower or lower than expected growth in the North American market for Body-in-White aluminium rolled

products, and other risk factors set forth under the heading “Risk Factors” in our Annual Report on Form 20-F, and as described from time to time in

subsequent reports filed with the U.S. Securities and Exchange Commission. The occurrence of the events described and the achievement of the

expected results depend on many events, some or all of which are not predictable or within our control. Consequently, actual results may differ

materially from the forward-looking statements contained in this presentation. We undertake no obligation to update or revise any forward-looking

statement as a result of new information, future events or otherwise, except as required by law.

                                                                                                                         Third Quarter 2016 – Earnings Call   2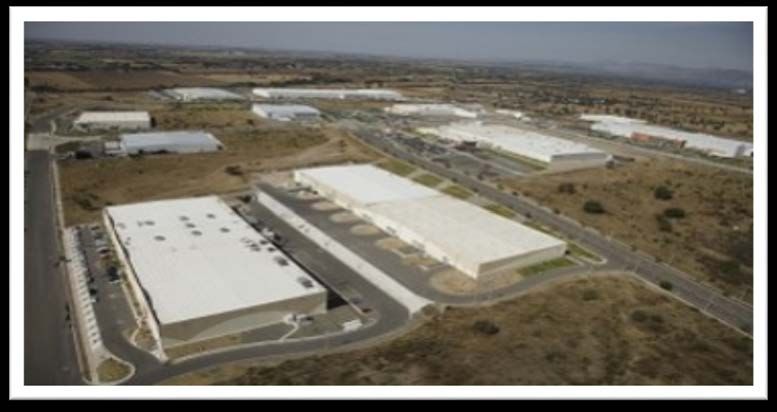
Non-GAAP measures

This presentation includes information regarding certain non-GAAP financial measures, including
Adjusted EBITDA, Adjusted EBITDA per metric ton, Adjusted Free Cash Flow and Net Debt. These
measures are presented because management uses this information to monitor and evaluate financial
results and trends and believes this information to also be useful for investors. Adjusted EBITDA
measures are frequently used by securities analysts, investors and other interested parties in their
evaluation of Constellium and in comparison to other companies, many of which present an adjusted
EBITDA-related performance measure when reporting their results. Adjusted EBITDA, Adjusted EBITDA
per Metric Ton, Adjusted Free Cash Flow and Net Debt are not presentations made in accordance with
IFRS and may not be comparable to similarly titled measures of other companies. These non-GAAP
financial measures supplement our IFRS disclosures and should not be considered an alternative to the
IFRS measures. This presentation provides a reconciliation of non-GAAP financial measures to the most
directly comparable GAAP financial measures.

                                                                                         Third Quarter 2016 – Earnings Call   3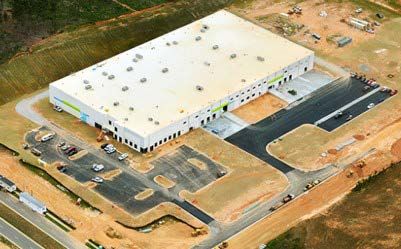
Jean-Marc Germain
Chief Executive Officer
Q3 2016 Highlights (Q3 2016 vs Q3 2015)
► Shipments of 377k metric tons, in-line with prior year
► Revenue of €1.2 billion, down 5% on a product mix shift
► Net Income of €15 million compared to a net loss of (€45 million)
► Adjusted EBITDA of €97 million, up 23%
Strong operational improvement in P&ARP segment, up
49% with Muscle Shoals contributing €26 million to
Adjusted EBITDA
Solid execution in AS&I segment, up 13%
Stable results in A&T segment
► Calling $150 million 9.75% Senior PIK Toggle Notes to reduce
gross debt
Third Quarter 2016 – Earnings Call 5First 100 days
► Visited most of our locations and developed a firm grasp on our
assets and capabilities
► Met with many of our customers, investors and analysts;
completed investor perception study
► Reshaped new senior management team
► Initiated work on a long-term operational, strategic and financial
plan for the business
► Calling the $150 million 9.75% Senior PIK Toggle Notes to
reduce gross debt
Third Quarter 2016 – Earnings Call 6Corinne Fornara Interim Chief Financial Officer
Adjusted EBITDA (Q3 2016 vs Q3 2015)

   € millions

   Solid growth in Adjusted EBITDA driven by improvement in P&ARP
                       and solid execution in AS&I

                                                            Third Quarter 2016 – Earnings Call   8
Packaging and Automotive Rolled Products Segment
Q3 Segment Performance Highlights
Q3 Adjusted EBITDA (€m)
Segment shipments up 1% to 265 kt in Q3 2016 60
► Stable packaging demand Q3/Q3 40
► Automotive rolled product shipments up 33%
Q3 15 Q3 16
Shipments: 262kt 265kt 1%
Per ton: €153 €226 48%
P&ARP Recent Developments
Update on Muscle Shoals
YTD Adjusted EBITDA (€m)
► Resolved metal management issues 8%
► Cost reduction initiatives in place
► In-sourcing used beverage can (UBC) procurement 146 158
on-track
2016 Auto Body Sheet finishing lines on-track YTD 15 YTD 16
► Officially launched new finishing lines at Neuf-Brisach,
France and Bowling Green, Kentucky Shipments: 796kt 777kt (2%)
► Both lines in qualification phase and on schedule Per ton: €184 €203 11%
Third Quarter 2016 – Earnings Call 9Aerospace and Transportation Segment
Q3 Segment Performance Highlights
Q3 Adjusted EBITDA (€m)
Segment shipments flat at 59 kt, transportation 0%
increase offsets seasonal aerospace decrease 20 20
Solid European aerospace market demand; good
aerospace plate production performance
Q3 15 Q3 16
Shipments: 59kt 59kt 1%
Per ton: €346 €344 (1%)
A&T Recent Developments
2017-2021 contract with Airbus – focused on higher YTD Adjusted EBITDA (€m)
value-add products (pre-machining) 5%
Strong aerospace order book 81
77
AIRWARE® profitability substantial; products set
for continued volume ramp-up and cost reductions
(C-Series and A350)
YTD 15 YTD 16
Pusher furnace in Ravenswood on schedule,
expected to improve cost position and provide new Shipments: 181kt 184kt 2%
product growth opportunities Per ton: €427 €439 3%
Third Quarter 2016 – Earnings Call 10Automotive Structures and Industry Segment
Q3 Segment Performance Highlights
Q3 Adjusted EBITDA (€m)
Segment shipments of 53 kt, up 4% +13%
25
Strong demand in automotive structures, improved 22
demand in soft alloys
Continuous operational improvement Q3 15 Q3 16
Shipments: 51kt 53kt 4%
Per ton: €428 €471 10%
AS&I Recent Developments
YTD Adjusted EBITDA (€m)
Continuing solid quarterly performance in Adjusted
EBITDA
+32%
Strong nominations in Crash Management Systems,
81
Automotive Structures and Body Structures 62
Georgia and Mexico facilities, on target for start-up in
2017 and 2018, respectively YTD 15 YTD 16
Large profile opportunities growing Shipments: 164kt 168kt 2%
Per ton: €375 €485 29%
Third Quarter 2016 – Earnings Call 11Adjusted Free Cash Flow
Three months Three months
ended ended
€ millions
September 30, September 30,
2015 2016
Cash flows from operating activities 80 67
Capital expenditures (85) (74)
Adjusted free cash flow (5) (7)
Adjusted free cash flow reflects high levels of capital expenditures as we continue to
improve asset integrity and invest in our growth projects
Third Quarter 2016 – Earnings Call 12Strong Liquidity
€ millions December 31, 2015 June 30, 2016 September 30, 2016
Total Debt (*) 2,175 2,450 2,482
Cash and Cash
472 622 618
Equivalents (**)
Net Debt 1,703 1,828 1,864
Liquidity (***) 733 792 791
Ample and stable liquidity
(*) Including fair value of cross currency interest swap and cash pledged for issuance of guarantees
(**) Cash and cash equivalents include €20 million one-time payment related to the renegotiation of a customer agreement
(***) Liquidity measured as the sum of Cash and Cash Equivalents and availability under long-term committed facilities
Third Quarter 2016 – Earnings Call 13Jean-Marc Germain Chief Executive Officer
Key Takeaways From Investor Perception Outreach

          Investment appeals                Investment concerns

         ►      Balanced business mix       ►   Limited transparency

         ►      Attractive end markets      ►   Debt-heavy balance sheet

         ►      Earnings growth potential   ►   Inconsistent execution

         ►      Manufacturing excellence    ►   Strategic uncertainty

         ►      New management

          Metrics used in measuring
                                            What investors want to know
          success

         ►      EBITDA growth               ►   Financial outlook

         ►      Free cash flow              ►   Strategic clarity

                                            ►   Details about contracts

                                            ►   Opportunity for Auto Body Sheet
Source: Rivel

                                                                           Third Quarter 2016 – Earnings Call   15
Our Path Forward
► Focus on operational excellence, ensure disciplined capital
deployment and build financial flexibility
► Enhance our dialogue with customers, investors and analysts
► Finalize our long-term operational, strategic and financial plan
with a communication planned in March 2017 post earnings
announcement
► Maintain a disciplined focus on our core automotive and
aerospace growth opportunities
Third Quarter 2016 – Earnings Call 16Official Launch at Neuf-Brisach and Bowling Green
► In October 2016, opened new
auto body sheet 100k metric
ton finishing line at Neuf-
Brisach, France;
► New finishing line in the final
stage of the qualification phase
and has begun commercial
production
► In September 2016,
opened new auto body
sheet 100k metric ton
finishing line at Bowling
Green, Kentucky under
joint venture with UACJ;
► New finishing line in
qualification phase and
expected to ship
commercial coils in Q4
2016
Third Quarter 2016 – Earnings Call 17Expansion and Growth at AS&I
► New $20 million
manufacturing facility in
White, Georgia to produce
aluminium automotive
structural components on
schedule for completion;
► Production expected to begin
in 2017
► New $10 million
manufacturing facility in San
Luis Potosí, Mexico to
produce aluminium
automotive structural
components on schedule for
completion;
► Production expected to begin
in 2018
Third Quarter 2016 – Earnings Call 18Key Takeaways
► Improved results in P&ARP segment, solid execution in AS&I,
and stable performance in A&T
► Solid Q3 Adjusted EBITDA performance of €97 million, up 23%
quarter-over-quarter, and up 11% year-over-year; typical
seasonal softness in Q4; solid foundation for 2017
► New management team in place and focused on execution
► Current capital investment program under review; core earnings
growth strategy remains in place
► Reducing leverage/increasing financial flexibility is a priority
Third Quarter 2016 – Earnings Call 19Q&A
Third Quarter 2016 – Earnings Call 20Appendix
Third Quarter 2016 – Earnings Call 21Shipments by Product Line (000’s metric tons)
k metric tons Three months Three months
September 30, September 30,
2015 2016
Packaging rolled products 224 226
Automotive rolled products 21 28
Specialty and other thin-rolled products 17 11
Aerospace rolled products 30 27
Transportation, industry, and other rolled products
29 32
Automotive extruded products 23 24
Other extruded products 28 29
Eliminations and other 2 0
Total 374 377
Third Quarter 2016 – Earnings Call 22Shipments by Product Line (000’s metric tons)
k metric tons Nine months Nine months
September 30, September 30,
2015 2016
Packaging rolled products 678 658
Automotive rolled products 65 85
Specialty and other thin-rolled products 53 34
Aerospace rolled products 89 88
Transportation, industry, and other rolled products
92 96
Automotive extruded products 74 76
Other extruded products 90 92
Eliminations and other - (3)
Total 1,141 1,126
Third Quarter 2016 – Earnings Call 23IFRS – Q3 2016 Income Statement
€ millions
Three months ended Three months ended
September 30, 2015 September 30, 2016
Revenue 1,259 1,199
Income / (loss) from operations (1) 84
Finance costs – net (40) (45)
Share of loss of joint-ventures (1) (6)
Income / (loss) before income taxes (42) 33
Income tax expense (3) (18)
Net income / (loss) (45) 15
Third Quarter 2016 – Earnings Call 24IFRS – YTD 2016 Income Statement
€ millions
Nine months ended Nine months ended
September 30, 2015 September 30, 2016
Revenue 4,031 3,582
Income / (loss) from operations (8) 217
Finance costs – net (119) (130)
Share of loss of joint-ventures (2) (8)
Income / (loss) before income taxes (129) 79
Income tax (expense) / benefit 6 (63)
Net income / (loss) (123) 16
Third Quarter 2016 – Earnings Call 25IFRS – Statement of Financial Position
€ millions At December 31, At September 30,
2015 2016
Non-current assets 2,166 2,218
Current assets 1,449 1,698
Assets held for sale 13 -
Total Assets 3,628 3,916
Equity (540) (596)
Non-current liabilities 2,962 3,410
Current liabilities 1,193 1,102
Liabilities held for sale 13 -
Total Equity and Liabilities 3,628 3,916
Third Quarter 2016 – Earnings Call 26Net Debt Reconciliation
€ millions December 31, June 30, September 30,
2015 2016 2016
Borrowings 2,233 2,498 2,522
Fair value of cross currency interest rate swap (47) (39) (31)
Cash and cash equivalents (472) (622) (618)
Cash pledged for issuance of guarantees (11) (9) (9)
Net Debt 1,703 1,828 1,864
Third Quarter 2016 – Earnings Call 27Reconciliation of Net Income to Adjusted EBITDA
Three months Three months Nine months Nine months
ended ended ended ended
€ millions
September September September September
30, 2015 30, 2016 30, 2015 30, 2016
Net income / (income) (45) 15 (123) 16
Income tax expense / (benefit) 3 18 (6) 63
Income / (loss) before income tax (42) 33 (129) 79
Finance costs - net 40 45 119 130
Share of loss of joint-ventures 1 6 2 8
Income / (loss) from operations (1) 84 (8) 217
Metal price lag 22 (2) 22 3
Start-up and development costs 10 3 19 16
Manufacturing system and process transformation costs 4 - 6 4
Wise acquisition and integration costs 1 - 11 2
Wise one-time costs 2 - 38 20
Wise purchase price adjustment - (19) - (19)
Loss on Ravenswood OPEB plan amendments - - 4 -
Depreciation, amortization, and impairment 38 37 121 109
Restructuring costs 1 1 6 5
Unrealized (gains) / losses on derivatives 1 (12) 28 (65)
Unrealized exchange losses / (gains) from remeasurement of
- 1 3 (1)
monetary assets and liabilities – net
(Gains) / losses on disposal and assets classified as held for sale (3) - 7 -
Share based compensation 2 2 4 5
Other 2 2 6 -
Adjusted EBITDA 79 97 267 296
Third Quarter 2016 – Earnings Call 28Liquidity Details
€ millions Availability at Availability at
June 30, 2016 September 30, 2016
Ravenswood ABL 35 28
Wise ABL 95 101
Factoring 33 37
Other 7 7
Total 170 173
Cash and cash equivalents 622 618
Total Liquidity 792 791
Third Quarter 2016 – Earnings Call 29Borrowings Table
€ millions At December 31, 2015 At September 30, 2016
Amount Type of Nominal Effective Amount Type of Nominal Effective
rate rate rate rate rate rate
Senior Notes
Constellium N.V.
In U.S. Dollar (due 2024) 365 Fixed 5.75% 6.26% 361 Fixed 5.75% 6.26%
In Euro (due 2021) 297 Fixed 4.63% 5.16% 301 Fixed 4.63% 5.16%
In U.S. Dollar (due 2023) 375 Fixed 8.00% 8.61% 359 Fixed 8.00% 8.61%
In Euro (due 2023) 244 Fixed 7.00% 7.54% 239 Fixed 7.00% 7.54%
In U.S. Dollar (due 2021) — — — — 385 Fixed 7.88% 8.94%
Muscle Shoals (Wise Metals Group
LLC) (due 2018) 622 Fixed 8.75% 7.45% 614 Fixed 8.75% 7.45%
Senior PIK Toggle Notes (due 2019)
Muscle Shoals (Wise Metals
Intermediate Holdings LLC) 145 Fixed 9.75% 8.40% 150 Fixed 9.75% 8.58%
U.S. Revolving Credit Facility (ABL)
Constellium RP Ravenswood, LLC 23 Floating — 4.00% 41 Floating — 3.11%
Muscle Shoals (Wise Alloys LLC) 99 Floating — 2.60% — Floating — —
Unsecured Credit Facility (Constellium
N.V.) — — — — — — — —
Others 63 — — — 72 — — —
Total Borrowings 2,233 — — — 2,522 — — —
Of which non-current 2,064 2,408
Of which current 169 114
Third Quarter 2016 – Earnings Call 30You can also read