SBI CARDS & PAYMENT SERVICES LTD IPO "SUBSCRIBE" - Price Band : ' 750-' 755
←
→
Page content transcription
If your browser does not render page correctly, please read the page content below

SBI CARDS & PAYMENT
      SERVICES LTD
          IPO
Price Band : ` 750–` 755
   Our Recommendation
      “SUBSCRIBE”
THE OFFER
Issue Open : 02nd March 2020 to 05th March 2020

 »» Issue Type: Book Built Issue IPO

 »» Total Issue Size: ` 10,354.77 cr

    Fresh issue: 6,622,517 Equity Shares @ 10 aggregating up to ` 500 cr
    Offer for sale: 130,526,798 Equity Shares @ 10 aggregating up to `9854.77

 »» Face Value: ` 10 Per Equity Share

 »» Issue Price: ` 750 - ` 755 Per Equity Share

 »» Employee Discount: ` 75 Per Equity Share

 »» Market Lot: 19 Shares

 »» Minimum Order Quantity: 19 Shares

 »» Listing At: NSE & BSE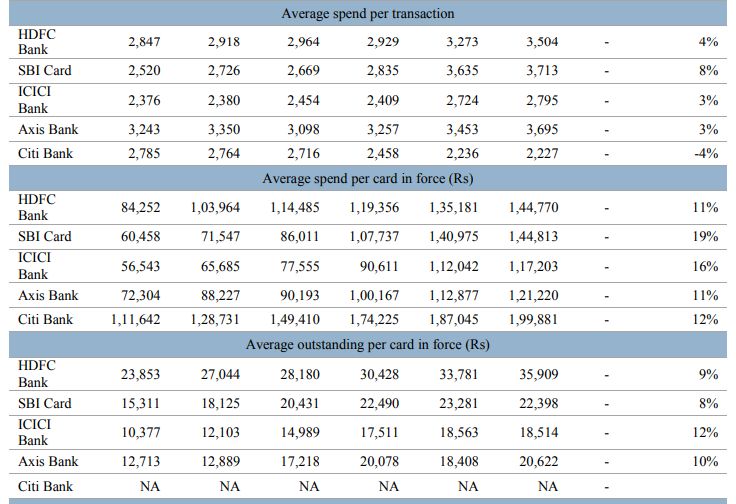
CAPITAL STRUCTURE
The share capital of Company, is set forth below:-
                                     (Amount in ` except share data)

Authorized Share Capital :-
1,500,000,000 Equity Shares @10 Aggregate value ` 15,000,000,000

Issued, subscribed and paid up capital before the Offer :-
 932,334,278 Equity Shares @10 Aggregate value ` 9,323,342,780

Fresh Issue:-
6,622,517 Equity Shares @ 10 aggregating up to ` 500 cr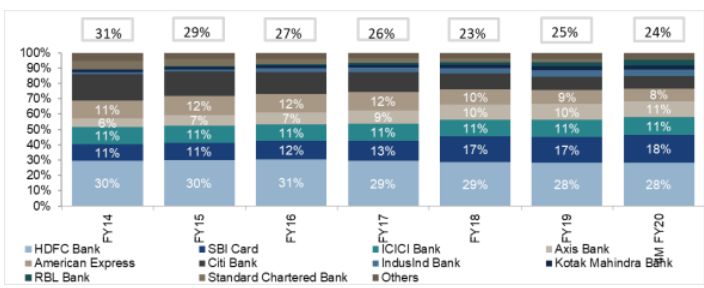
OBJECT OF THE OFFER The objects of the Offer are: To utilize the Net Proceeds from the Issue towards augmenting capital base to meet future capital requirements. To achieve the benefit of listing the equity shares on the Stock Exchanges. Means of Finance

COMPANY OVERVIEW
Incorporated in 1998, SBI Cards and Payment Services Limited
is a subsidiary of SBI, India's largest commercial bank in terms of
deposits, advances and the number of branches. SBI currently holds
(along with its nominees) 689,927,363 Equity Shares, constituting to
74.00 % of the pre-Offer issued, subscribed and paid-up Equity Share
capital of the Company. Post the stake sale, SBI will hold a 63.55 %
stake in the company and is expected to strengthen its Tier I
ratio by 37 bps.

SBI Cards is the second-largest credit card issuer in India (behind
leader HDFC bank) with credit card base and credit card spends
capturing 18.1% and 17.9% market share in the respective
categories, as of November 2019. With remarkable growth &
profitability, the total credit card spends & credit cards outstanding grew
at a CAGR of 34.5% & 54.2% (March 2017 to March 2019).
It has 18 co-branded partnerships, the highest in the industry compared to other players, followed by ICICI Bank at 12 and RBL Bank at 8. Also, as SBI Card is supported by strong brand, provides access to SBI’s extensive branch network (21,961 branches) across India, which enables to market its cards to SBI’s vast customer base comprising 445.5 million customers as of December 2019. Partnership with SBI in particular has the potential to become a significant source of new customer acquisitions in the future. SBI Cards has partnered with leading brands across industries including Air India, Apollo Hospitals, BPCL, Etihad Guest, Fbb, IRCTC, OLA Money and Yatra, amongst others. Launched 6 new products in nine months ended December 31, 2019, as compared to 4 new products in fiscal 2019 and 6-7 new products in fiscals 2018 and 2017, respectively.
COMPETITIVE SCENARIO IN CREDIT
                 CARD INDUSTRY
Concentrated market – top 4 players account for two-third of
credit card spends :
There are a total of 74 players offering credit cards in India, with the
top three private banks (HDFC Bank, Axis Bank and ICICI Bank)
and SBI Card, as the leading pure-play credit card issuer, dominating
the credit card business with a total of approximately 72.0% market
share by number of outstanding credit cards as of March 2019 and
approximately 66.0% market share by credit card spends in FY
2019. According to CRISIL, top players, such as HDFC, SBI
Card, ICICI and Axis Bank, are expected to continue to account
for approximately 70.0% market share of overall credit card
outstanding as of FY 2020.
Breakdown of market share in terms of
total credit card spendsSBI Card has the highest market share in terms of incremental cards in force across different periods: SBI Card has the highest market share in terms of incremental cards in force across different time periods with 45.0% market share in the last one month (1M), 27.0% in the past six months (6M) and approximately 23.0% in the past 12 months (12M), 24 months (24M) and 36 months (36M) from July 2019. SBI Card has been able to continuously gain market share in terms of incremental cards in force in the industry over the years. This is followed by ICICI Bank which grew at a similar pace to that of SBI Card.
PEER COMPARISON
Below table summarizes and compares the operating
parameters of key players in the credit card industry.
STRATEGIES AHEAD Stimulate growth in credit card transaction volumes Expand customer acquisition capabilities to grow cardholder base Tap into new cardholder segments by broadening portfolio of credit card products Continue to optimize risk management processes Continue leveraging technology across operations Enhance cardholder experience
STRENGTHS Supported by a strong brand and pre-eminent Promoter Second largest credit card issuer in India with deep industry expertise and a demonstrated track record of growth and profitability Diversified customer acquisition capabilities Diversified portfolio of credit card offerings Leading player in open market customer acquisitions using physical and digital channels in India. Modern and scalable technology infrastructure Has the highest market share in terms of incremental cards in force across different periods
FINANCIAL HIGHLIGHTS Diversified revenue model whereby it generate both non-interest income as well as interest income on credit card receivables. The share of revenue from operations derived from non-interest income has steadily increased over past three fiscal years, from 43.6% in FY 2017 to 48.9% in FY 2019. Total income increased from `3471.03 Cr. in FY 2017 to `7286.83 Cr. in FY 2019 at a CAGR of 44.9% and revenues from operations have increased from `3346.20 Cr in FY 2017 to ` 6999.11 Cr. in FY 2019 at a CAGR of 44.6%. Net profit increased from `372.86 Cr. in FY 2017 to ` 862.72 Cr. in FY 2019 at a CAGR of 52.1%. Average EPS in last 3 years is `7.97 and in FY2019 at ` 9.43. For 9 months ended Dec-2019, EPS stood at `12.45.
FINANCIAL HIGHLIGHTS Company has been maintaining an ROE of over 25% , stood at 30% in FY19, 32.40 % in FY18 and 28.60% in FY 17 NII increased nearly 25% Y-o-Y to `2558.50 crores in FY 19 compared to `1359.72 crores and `2048.46 crores in FY 17 & FY 18 respectively Total assets stood at `25993.46 crore as at December 2019 and `20239.63 as on March 2019. Net worth of the company jumped 147 % to ` 3,581.72 crore in FY19 over `1,448.81 crore in FY17. Pre-provision operating profit increased 9.74 % to ` 2,720.70 crore for the nine- month ended December 2019 as against ` 2,479.30 crore and ` 17,194 crore in FY19 and FY18, respectively.
FINANCIAL HIGHLIGHTS ROAE has remained stable at 28.5% in FY 2017 and 28.4% in FY 2019, while ROAA increased from 4.0% in FY 2017 to 4.8% in FY2019. Interest on revolving credit card balances and monthly installment balances comprised 51.7% and 51.0% of total revenue from operations in the nine months ended December 31, 2018 and 2019 , respectively, as compared to 51.1% in FY2019, 53.2% in FY2018 and 56.4% in FY 2017. As of December 31, 2019, and March 31, 2019, cash and bank balances were `5,07.77 Cr. and ` 7,76.77 Cr., respectively. As of December 31, 2019, and March 31, 2019, undrawn borrowing facilities totaled at `21,97.75 Cr and `3682.63 Cr., respectively. Gross NPA during the first nine months of FY20 was at 2.47 % while net NPA was at 0.83 %.
RESULTS SNAPSHOT
RESULTS SNAPSHOT
RISK FACTORS Face competition in the credit card market from other credit card issuers and payment solutions providers Face huge competition from banks, NBFCs, and payment banks. Any loss/reduction in level of support from promoter (SBI) and 100 % unsecured lending with no collateral could have adversely impact on company Dependency on third-party payment networks to operate credit card business. Growth depends on ability to retain existing co-brand partners and attract new co-brand partners.
VALUATION
Second-largest credit card issuer in India(nearly 18 % market
share), healthy financial ratios and fundamentals, SBI’s strong
parentage, niche business, and first listing in particular industry,
provides ample scope for growth momentum.
Even, credit cards business has a good prospective in future as younger
people prefer to use them for consumption needs. Also, company is
well positioned to take advantage of rising trend of digital payments
in future.
On the upper price band of ` 755, with estimated EPS at `16.6 for
FY 20, the stock is currently available at a P/E ratio of 45.48x.
Given, top 4 players including SBI dominating more than 70%
market share (FY19) and extreme growth outlook, SBI Cards
commands high P/E and will get advantage for the same. Thus,
could give premium valuations.
Therefore, we recommend to SUBSCRIBE the IPO for listing gains
as well as for long term perspective.
DISCLAIMERS
This Research Report (hereinafter called report) has been prepared and presented by RUDRA SHARES & STOCK BROKERS LIMITED, which does
not constitute any offer or advice to sell or does solicitation to buy any securities. The information presented in this report, are for the intended
recipients only. Further, the intended recipients are advised to exercise restraint in placing any dependence on this report, as the sender, Rudra
Shares & Stock Brokers Limited, neither guarantees the accuracy of any information contained herein nor assumes any responsibility in relation to
losses arising from the errors of fact, opinion or the dependence placed on the same.

Despite the information in this document has been previewed on the basis of publicly available information, internal data , personal views of the
research analyst(s)and other reliable sources, believed to be true, we do not represent it as accurate, complete or exhaustive. It should not be
relied on as such, as this document is for general guidance only. Besides this, the research analyst(s) are bound by stringent internal regulations
and legal and statutory requirements of the Securities and Exchange Board of India( SEBI) and the analysts' compensation was, is, or will be not
directly or indirectly related with the other companies and/or entities of Rudra Shares & Stock Brokers Ltd and have no bearing whatsoever on
any recommendation, that they have given in the research report

Rudra Shares & Stock Brokers Ltd or any of its affiliates/group companies shall not be in any way responsible for any such loss or damage that
may arise to any person from any inadvertent error in the information contained in this report. Rudra Shares & Stock Brokers Ltd has not
independently verified all the information, which has been obtained by the company for analysis purpose, from publicly available media or other
sources believed to be reliable. Accordingly, we neither testify nor make any representation or warranty, express or implied, of the accuracy,
contents or data contained within this document. Rudra Share & Stock Brokers Ltd and its affiliates are engaged in investment advisory, stock
broking, retail & HNI and other financial services. Details of affiliates are available on our website i.e. www.rudrashares.com.

We hereby declare, that the information herein may change any time due to the volatile market conditions, therefore, it is advised to use own
discretion and judgment while entering into any transactions, whatsoever.
Individuals employed as research analyst by Rudra Shares & Stock Brokers Ltd or their associates are not allowed to deal or trade in securities,
within thirty days before and five days after the publication of a research report as prescribed under SEBI Research Analyst Regulations.

Subject to the restrictions mentioned in above paragraph, we and our affiliates, officers, directors, employees and their relative may: (a) from time
to time, have long or short positions acting as a principal in, and buy or sell the securities or derivatives thereof, of Company mentioned herein or
(b) be engaged in any other transaction involving such securities and earn brokerage or profits.
THANK YOU
You can also read