Powertrain Evolution in the Passenger Car and Commercial Vehicle Sectors - Andy Walker, Technical Marketing Director - Future Powertrain ...
←
→
Page content transcription
If your browser does not render page correctly, please read the page content below
Powertrain Evolution in the Passenger Car
and Commercial Vehicle Sectors
Andy Walker, Technical Marketing Director
February 27th, 2019
Contents

           • Introduction

           • Regulations and other Key Market Drivers in the Passenger Car Market

           • Powertrain Evolution in the Commercial Vehicle Market

           • Conclusions

                                                                                    2
Innovation in Automotive Systems

                         ICE                Li   BEV
         Emission Control Catalysts              Li-Ion Battery Materials
                         TWC / GPF               Lithium Iron Phosphate
DOC / LNT / CSF / SCR / SCRF / ASC               Nickelate Materials
                                                 High Voltage Spinel
                                                 Lithium Titanate

                    PHEV                    Li   FCEV
          Emission Control Catalysts             Hydrogen Catalysts
            Li-Ion Battery Materials             On-Board Reforming
                                       Li   H    Proton Exchange Membranes
                                                 Coated Catalyst Systems
                                                 Membrane Electrode Assemblies
                                                 Li-Ion Battery Materials

                                                                                 3
Contents

           • Introduction

           • Regulations and other Key Market Drivers in the Passenger Car Market

           • Powertrain Evolution in the Commercial Vehicle Market

           • Conclusions

                                                                                    4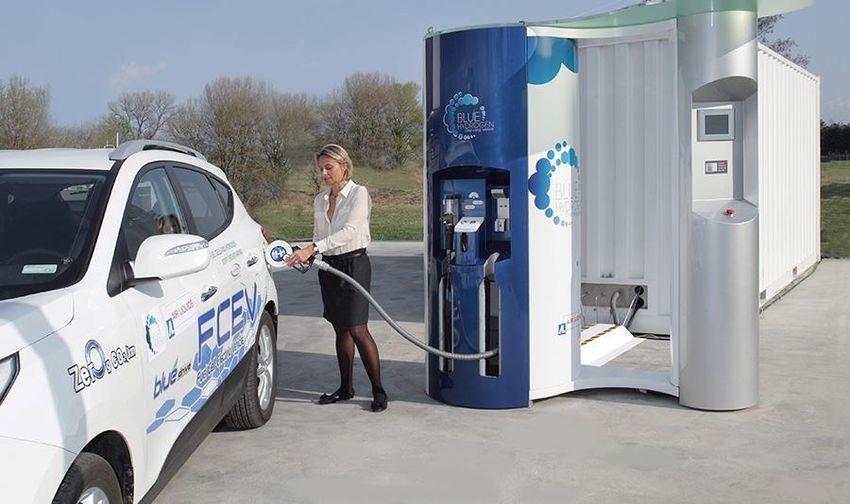
European Passenger Car CO2 Regulation Proposal Evolution
       1. European Commission Proposal                          2. European Parliament Amendment

2025    -15% CO2 (vs 2021 baseline)                        2025    -20% CO2 (vs 2021 baseline)
2030    -30% CO2 (vs 2021 baseline)                        2030    -40% CO2 (vs 2021 baseline)

Low (PHEV) and Zero Emission Vehicle benchmark             OEMs to ensure Low and ZEV are 20% of OEM
targets of 15% in 2025 and 30% in 2030                     fleet in 2025, and 35% in 2030
OEMs who exceed these levels would have a less             From 2025, OEMs to report the Life Cycle CO2 Emissions
stringent CO2 fleet target                                 of new vehicles, using a common protocol

    3. European Council General Approach                          4. Trilogue Discussion Conclusions

2025    -15% CO2 (vs 2021 baseline)                        2025    -15% CO2 (vs 2021 baseline)
2030    -35% CO2 (vs 2021 baseline) for cars               2030    -37.5% CO2 (vs 2021 baseline) for cars
2030    -30% CO2 (vs 2021 baseline) for vans               2030    -31% CO2 (vs 2021 baseline) for vans

Low (PHEV) and Zero Emission Vehicle benchmark             Low (PHEV) and Zero Emission Vehicle benchmark
targets of 15% in 2025 and 35% in 2030                     targets of 15% in 2025 and 35% in 2030
OEMs to report measured (instead of declared) CO2          OEMs who exceed these levels have a less stringent CO2
emissions – OEMs typically declare higher levels for COP   fleet target – eg 40% ZLEV in 2030 = 1.05 x CO2 target
                                                           OEMs to report measured and declared CO2 emissions
                                                                                                              5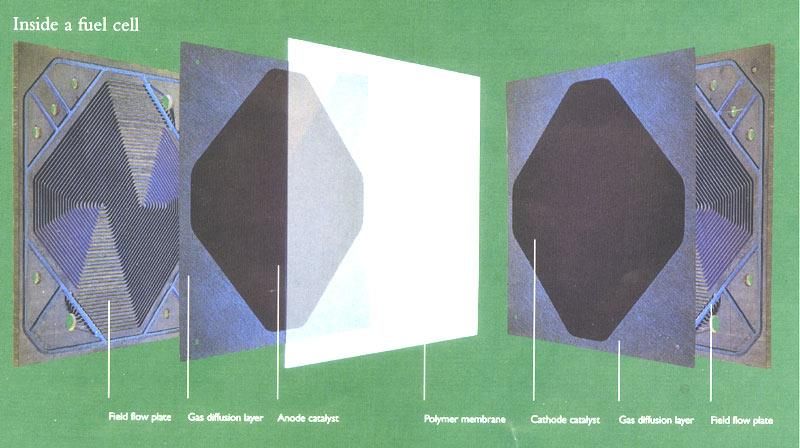
Evolution of Global PC CO2 Regulations – Significant Incoming Reductions

   Confirmed                Proposed (under review)                          Scenario

                                                         NEDC (WLTP
EPA 2 cycle                                                                                            NEDC
                                                         from 2021)

                                                                         WLTP
                                                                        mark-up

                                                       EU Regulations to 2030:
                                                            15% reduction from 2021 levels in 2025
                                                            37.5% reduction from 2021 levels in 2030

               EU:     based on GHG reduction targets for transport sector by EU
               US:     4% annual reduction assumed after 2025
               China: convergence with EU targets expected
               Source: ICCT, European Commission, ACEA                                                        6
Assessment of the Evolution of Direct CO2 Emissions from Road Transport in the EU

                                                                The EU has a binding GHG target of 30% below 1990
                                                                levels in 2030. The sectors covered by EU Emissions
                                                                Trading System (ETS) must deliver 43% GHG
                                                                reduction (compared to 2005 levels) by 2030. The
                                                                non-ETS sectors, which include transport, must deliver
                                                                a 30% reduction (also compared to 2005 levels)

        Source: ICCT “CO2 emission standards for passenger cars and light-commercial vehicles in the EU”, January 2019   7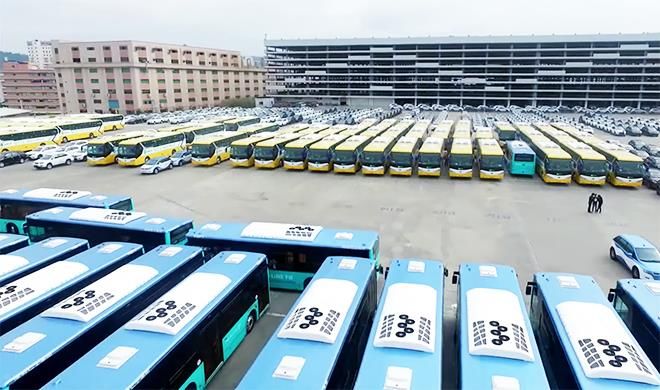
There are Many Projections on How the EV Market Will Grow
million vehicles Regulations
ICE Infrastructure
120 Cost
TCO
100 OEM offerings
BEV Range concerns
80 55%
43%
60 PHEV
28% sales
40
11% All EVs
20 2% 3% % of
sales
0
2015 2020 2025 2030 2035 2040
Source: Bloomberg New Energy Finance, Long Term Electric Vehicle Outlook, May 2018 8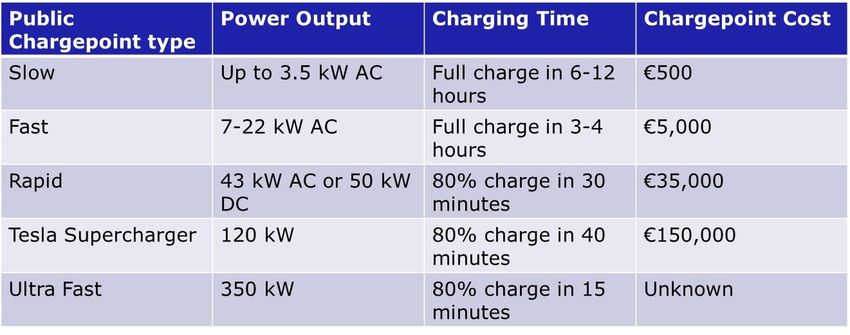
Projected Evolution of Battery Pack Prices

                                                         Credit Suisse, 2018

                                                         Bernstein 2017

                                                         CATL 2018

                                             140
                                             130
                                                   100
                                       100

                                                                          (2017)

                                                                           9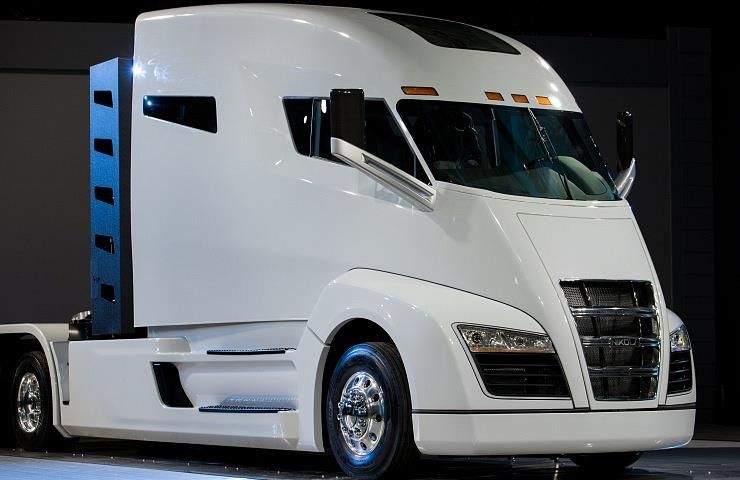
Key Market Drivers: Consumer Sentiment and Concerns

Infrastructure        20%   16%    20%    44%    22%       18%         25%         23%        34%            22%

Price/Cost            28%   32%    22%    19%    24%       9%          14%         31%        22%            26%

Range                 31%   31%    35%     4%    26%       25%         14%         18%         10%           24%

Charging Time         9%    11%    11%    18%    13%       12%         11%         11%        17%            10%

BEV Safety            5%     4%     5%     7%     6%       22%         22%         9%          11%           8%

No BEV in Preferred
                      2%     3%     3%     4%    3%        11%         7%          3%          4%            5%
Model

Favoured OEM
                      3%     2%     2%     3%    4%        3%          7%          3%          1%            3%
Doesn’t Make BEVs

                       Some interesting differences in perceived BEV concerns by country
                                                   Source: Deloitte Global Automotive Consumer Survey 2018
Key Market Drivers: Infrastructure – Electric Charging
European Picture
(Late Summer 2018)
• EU Alternative Fuels Infrastructure directive sets a target of 1 public charging point for every 10 EVs
Good growth continues in European BEV public charging infrastructure
Source: eafo, Energy Efficient End-Use Equipment Technology Collaboration Program, IEA Global Outlook 2018
11
http://www.eafo.eu/electric-vehicle-charging-infrastructureKey Market Drivers: Infrastructure – Electric Charging – the UK Picture
• EU Alternative Fuels Infrastructure directive
sets a target of 1 public charging point for
every 10 EVs
– Today there are around 155k EVs on the UK’s
roads
• Lack of domestic charging infrastructure could
be potential headwind limiting BEV uptake in
areas with limited off-road parking
– 72% of UK vehicle owners have access to off
street parking
– this falls in major cities: 48% in London, 61%
Edinburgh and Cardiff, 65% Manchester
Growth continues in UK BEV public charging infrastructure
Source: https://www.zap-map.com/statistics, IEA Global Outlook 2018
12The UK‘s Road to Zero Ultra Low Emission Vehicle Targets, and Implications
New Car Sales 50% EV
“We want to see at least 50%, and as many as
70%, of new car sales and up to 40% of new
van sales being ultra low emission by 2030”
620k Public Chargepoint Connectors
Source: UK Government: “The Road to Zero”, July 2018
13Drive To Higher Energy Density Battery Materials for Enhanced BEV Range
Energy density and commercial introduction
Wh/kg
(not to scale) Intelligent materials design maximises nickel content
and energy without compromising performance
Key areas of enhancement compared to other high-
nickel materials:
eLNO • Higher energy density
NMC 811
Advanced
• Better cycle life
NCA
NMC 532 Efficient use of cobalt gives stability and power whilst
NMC 622
NCA keeping overall content of all JM gradesContents
• Introduction
• Regulations and other Key Market Drivers in the Passenger Car Market
• Powertrain Evolution in the Commercial Vehicle Market
• Conclusions
15Electrification of the Transit Bus Market Today
• 385k Electric Transit Buses in 2017
(13% of the global fleet)
• Over 380k of these are in China
(supported by incentives), with around
1.5k in EU and 0.4k in US
• Shanghai and Shenzhen buy only
electric buses
• Shenzhen fleet is 100% electrified –
around 16.5k buses
– 510 bus charging stations; 8k charging
points
– $500M subsidy for buses and charging
infrastructure
Source: BNEF “Electric Buses in Cities” March 2018 16Projected Penetration of E-Buses into Urban Bus Market
• Electric bus market already
strong in China
• Expect increased penetration
in Europe and US/NA
• London to increase its BEV
fleet from 120 to 300 by
2020
• Oslo committed to fossil
fuel-free public transport by
2020
17Electrification of the CV Truck Market
Europe electrifies first, based on Diesel fuel price differential vs electricity
LDT leads MDT, with HDT line haul cost parity being beyond 2030, if ever….
Source: McKinsey New Reality: electric trucks and their implications on energy demand, September 2017 18Projected Penetration of BEVs into LDT/MDT
Electric LDT Electric MDT
Some LDT and MDT systems can reach price parity with diesel today, by right-sizing battery pack
Europe electrifies first, based on Diesel fuel price differential vs electricity
Relatively low adoption in China due to low cost of diesel LDT/MDT
Weight class definitions: US: MDT: Class 4-7 (6.4-15t); LDT: Class 2-3 (3.5-6.4t)
EU: MDT: 7.5-16t , LDT: 3.5-7.5t
CN: MDT: 6-14t , LDT: 1.8-6t
Source: McKinsey New Reality: electric trucks and their implications on energy demand, September 2017 and JM analysis 19Projected Penetration of BEVs into HDT
Electrification looks promising for City Bus, LDT and MDT
But how do we decarbonise HD Trucks?
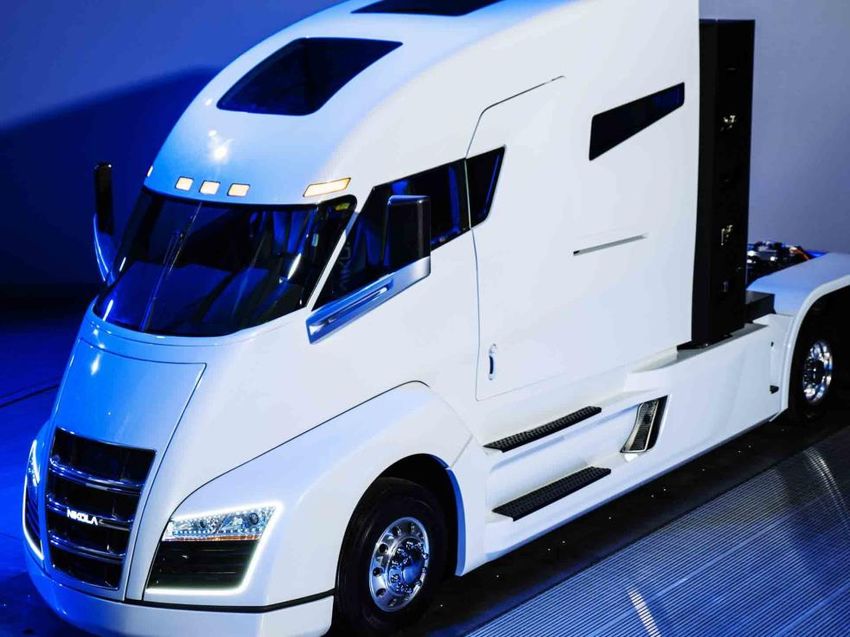
Source: McKinsey New Reality: electric trucks and their implications on energy demand, September 2017 20Possible Approaches to Decarbonise Long Haul HDD Trucks
Catenary Electric Drive
• Overhead cabling with pantograph
• Scania/Siemens trials ongoing in Stockholm
• ~ 80% efficient (twice as high as diesel freight)
• Suitable for heavily travelled freight corridors?
• Expensive?
• Global/cross regional alignment of standards?
Inductive Charging in the Road
• Less mature technology
• Major infrastructure investment required
Fuel Cell
• High efficiency (over 50% cf ~40% HDD engine)
• Quick refuelling
• Can use H2 from renewable sources
• Long range, but requires hydrogen infrastructure
• Renewable H2 expensive; fuel cells relatively expensive
• Nikola field trials starting this autumn
21JM and Fuel Cells
JM’s key product is the MEA
(Membrane Electrode Assembly)
A sandwich of two sheets of carbon paper,
two catalyst layers and a membrane
Making good MEAs requires skills in
materials science, chemistry, physics
and catalysis
Technical focus on reducing Pt loadings to
drive costs down
The cell is completed by two conducting
plates that distribute gas over the outer
surfaces of the MEA sandwich
A fuel cell stack is simply a stack of cells
The current is determined by the area of
the MEA and the voltage is determined by
the number of cells stacked together
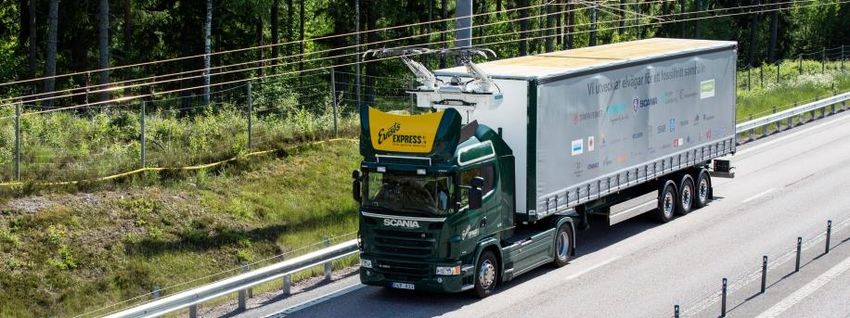
22Key Market Drivers: Range and Rapid Refuelling
Honda Clarity FCEV fuelled at Beaconsfield
Diesel/gasoline tank charge rate 25 MW could drive to Edinburgh on a single tank of H2
H2 tank charge rate 5 MW
BEV charge rate 0.007-0.12 MW
BEV future ultra fast charging 0.35 MW
More rapid charging (and longer range) with ICE
and FCEV – range anxiety still a concern with BEVs
Source: https://www.zap-map.com/charge-points/connectors-speeds/
23Global H2 Refuelling Station Development and FCEV Targets
Country/State Today 2020 2025 2030
Japan HRS 90 160 320 900
Japan FCEVs 2,000 40,000 200,000 800,000
China HRS 30 > 100 > 300 > 1,000
China FCEVs 1,500 5,000 50,000 > 1M
S Korea HRS 20 310 (2022) 520
S Korea FCEVs 16,000 1.8M
Nordic Hydrogen Corridor
Zero emission transportation California HRS 35 94 200
between the capitals of the Nordic California FCEVs 23,600 (2021) 47,200 (2024)
countries:
• 8 HRSs by 2020 France HRS 20 100 (2023) 700 (2028)
• Zero GHG transportation – H2 from
France FCEVs 5,200 (2023) 36,000 (2028)
renewables
Each HRS can service up to around Germany 43 100 400 (2023) 1000
1k vehicles or so
UK 14 31
24Projected Fuel Cell Cost Reduction with Economies of Scale
The Scale of Production has a significant
Impact on the Cost of Fuel Cell Stacks
JM Membrane Electrode Assembly
development focused on reduction
of Pt loading, along with improved
Cost ($/KWnet)
performance and durability
Annual Production Rate (Systems/Year)
Source: DOE 25Some Fuel Cell Truck Offerings: Nikola
• Nikola Truck with up to 1,600 km range
• Nikola business model leases the truck to users, with
H2 as part of the lease
• Claims 15% lower TCO than diesel trucks
• PowerCell supplying FC stacks
• Bosch will jointly develop powertrain systems, and
worked with Nikola to develop the truck’s “eAxle,”
which houses the electric motor, transmission and
power electronics
• Ryder System Inc. will serve as Nikola’s exclusive
provider for distribution and maintenance nationwide
800 ordered by Annheuser Busch, expected to be in service by end of 2020
Nikola/Nel to build 28 H2 stations to support this fleet
Nikola/Nel to build up to 700 H2 stations across the US by 2028
26Conclusions
Regulations
• Increased focus on urban air quality and global CO2 emissions continue
to drive towards Zero Emission Vehicles in the PC and CV sectors
• CO2 regulations continue to drive the uptake of EVs
Other Passenger Car Drivers
• Consumer concerns around EV infrastructure, vehicle price and range
− Charging infrastructure continues to develop at pace, but more to do!
− EV prices are dropping and ranges are increasing as new battery chemistries are
introduced
Commercial Vehicle Powertrain Evolution
• E-Bus widely present in China today, and on the way elsewhere
• LDT and MDT electrification starting – new CO2 HDD regs will increase
uptake
• Fuel Cells a very good fit for long-range cars and HDD trucks
• Technology and volume required to drive down FCEV costs
• Plans in pace to expand H2 fuelling infrastructure
27You can also read