REINZ & TONY ALEXANDER REAL ESTATE SURVEY - July 2021 - ISSN: 2703-2825 - Scoop
←
→
Page content transcription
If your browser does not render page correctly, please read the page content below

REINZ &
        TONY ALEXANDER
       REAL ESTATE SURVEY
                                                 July 2021

© REINZ - Real Estate Institute of New Zealand               ISSN: 2703-2825
IMPROVING PATTERN NOW EVIDENT
Welcome to the REINZ & Tony Alexander Real Estate reporting more people in attendance. But at a net 23%
Survey. This survey gathers together the views of licensed negative this proportion is the least negative in three
real estate agents all over New Zealand regarding how they months and as the graph here shows, an improving trend
are seeing conditions in the residential property market in appears to be in place.
their areas at the moment. We ask them how activity levels
are changing, what the views of first home buyers and This does not suggest that buyers are as yet returning to
investors are, and the factors which are affecting sentiment the market, just that their speed of withdrawal is slowing
of those two large groups. down as time passes since the March 23 tax policy change
announcement, and media continue to report market
Almost all of the indicators which we report on here have strength and rising prices around the country.
shown increasing strength or decreasing weakness in the
residential real estate market around New Zealand over the
past month. Some measures have now been improving for
two months, and some are back to levels of strength seen
late last year.
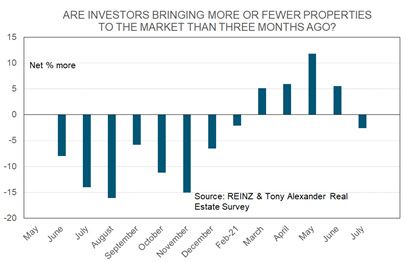
For instance, a net 3% of agents report that they are seeing
fewer investors stepping forward to sell their property. This
is the lowest reading since late-November and well away
from the net 12% who in late-April said they were seeing
more investors looking to sell. There is no wave of investor
selling underway.
That may help explain why this month a net 53% of agents
have reported that prices are rising in their area compared ARE MORE OR FEWER PEOPLE ATTENDING OPEN
with a net 32% last month. And a gross 60% now report HOMES?
that they are seeing buyer FOMO (fear of missing out)
compared with 51% late in May and 49% two months ago. As with agents reporting on numbers attending auctions,
so too here do we have evidence that numbers of buyers
There is still a high net 52% of agents saying that they are attending open homes continue to decline. A net 20%
seeing fewer investors in the market. So the policy changes reported fewer people attending open viewings than last
from the government and Reserve Bank have definitely month. However, again we can see that the extent of buyer
cooled the fervour of investors. But underlying strength withdrawal is easing, and an improving trend is visible in
in the market is continuing and we can even see evidence the following graph.
of easing worries that prices will fall. This may partly be
because almost a record gross 82% of agents are reporting
that buyers have concerns about a shortage of listings.
Each of the questions we ask agents is discussed below.
ARE MORE OR FEWER PEOPLE SHOWING UP AT
AUCTIONS?
There are more agents reporting that they are seeing
fewer people attending auctions as compared with those
2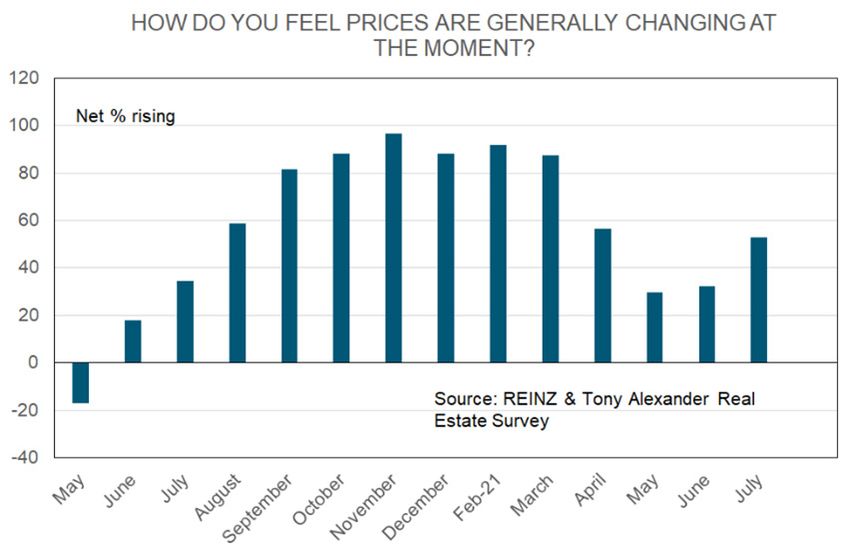
HOW DO YOU FEEL PRICES ARE GENERALLY FOMO = Fear of missing out
CHANGING AT THE MOMENT?
FOMO is starting to reappear in strength once again.
A net 53% of agents this month have reported that they are A gross 60% of licensed real estate agents around the
observing rising prices on average in their location. This is country have reported that they are seeing buyers
the strongest result since our late-March survey and is up displaying fears of missing out. As with the prices measure
from a net 32% observing rising prices at the end of May discussed just above, the extent of FOMO is down from
and 30% at the end of April. levels during the most frenzied period of activity. But an
upward trend, yet again, is in evidence.
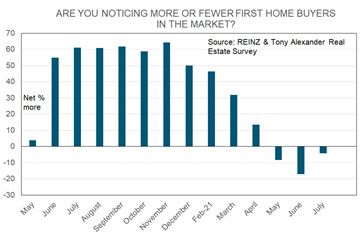
ARE YOU NOTICING MORE OR FEWER FIRST HOME
BUYERS IN THE MARKET?
A net 4% of agents in our latest survey have reported that
they are seeing fewer first home buyers in the market.
These mainly young people are continuing to exercise
caution as they take on board a great number of new
factors such as questions about the impact on investor
buying and selling of tax and LVR changes, and predictions
of rising interest rates.
This is the third indicator we report on and like the previous
two there is also clear evidence of an improving trend
after the initial shock engendered by the March 23 tax
announcement. The extent of price gains seen is not as
strong as during the residential real estate market’s most
frenzied period between August and March. But the result
gels with a growing volume of anecdotal reports suggesting
prices have not been dented downward by the combined
effects of the tax changes and return of Loan to Value Ratio
rules.
Note that on average between 2011 and 2014 when this
But the extent of their stepping back this month is the least
same question was asked in a previous similar survey, a
in three months and far better than the net 17% of agents
net 31% of agents responded that prices are rising. The
who one month ago reported seeing fewer first home
nationwide pace of price increase back over that 2011-14
buyers in the marketplace.
period of time averaged just over 5% per annum.
ARE YOU NOTICING MORE OR FEWER INVESTORS IN
DO YOU THINK FOMO IS IN PLAY FOR BUYERS?
THE MARKET?
A net 52% of responding agents have reported that they
are seeing fewer investors in the market. This is the most
negative of our numerous reported and behind-the-
scenes measures and unlike most of the indicators already
discussed this month, one cannot reasonably state that an
improving trend is yet in place.
In a number of surveys investors have indicated that they
have low levels of plans to purchase extra property in
the near future. But as the graph shows us, there was a
declining tendency to purchase already evident before the
government and Reserve Bank policy announcements.
3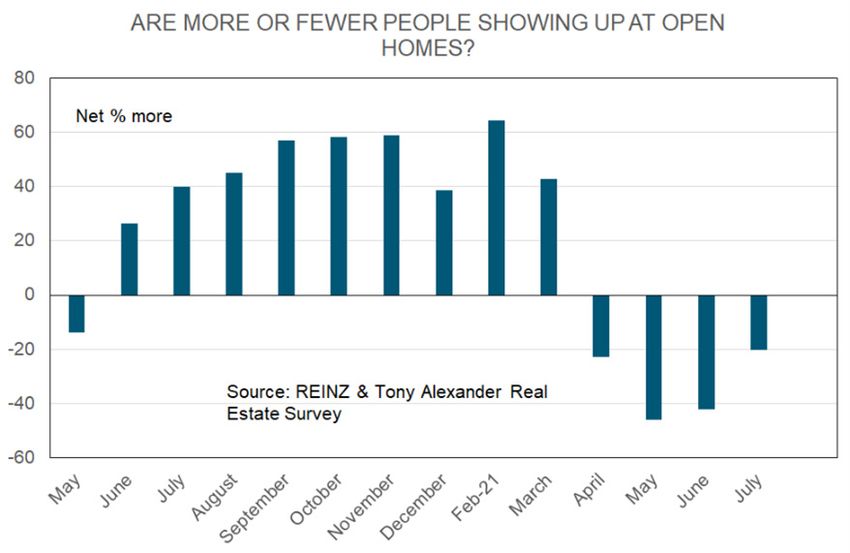
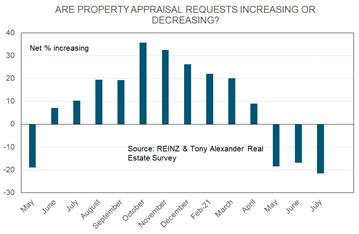
that they are seeing fewer requests for property appraisals.
                                                               There has been a fairly noticeable downward trend in this
                                                               gauge of potential market activity since late-October last
                                                               year and this is not necessarily good news for buyers.

Housing markets move in cycles and as we have seen this
past year, sometimes these cycles can be short and sharp.
The policy changes have accentuated an easing trend of
investor demand already in place and it will be interesting
to see if the improvements being registered in almost all      The downward trend and high net negative result suggest
of our other measures start soon to translate into more        that it would be unreasonable to expect much change in
investors dipping their toes back in the water.                the shortage of property listings in the near future. In fact,
                                                               as discussed below, a shortage of listings has increased as
ARE YOU RECEIVING MORE OR FEWER ENQUIRIES                      a concern for buyers.
FROM OFFSHORE?
                                                               WHAT ARE THE MAIN CONCERNS OF BUYERS?
Ahead of the March 23 tax policy announcement there
was no clear trend with regard to offshore interest in
the NZ residential property market. But following the
announcement there has been a noticeable stepping back
of offshore parties from our market.

                                                               Each month we produce two graphs showing the gross
                                                               proportion of agents citing each of six factors which
                                                               concern buyers the most. The first graph above tells us that
                                                               for two months in a row concerns have increased about
In contrast to all other indicators so far discussed in this   the shortage of listings. A gross 82% of agents now cite this
month’s report, there is no improvement registered in this     concern. This is only just below the record of 83% recorded
demand measure this past month. A net 41% of agents have       in late-January.
reported that they are seeing fewer offshore enquiries as
compared with a net 38% last month and 35% late in April.      The graph also shows that concerns buyers might have
                                                               about prices falling soon after they have made a purchase
ARE PROPERTY APPRAISAL REQUESTS INCREASING                     have declined. But they remain higher than before the
OR DECREASING?                                                 March 23 policy announcement.

A net 22% of responding agents this month have indicated       Our second graph tells us that concerns continue to

4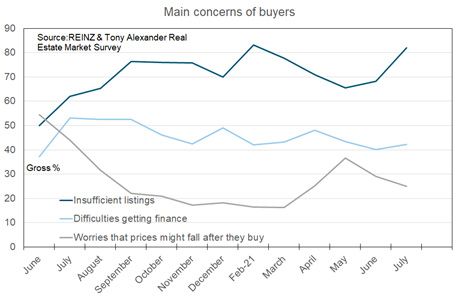
trend slowly downward regarding worries about jobs and           of perceptions of extra investors selling reported in the
incomes. Worries about high prices (requiring high debt)         three other surveys which we have undertaken since March
have risen slightly, while worries about interest rates going    23.
up have lifted. But at a gross 18% the proportion of agents
noting that buyers appear worried about interest rates           WHAT FACTORS APPEAR TO BE MOTIVATING
going up is the second lowest rated concern of the six           INVESTOR DEMAND?
which we track.
                                                                 There have been few changes this month in agent
                                                                 perceptions of the main factors motivating demand from
                                                                 investors. The highest-ranking factor remains interest rates
                                                                 according to a gross 33% of agents. Next comes Hopes of
                                                                 Finding a Bargain at 19%, then Investing for Retirement at
                                                                 17%.

ARE INVESTORS BRINGING MORE OR FEWER
PROPERTIES TO THE MARKET TO SELL THAN THREE
MONTHS AGO?

One strong proposition advanced following the March 23
announcement, including by investors themselves, was that        The proportion of responding agents noting that investor
a wave of investors would choose to sell their properties.       demand is falling has itself fallen – to 39% from a record
There is widespread anecdotal evidence of some investors         44% last month.
with larger portfolios choosing to sell their less desired
stock in order to reduce debt. There is also evidence of
some older investors choosing to sell and invest in other
assets now, slightly earlier than they had been planning.

But there is no clear evidence of a large wave of investors
selling. In fact, in our latest survey a net 3% of agents have
reported that they are seeing fewer investors bringing
properties forward to sell. This is the lowest result since
late-November last year and a more than complete reversal

5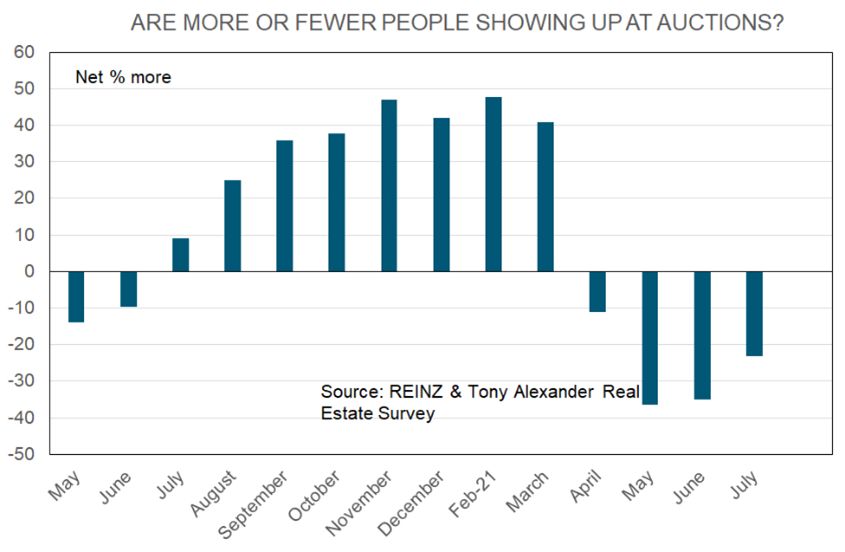
REGIONAL RESULTS

The following table breaks down answers to the numerical questions above by region. No results are presented for regions
with fewer than 7 responses as the sample size is too small for good statistical validity of results. Even for regions with
responses between 7 and 20, caution needs to be applied as results may prove quite volatile from one month to the next.
Nelson and Tasman results have been joined together as have those for Hawke’s Bay and Gisborne.

    A.   # of responses
    B.   Are property appraisal requests increasing or decreasing?                 G.      Are you noticing more or fewer first home buyers in the market?
    C.   Are more or fewer people showing up at auctions?                          H.      Are you noticing more or fewer investors in the market?
    D.   Are more or fewer people attending open homes?                            I.      Are you receiving more or fewer enquiries from offshore?
    E.   How do you feel prices are generally changing at the moment?              J.      Are investors bringing more or fewer properties to the market to sell
    F.   Do you think FOMO is in play for buyers?                                          than three months ago?

                               A           B              C               D         E              F              G             H               I             J
                              #obs      Appraisals     Auctions         Open H.   Prices         FOMO            FHBs         Invest.        O/seas      Inv.selling
 Northland                     21           -24           -10             10        71              71            -24           -57            -33            14
 Auckland                      99           -22           -33             -17      56               59             8            -43            -42            -3
 Waikato                       33           -12           -12             15       55               52            -21           -48            -67            -6
 Bay of Plenty                 21            14           -43             -5       38               71            33            -52            -48            14
 Hawke’s Bay                   16           -19           -50             -75       19              38            -56           -88            -63            13
 Taranaki                       4            0             0              0         0               0              0             0              0             0
 Manawatu-Wanganui             10            10           -10             -90       0               30            -50           -90            -20            22
 Wellington                    26           -15           -35             -73      54               62            -12           -50            -42            -8
 Nelson/Tasman                  9            33            0              22       67               78            -22           -67            -67           -33
 Marlborough                    7           -14           -14             -43       14              43            -14           -29            -14            14
 West Coast                     0            0             0              0         0               0              0             0              0             0
 Canterbury                    40           -68           -10             -10      70               75            20            -60            -45            -5
 Queenstown Lakes              10           -30           20              20       70               90            40             0             30            -10
 Otago exc Q’town              13           -15           -23             -54      54               23            -46           -62            -15           -46
 Southland                      4            0             0              0         0               0              0             0              0             0
 New Zealand                   315          -22           -23             -20      53               60             -4           -52            -41            -3

6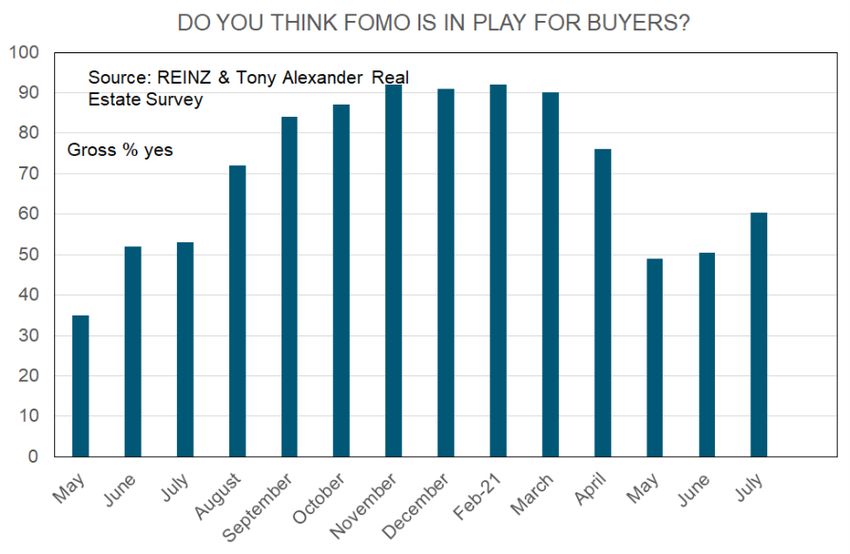
ISSN: 2703-2825

This publication is written by Tony Alexander, independent economist.
Subscribe here https://forms.gle/qW9avCbaSiKcTnBQA
To enquire about having me in as a speaker or for a webinar contact me at tony@tonyalexander.nz
Back issues at www.tonyalexander.nz

Tony’s Aim
To help Kiwis make better decisions for their businesses, investments, home purchases, and people by writing about the economy in
an easy to understand manner.

Feel free to pass on to friends and clients wanting independent economic commentary.

Disclaimer: This report is intended for general information purposes only. This report and the information contained herein is under no circumstances
intended to be used or considered as legal, financial or investment advice. The material in this report is obtained from various sources (including third
parties) and REINZ does not warrant the accuracy, reliability or completeness of the information provided in this report and does not accept liability for
any omissions, inaccuracies or losses incurred, either directly or indirectly, by any person arising from or in connection with the supply, use or misuse
of the whole or any part of this report. Any and all third party data or analysis in this report does not necessarily represent the views of REINZ. When
referring to this report or any information contained herein, you must cite REINZ as the source of the information. REINZ reserves the right to request
that you immediately withdraw from publication any document that fails to cite REINZ as the source.
You can also read