Rightmove House Price Index - The largest monthly sample of residential property prices
←
→
Page content transcription
If your browser does not render page correctly, please read the page content below
Rightmove
House Price Index
The largest monthly sample of
residential property prices

   January 2020
  National edition

   Copyright © 2020, Rightmove plc. Released 20th January. For media enquiries and interviews please contact
   the Rightmove press office: T | 020 7087 0605 M | 07894 255295 or E | amy.murphy@rightmove.co.uk

Under embargo for 00.01 hours, Monday 20 th January 2020

                           Post-election bounce as optimism returns
• 2.3% (+£6,785) surge in the price of property coming to market, the largest monthly rise we have
  ever recorded at this time of year
• Increased optimism also releasing pent-up demand as would-be buyers judge the election result
  gives a window of stability
     o Over 1.3 million buyer enquiries since election, up 15% compared to same period a year ago,
       suggesting an active spring market ahead
     o 7.4% growth in number of sales agreed, as early birds act quickly
     o Strong desire to get onto the housing ladder results in first-time buyers facing all-time highs in
       the price of properties with two bedrooms or fewer

                                                                National average asking prices

               Month                           Avg. asking price                Monthly change                    Annual change       Index

               January 2020                         £306,810                            2.3%                             2.7%        237.2

               December 2019                        £300,025                           -0.9%                             0.8%        231.9

                              National average asking prices by market sector (excluding Inner London)

              Sector                             January 2020                   December 2019                    Monthly change   Annual change

              First-time buyers                     £193,103                         £190,009                            1.6%         1.6%

              Second-steppers                       £275,947                         £271,394                            1.7%         1.9%

              Top of the ladder                     £538,221                         £522,095                            3.1%         3.9%

          £320,000

          £315,000

          £310,000

          £305,000

          £300,000

          £295,000

          £290,000

          £285,000
                      Jan-19 Feb-19 Mar-19 Apr-19 May-19 Jun-19                               Jul-19 Aug-19 Sep-19 Oct-19 Nov-19 Dec-19 Jan-20

           Rightmove measured 64,629 asking prices this month, circa 95% of the UK market. The properties were put on sale
           by estate agents from 8th December 2019 to 11th January 2020 and advertised on Rightmove.co.uk.

      2
                 Copyright © 2020, Rightmove plc. Released 20th January. For media enquiries and interviews please contact
                 the Rightmove press office: T | 020 7087 0605 M | 07894 255295 or E | amy.murphy@rightmove.co.uk
Overview
There has been a 2.3% (+£6,785) monthly surge in the average price of property coming to
market. Nearly 65,000 properties were marketed between the 8th December and the 11th
January, so most of them came to market after the 12th December election. Given that this
is the largest monthly rise we have ever recorded at this time of year, it would appear that
many of these new sellers are feeling a surge of optimism. Buyers are also optimistic, with a
jump in demand since the election. In the period from 13th December to 15th January,
immediately after the election, enquiries to estate agents were up by 15% compared to the
same period a year ago. This then led to a 7.4% increase in the number of sales agreed over
the same period.
Miles Shipside, Rightmove director and housing market analyst comments: “These
statistics seem to indicate that many buyers and sellers feel that the election result gives a
window of stability. The housing market dislikes uncertainty, and the unsettled political
outlook over the last three and a half years since the EU referendum caused some potential
home-movers to hesitate. There now seems to be a release of this pent-up demand, which
suggests we are in store for an active spring market. The early birds are on it, with over 1.3
million buyer enquiries to agents since the election, up 15% on the same period a year ago.
Some buyers are even further ahead and have snapped up a property already, with the
number of sales agreed up by 7.4% on this time last year.”
This month’s 2.3% rise in new seller asking prices is the largest that Rightmove has
recorded at this time of year since we started our House Price Index in 2002. The previous
highest January rise was the 2.2% recorded in January 2015. This has helped to push the
annual rate of increase to 2.7%, the highest level since July 2017.
Shipside notes: “Whilst a substantial rise is the norm in January, buoyed by the start of a
new year, this is the biggest new-year price surge that we have ever recorded. However it
is still a price-sensitive market, with stretched buyer affordability, so sellers should be
careful not to get carried away with their pricing and miss out on this window of increased
activity. One factor behind the upwards price pressure has been the shortage of property
coming to market in many areas of the country, with some would-be sellers postponing
their moves until they judge the outlook to be more certain. While there may well be more
twists and turns to come in the Brexit saga, there is now an opportunity for sellers to get
their property on the market for a spring move unaffected by Brexit deadlines. For those
who can afford to move and have been putting it off, now would appear to be a good time
to get a view from a local estate agent on their property’s value, and a mortgage quote for
the great fixed-rate deals that are currently available.”
One of the positive features of the market last year was the high percentage of first-time
buyers. However, their strong desire to get onto the housing ladder and the lack of supply
coming to market have now resulted in this year’s first-time buyers facing all-time highs in
the price of properties in their favoured sector. Newly-marketed properties with two
bedrooms or fewer now have a national average asking price of £193,103.
Shipside adds: “First-time-buyer activity has remained strong, buoyed by cheap interest
rates and the high costs of renting. The downside of this high demand is upwards price
pressure, with the average price of typical first-time-buyer property hitting a new record
high. However, the annual rate of increase remains fairly modest at 1.6%, less than the rate
of growth in average earnings, so affordability has actually improved a little for first-time
buyers.”
Miles Shipside, Rightmove director and housing market analyst says: “While there may well be
more twists and turns to come in the Brexit saga, there is now an opportunity for sellers to get
their property on the market for a spring move unaffected by Brexit deadlines. ”
3
Copyright © 2020, Rightmove plc. Released 20th January. For media enquiries and interviews please contact
the Rightmove press office: T | 020 7087 0605 M | 07894 255295 or E | amy.murphy@rightmove.co.ukAgents’ views
Mark Manning, managing director of Yorkshire-based Manning Stainton, said: “There is
renewed optimism because the political situation is seemingly settled; there’s a clear path
forward where before there was uncertainty. There is more confidence now and the market
is springing into life. Regionally, we have solid foundations, so our market is in a really good
position and we’re expecting our sales agreed figures to be very good. The signs are there
that the New Year is starting very quickly and we’ve come out of the blocks with quite a bit
of life. We didn’t really see much buyer urgency throughout 2019 and we desperately
needed new listings, but then in December just gone, we sold more properties than in any
other December since 2004, which was huge. We’ve now seen a 15% increase in home-
owners looking to sell and things are picking up.”
Marc von Grundherr, a director at Benham & Reeves in London, said: “We have absolutely
seen a post-election bounce, quite substantially actually. Things usually quieten down
before Christmas, but we had three times the number of offers in the last two weeks of
December than the first two weeks. People have been waiting for stability, and the moment
it arrived, confidence in the market has increased significantly. There has been a dramatic
Boris bounce, so to speak, with real optimism among buyers still getting good value. But it’s
also not a bad time for sellers as stock levels are still relatively low.”
4
Copyright © 2020, Rightmove plc. Released 20th January. For media enquiries and interviews please contact
the Rightmove press office: T | 020 7087 0605 M | 07894 255295 or E | amy.murphy@rightmove.co.ukAsking price trends
Five year asking price trend
£320,000
£310,000
£300,000
£290,000
£280,000
£270,000
£260,000
£250,000
£240,000
£230,000
£220,000
Jan-15 Jul-15 Jan-16 Jul-16 Jan-17 Jul-17 Jan-18 Jul-18 Jan-19 Jul-19 Jan-20
% monthly change in average asking prices
2.5% 2.3%
2.0%
1.5%
1.1%
1.0%
0.9%
0.7% 0.6%
0.5%
0.4% 0.4% 0.3%
0.0%
-0.5% -0.2% -0.2%
-1.0%
-1.0% -0.9%
-1.5% -1.3%
Jan-19 Feb-19 Mar-19 Apr-19 May-19 Jun-19 Jul-19 Aug-19 Sep-19 Oct-19 Nov-19 Dec-19 Jan-20
5
Copyright © 2020, Rightmove plc. Released 20th January. For media enquiries and interviews please contact
the Rightmove press office: T | 020 7087 0605 M | 07894 255295 or E | amy.murphy@rightmove.co.ukAverage time to sell and stock
Average 'time to secure a buyer' (no. of days) - National
85
80 77
75
70 71 71
70 67 67
64 63 64
65 62 62 62 62
60
55
50
45
40
Dec-18 Jan-19 Feb-19 Mar-19 Apr-19 May-19 Jun-19 Jul-19 Aug-19 Sep-19 Oct-19 Nov-19 Dec-19
Average stock per agent (including Under Offer/Sold STC)
60.0
53.3 54.4 53.9 53.6 52.8
51.9 50.2
49.7
50.0 46.3 47.8 46.9
45.9 44.8
40.0
30.0
20.0
10.0
0.0
Dec-18 Jan-19 Feb-19 Mar-19 Apr-19 May-19 Jun-19 Jul-19 Aug-19 Sep-19 Oct-19 Nov-19 Dec-19
6
Copyright © 2020, Rightmove plc. Released 20th January. For media enquiries and interviews please contact
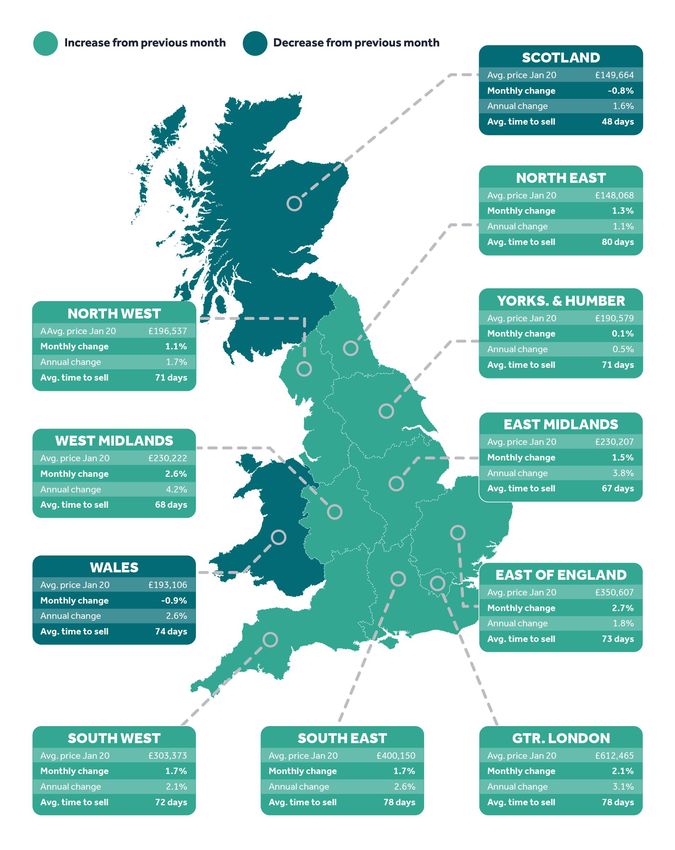
the Rightmove press office: T | 020 7087 0605 M | 07894 255295 or E | amy.murphy@rightmove.co.ukRegional trends
7
Copyright © 2020, Rightmove plc. Released 20th January. For media enquiries and interviews please contact
the Rightmove press office: T | 020 7087 0605 M | 07894 255295 or E | amy.murphy@rightmove.co.ukLondon trends
Average 'time to secure a buyer' (no. of days) - London
100
95
89
90
85 82 82
80
78 78
74 73
75 72
68 69 69 69
70 67
65
60
55
50
Dec-18 Jan-19 Feb-19 Mar-19 Apr-19 May-19 Jun-19 Jul-19 Aug-19 Sep-19 Oct-19 Nov-19 Dec-19
8
Copyright © 2020, Rightmove plc. Released 20th January. For media enquiries and interviews please contact
the Rightmove press office: T | 020 7087 0605 M | 07894 255295 or E | amy.murphy@rightmove.co.ukLondon trends
Borough data is based on a three-month rolling average and can be used as an indicator of overall
price trends in each borough over time. It is not directly comparable with the overall London
monthly figures.
Avg. price
Borough Monthly change Annual change
January 2020
Hounslow £531,759 1.6% 4.0%
Tower Hamlets £598,751 1.3% 3.8%
Barnet £622,784 -2.5% 2.9%
Islington £754,755 0.1% 2.7%
Lambeth £628,249 0.0% 2.7%
Sutton £460,274 -0.2% 2.3%
Newham £414,064 0.7% 1.3%
Southwark £632,388 -2.5% 1.2%
Waltham Forest £480,643 0.3% 1.2%
Barking and Dagenham £312,010 -1.1% 0.7%
Harrow £548,571 0.5% 0.6%
Hackney £622,468 0.0% 0.4%
Lewisham £458,302 0.1% 0.4%
Havering £405,981 -0.2% 0.3%
Croydon £423,341 -0.9% 0.2%
Bromley £533,716 -0.1% 0.1%
Westminster £1,447,028 1.8% 0.1%
Redbridge £448,553 -0.7% 0.0%
Hammersmith and Fulham £910,063 -0.5% 0.0%
Bexley £402,823 -1.7% -0.1%
Greenwich £431,318 -0.5% -0.2%
Kingston upon Thames £595,469 1.8% -0.2%
Wandsworth £757,972 0.0% -0.5%
Brent £557,527 0.9% -0.8%
Ealing £540,036 -1.0% -0.8%
Haringey £576,675 -1.9% -1.5%
Hillingdon £479,485 -0.1% -1.8%
Enfield £443,516 0.1% -2.1%
Merton £600,482 -3.5% -2.5%
Kensington and Chelsea £1,502,349 -3.7% -4.3%
Richmond upon Thames £788,004 -2.4% -4.5%
Camden £968,276 -1.6% -4.7%
9
Copyright © 2020, Rightmove plc. Released 20th January. For media enquiries and interviews please contact
the Rightmove press office: T | 020 7087 0605 M | 07894 255295 or E | amy.murphy@rightmove.co.ukEditor’s notes
About the Index:
Buyer enquiries are for the period of 13th Dec 2019 to 15th Jan 2020 vs 14th Dec 2018 to 16th Jan 2019.
The Rightmove House Price Index methodology was updated in January 2018. The report now includes data for
Scotland and a number of measures have been refined. The stock per agent figure now calculates the average based
on the number of properties an agent has on Rightmove each day across the month, rather than the average of the
total number of properties each agent advertised in the month. London asking prices are now broken down into travel
zones. For the purpose of historical comparisons, the historical figures have been restated based on the new
methodology.
The Index includes asking price breakdowns in the housing market to offer trends at three different sectors of the
market: first-time buyer, second-stepper and top of the ladder. Inner London prices have been excluded from this
categorisation as the normal housing ladder is not really applicable.
Advertising property for over 90% of all UK estate agents, Rightmove is in a unique position to identify any immediate
changes in the market. Rightmove’s House Price Index is compiled from the asking prices of properties coming onto
the market via over 13,000 estate agency branches listing on Rightmove.co.uk. Rather than being a survey of opinions
as with some other indices, it is produced from factual data of actual asking prices of properties currently on the
market. The sample includes up to 200,000 homes each month – representing circa 95% of the market, the largest and
most up-to-date monthly sample of any house price indicator in the UK. The Index differs from other house price
indicators in that it reflects asking prices when properties first come onto the market, rather than those recorded by
lenders during the mortgage application process or final sales prices reported to the Land Registry. In essence,
Rightmove’s Index measures prices at the very beginning of the home buying and selling process while other indices
measure prices at points later in the process. Having a large sample size and being very up-to-date, the Rightmove
Index has established itself as a reliable indicator of current and future trends in the housing market.
Rightmove measured 64,629 asking prices this month, circa 95% of the UK market. The properties were put on sale by
estate agents from 8th December 2019 to 11th January 2020 and advertised on Rightmove.co.uk.
Market sectors explained:
First-time buyer: This figure represents the typical property a first-time buyer would purchase, covering all two bed
properties and smaller that come to market (houses and flats).
Second-stepper: This figure represents the typical property of a person moving from their first home, covering all
three and four bed properties that come to market (houses and flats) excluding four bed detached houses.
Top of the ladder: This figure represents asking prices at the top end of the market, covering all five bed properties
and above (houses and flats), as well as four bed detached houses.
About Rightmove.co.uk:
Rightmove.co.uk is the UK’s leading property website, displaying details of homes for sale or rent to the largest online
audience. It is consistently ranked the number one property website in the UK (source: Experian Hitwise). It has circa
95% of all properties for sale and at any time displays a stock of over one million properties to buy or rent. The
Rightmove.co.uk site attracts nearly 141 million visits from home movers each month with time on site averaging 1.1
billion minutes per month (Rightmove data, July 2019).
10
Copyright © 2020, Rightmove plc. Released 20th January. For media enquiries and interviews please contact
the Rightmove press office: T | 020 7087 0605 M | 07894 255295 or E | amy.murphy@rightmove.co.ukYou can also read