Monthly Performance Measures - January 2021 - State of Michigan
←
→
Page content transcription
If your browser does not render page correctly, please read the page content below
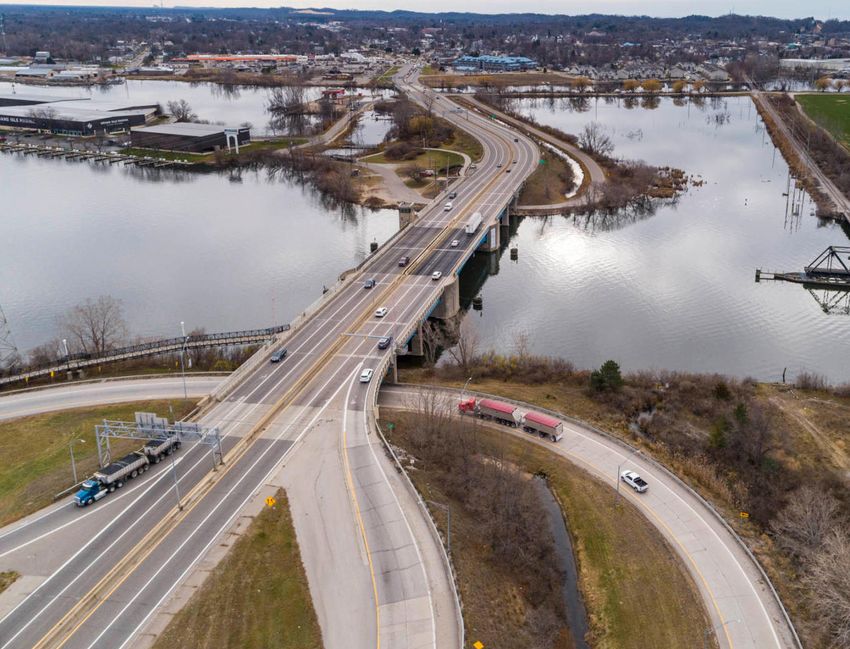
WEST MICHIGAN
                                                                                 TRANSPORTATION
                                                                               OPERATIONS CENTER
           Monthly                                                                www.Michigan.gov/WMTOC
                                                                                                   616-451-8329

       Performance
          Measures
                                       January 2021

                                                                                      Allison Balogh, P.E.
                                                                                      WMTOC Engineer
                                                                                      1420 Front Avenue NW
                                                                                      Grand Rapids, MI 49504
                                                                                      BaloghA@Michigan.gov

MDOT’S MISSION
Providing the highest quality integrated transportation services for economic benefit and improved quality of life.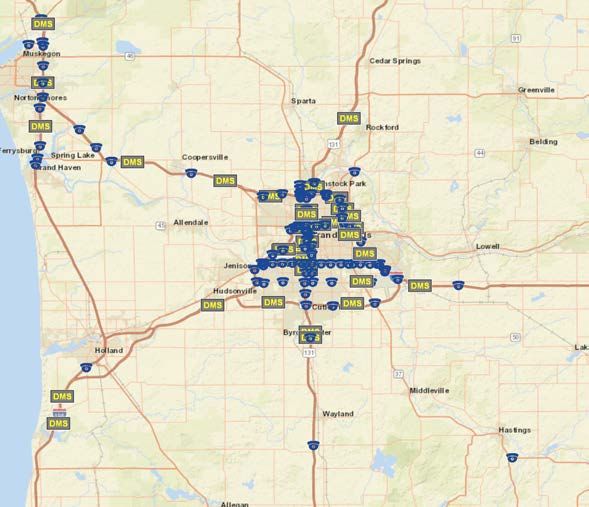
WMTOC
                                                                                                                       Page 2
                                                                                                                   January 2021

                                                              West Michigan Traffic Operations Center
                                                                        The WMTOC focuses on MDOT’s goals of incident
                                                                        management, crash reduction, customer information, and
                                                                        congestion reduction. The Traffic Operations Centers (TOC)
                     Statewide TOC                                      provide motorists and businesses with real-time traffic
                                                                        information, and partner with emergency response agencies to
                                                                        provide improved response services to traffic crashes – saving
                                                                        lives, time, and money.
                                                                        The WMTOC has camera/device coverage on approximately
                                                                        76 freeway-miles and 28 non-freeway trunkline-miles in the
                                                                        greater Grand Rapids, Grand Haven, and Muskegon areas.
                                            Statewide TOC

                          West Michigan TOC
                                                                             ¤ Blue Water Bridge

                                                                     Southeast Michigan TOC

   May 2019
January 2021
Recognizing Our New Staff
Joshua Holwerda

Josh joined the WMTOC team as a control room operator in November 2020. Josh has an international
development degree from Calvin where he attended and completed seminary. Josh pastored for a few
years and has done extensive work with addiction and rehabilitation services; however, he was looking for
a new career opportunity, which brought him to the WMTOC. In his spare time, Josh enjoys gardening,
spending time with his two children (David and Evalyn), and has begun to cook many tasty vegan dishes.

Jyson Beasley

Prefering to be called Jason, he joined the WMTOC team as a control room operator in November 2020.
Jason has experience in warehousing and custodial industries over the last 10 years. Jason accomplished
his goals of excelling in management and team organization to become a well-rounded asset for Lacks
Enterprises and Grand Rapids Community College. Jason has two wonderful children (LeAirah and Logan),
is an avid tea drinker, and aims to grow in traffic management and contribute in any way to make the
WMTOC team successful. When he is not at work, he is spending time with his children, indulging in
historical books, enjoying the great outdoors, and watching sports.
Control Room Activity
Page 3
January 2021
Events by Type 120
Crash
Figure 1 shows events by type.
Incidents Disabled
Event: An occurrence within the transportation Vehicle
7
operations center (TOC) coverage area that requires
action or tracking. Debris 1
Unplanned Events: An incident or other uncontrollable Planned Construction 11
event that directly affects a Michigan Department of
Transportation (MDOT) roadway. Unplanned events
Unplanned Congestion 3
include Incidents (crashes, disabled vehicles and debris in
the roadway) and other events (weather, congestion, and
Weather 9
unclassified).
Unscheduled
Planned Events: Events that are scheduled. These Amber Alert 1
include construction, maintenance, and special events.
0 20 40 60 80 100 120
Of the 152 total events this month, 128 (84 percent)
were classified as Incidents. Figure 1
This month there were 1,247 auto responses. Auto response events are created
automatically based on slower than normal speeds for a period of time. Speeds
are detected by several sources and the traffic management software sends pre- CAD
32
determined messages to dynamic message signs (DMS) and portable changeable
message signs to alert motorists about traffic conditions ahead.
Incidents by Detection Source ITS Devices
23
DETECTION Phone/E-mail
SOURCES 17
Figure 2 provides information on detection sources.
Control room operators (CRO) rely on various sources to detect incidents that
occur along the freeways. Noting the source ensures that the incident was
detected by a reliable source and provides insight on which sources provide the
most information. Media Scanners
0 54
Map
2
Figure 2
Communication DTMB, 27
Media, 2 National Weather
Service, 68
Figure 3 shows communication managed by CROs Other, 27
Traffic Operations,
displayed by type. 510
WMTOC tracks all incoming and outgoing
communications to the control room. This includes phone
Othe
calls, e-mails sent and received, and notifications sent to
MSP, 1,123
stakeholders.
r,
MDOT
56
Construction,
MDOT,
CROs managed 2,509 communications this month. Of Weather, 728
58
those communications, 2,070 (83 percent) were e-mails, 65 MDOT
Maintenance,
including notifications, and 439 (17 percent) were Incident 108
phone calls. Police/
Notification
E-mails, Other, 17
Fire,
The WMTOC communicates most with police and fire 1,536
124
County Road
agencies throughout the region. This includes Michigan Commission, 42
State Police, county 911 centers, and the City of Grand
Rapids police/fire dispatch.
Incident Notification
E-mails, 1294
County 911
Dispatch, 145
Grand Rapids
Dispatch, 268
Figure 3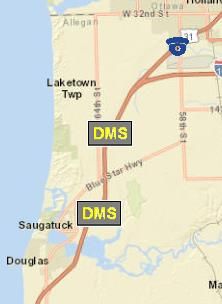
Traveler Information
Page 4
January 2021
Device Locations
West Michigan TOC Device Map DMS Messages by Type
There were 104 “unique messages” displayed throughout the
intelligent transportation systems network this month, as shown
in Figure 4.
“Unique messages” include incidents, special events, congestion,
weather, construction, or AMBER alerts.
Travel time messages are routinely displayed when unique
messages are not active. Travel times are updated every three
minutes.
Unique Messages
Construction Weather Congestion
14 13 16
Incident AMBER Alert PSA
51 1 9
Figure 4
Number of Percent
Device Type
Devices Available
Cameras 84 94%
Field Device Availability DMS 36 92%
The WMTOC tracks the availability of all system devices so that timely
Microwave vehicle
maintenance can occur. Reliability of the devices ensures that the operators 140 43%
detection system
have tools available to accurately provide traffic conditions to the motoring
public. Table 1 shows field device availability for this month. Table 1
15
Winter Weather Advisory Activities
The WMTOC tracked all incidents of winter weather advisory events that 10
Advisory Days
occurred in each of the Grand Region counties. Table 2 shows the summary
of winter weather advisory incidents. Figure 5 shows the total number of 6
incidents and weather advisory days by county. 5 5 5 5 5
5 4 4 4 4
3 3 3
December January
Winter Weather Advisories Events
2020 2021
0
The number of incidents that have Incidents 3 0 0 11 0 0 0 1 1 0 0 0 1
20 17
occurred during winter weather advisories
Ba n
us lm
Ot la
a
a
M on
on a
O c go
Os a
nt
M e
rr y
Ne gon
ga
w
ni
M ost
n
k
o
M tca
Ke
La
as
ea
ta
ay
ce
Io
le
The percentage of total incidents for the
ke
ec
w
Al
15% 14%
month
Advisory Days Incidents
Table 2 Figure 5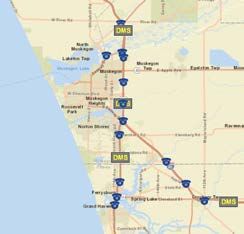
Incident Management
Page 5
January 2021
Incidents on Key Routes
Table 3 indicates that US-131 had the highest total number of incidents and the highest per mile rate in January. M-11 had the longest
incident duration for the month. The table shows incidents for high-volume roadways in the Grand Region.
January 2021 January 2020 Previous 12-month Avg.
Incidents
Incidents
Incidents
Incidents
Incidents
Incidents
Duration
Duration
Duration
Average
Average
Average
Per Mile
Per Mile
Per Mile
Route Miles
Total
Total
Total
I-96, US-31 to M-50 52 19 0.4 0:44 18 0.3 0:38 15.9 0.3 0:50
I-196, Blue Star Hwy to I-96 40 16 0.4 0:39 19 0.5 0:52 17.2 0.4 0:49
US-131, 84th St to Rockford Rest Area 24.5 65 2.7 0:34 80 3.3 0:33 64.8 2.6 0:39
US-31, I-96 to M-120 8 6 0.3 0:31 7 0.4 0:52 5.6 0.3 0:59
M-6, I-196 to I-96 19 6 0.3 0:55 9 0.5 0:58 5.0 0.3 0:54
M-11, I-196 to I-96 11.5 2 0.2 1:02 3 0.3 0:18 1.5 0.1 0:34
M-37/M-44, M-6 to West River Dr 15.5 3 0.2 0:27 5 0.3 0:17 5.7 0.4 1:04
Table 3
Table Key Increase No Change Decrease Data is compared to the same month of the previous year.
January
128
2021
Total Unplanned Incidents
101
There were 128 total unplanned incidents this month;
79 percent of these were high-impact incidents.
January
A high-impact incident is one that results in a total 116 Month Total
2020
freeway closure, a ramp closure, or a lane closure.
High Impact
Incident information is shown in Figure 6. 94
12-Month
124
Previous
Average
92
0 30 60 90 120 150
Figure 6
High-Impact Incidents
January January Previous 12 -
Seventy-nine percent of high-impact incidents Closure Type
2021 2020 Month Avg.
this month occurred along US-131. For most high-
impact incidents, CROs provide e-mail notifications Freeway Closure 17 9 13.9
to stakeholders in the affected area. The notification Lane Closure 79 85 78.4
includes the location of the incident, the degree of Ramp Closure 5 5 3.9
closure, the reason for the closure, and any other
pertinent information related to traffic operations. Total 101 99 96.3
See Table 4. Table 4
Work Zone-Related Events
There were 0 incidents identified by operators as being related to work zones during this month.
Incident Management
                                                                                                                                                                                 Page 6
                                                                                                                                                                          January 2021

Top Duration Incidents
The longest-duration incident this month occurred on US-10 at 5 Mile Road, which lasted 3 hours, 16 minutes. The average incident
duration for January was 44 minutes. See Table 5.

              Location                                                                                 Date                       Duration           Details
              US-10 at 5 Mile Road                                                                 Jan. 15                          3:16             Incident
              US-131 after I-196                                                                   Jan. 13                          3:14             Incident
              US-131 after 110th Avenue                                                            Jan. 10                          2:39             Incident
              I-96 at M-37/Alpine Avenue                                                           Jan. 28                          1:52             Incident
              I-96 after M-50                                                                      Jan. 6                           1:45             Incident
                                                                                                 Table 5
                                                                                               Table 4
Total Incidents per Weekday                                                                                                                                               Number of Incidents

Hour                        15                                                            15
                                                                                                                                                                          Prev. 12 Month Avg.

The WMTOC operates 24 hours per day, 7 days per week.
The WMTOC is staffed locally during peak traffic hours,
                                                     10                                   10
typically 6 a.m. to 8 p.m. Operations are transferred to
the Statewide Transportation Operations Center during
                                                       5                                   5
off-peak hours.
During the month of January, 5 p.m. had the largest
hourly number of incidents. Historically, 3 p.m. has 0                                     0
                                                                                                 6      7    8    9           10   11     12   1      2       3    4    5         6    7    8
the greatest number of incidents in the Grand Region.                                           a.m.   a.m. a.m. a.m.        a.m. a.m.   p.m. p.m.   p.m.    p.m. p.m. p.m.      p.m. p.m. p.m.

Figure 7 shows incidents for weekdays for this month.                                                                                Figure 7

Incident and Roadway Clearance Times
MDOT shares a goal with local first responders to clear incidents from the roadway as quickly as possible. Reducing overall incident
clearance times limits the risk to travelers and responders on scene. Effective response and clearance improves safety for motorists as well
as first responders. MDOT’s goal is to minimize delays caused by incidents as well as the occurrences of secondary incidents.
Roadway clearance time: The time between the awareness of an incident and confirmation that all lanes are open to traffic.
Incident clearance time: The time between the awareness of an incident and when all involved vehicles are removed from the scene.
Figure 8 shows a breakdown of the number of incidents in each time to clear bracket. Figure 9 illustrates the average roadway and
incident clearance times for the month.
                                                                                                                                                                                          Incident
                                                                                                                                                              0:44                        Clearance
                                                                                                         JANUARY
JANUARY

                                                                                                           2021

                   ROADWAY          55                           57                  6 10
  2021

                                                                                                                                                                                          Roadway
                                                                                                                                                            0:41                          Clearance
                   INCIDENT       43                47                36
                                                                                                                                                                     0:50
12-MONTH JANUARY

                   ROADWAY          52                  36            12        16
                                                                                                          JANUARY
           2020

                                                                                                            2020

                   INCIDENT        46                  34            9 13                                                                                          0:48

                   ROADWAY          49                      46             12        17
                                                                                                         12-MONTH AVG.
 AVERAGE

                                                                                                                                                                     0:51
                                                                                                            PREVIOUS

                   INCIDENT        38             36             9    14
                                                                                                                                                                     0:51
                   0-29 Minutes   30-59 Minutes     60-119 Minutes              120+ Minutes
                                                                                                                         0   10         20         30         40            50           60
                                                                                                                                     Clearance Time (minutes)
                                         Figure 8                                                                                               Figure 9

Secondary Crashes
Out of the 120 total crashes this month, 0 percent were Secondary Crashes as observed by WMTOC CROs.
Freeway Hot Spots
Page 7
January 2021
Crash Hot Spot and Most Used DMS Activity
Figure 10 shows areas where the greatest number of crashes occurred in the reported month. The shading starts with blue for fewer
crashes, then transitions to purple for a moderate number of crashes, and finally to red for the highest number of crashes based on the
total crashes that occurred. The top five most used DMS are also depicted on the map. The direct correlation can be seen between the
areas of most crashes to DMS utilization.
37
Rockford
131
44
Coopersville
131
44
Comstock Park
K ent
96
37 US131S @ West River
Walker
US131S @ Pearl
Allendale
Grand Rapids
96
Ottawa US131N @ Franklin
I-196E @ Eastern Lowell
Grandville
Jenison
Hudsonville
6 Cutlerville
196
121 Byron Center
US131S @ 92nd
Legend
Top Five DMS by Message Quantity
Figure 10You can also read