HELLA Investor Update - H1 FY 2019/20 Dr. Rolf Breidenbach, CEO Bernard Schäferbarthold, CFO

Page created by Shane Morales
 
CONTINUE READING
HELLA Investor Update - H1 FY 2019/20 Dr. Rolf Breidenbach, CEO Bernard Schäferbarthold, CFO
Information Classification: Internal

                        HELLA Investor Update
                        H1 FY 2019/20
                        Conference Call on January 14, 2020

                        Dr. Rolf Breidenbach, CEO
                        Bernard Schäferbarthold, CFO

HF-7761DE_C (2012-12)
HELLA Investor Update - H1 FY 2019/20 Dr. Rolf Breidenbach, CEO Bernard Schäferbarthold, CFO
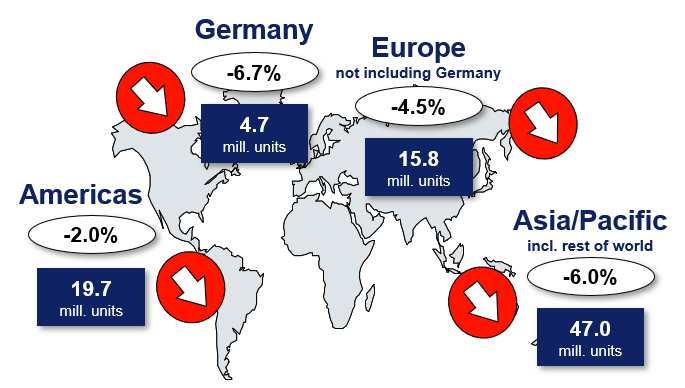
Information Classification: Internal

Disclaimer

This document was prepared with reasonable care. However, no responsibility can be assumed for
the correctness of the provided information. In addition, this document contains summary
information only and does not purport to be comprehensive and is not intended to be (and should
not be construed as) a basis of any analysis or other evaluation. No representation or warranty
(express or implied) is made as to, and no reliance should be placed on, any information, including
projections, targets, estimates and opinions contained herein.

This document may contain forward-looking statements and information on the markets in which
the HELLA Group is active as well as on the business development of the HELLA Group. These
statements are based on various assumptions relating, for example, to the development of the
economies of individual countries, and in particular of the automotive industry. Various known and
unknown risks, uncertainties and other factors (including those discussed in HELLA’s public
reports) could lead to material differences between the actual future results, financial situation,
development or performance of the HELLA Group and/or relevant markets and the statements and
estimates given here. We do not update forward-looking statements and estimates retrospectively.
Such statements and estimates are valid on the date of publication and can be superseded.

This document contains an English translation of the accounts of the Company and its subsidiaries.
In the event of a discrepancy between the English translation herein and the official German
version of such accounts, the official German version is the legal valid and binding version of the
accounts and shall prevail.

 2                                        HELLA Investor Update H1 FY 2019/20, Conference Call on January 14, 2020
HELLA Investor Update - H1 FY 2019/20 Dr. Rolf Breidenbach, CEO Bernard Schäferbarthold, CFO
Information Classification: Internal

HELLA Investor Update H1 FY 2019/20
Outline

■ HELLA Financial Highlights H1 FY 2019/20

■ HELLA Financial Results H1 FY 2019/20

■ Outlook

■ Q&A

 3                                HELLA Investor Update H1 FY 2019/20, Conference Call on January 14, 2020
Information Classification: Internal

Expected negative sales and EBIT development in H1 FY 2019/20
Financial Highlights H1 FY 2019/20

                                  ■ HELLA Group currency and portfolio adjusted sales declined by
         Sales                      3.2% YoY to 3.3 bill. EUR

                                  ■ Adj. Gross Profit margin at 25.9% (-1.1%-points YoY)
   Profitability                  ■ Adj. EBIT -38.9 mill. EUR (-13.1% YoY) at 257 mill. EUR
                                  ■ Adjusted EBIT margin -1.0%-points to 7.8%

                                  ■ Adjusted Free Cash Flow from operating activities increased by
      Liquidity
                                    19 mill. EUR (+17.5% YoY) to 130 mill. EUR

Note: Adjusted P&L and Balance Sheet figures for FY 18/19 and FY 19/20 exclude items from the Wholesale distribution since closing of the transactions.
Adjustments of profitability figures for all years include restructuring expenses. For details see financial report.
Please note that where sums and percentages in the presentation have been rounded, differences may arise as a result of commercial rounding.

  4                                                                HELLA Investor Update H1 FY 2019/20, Conference Call on January 14, 2020
Information Classification: Internal

Automotive still outperforms LVP on a global basis
Financial Highlights H1 FY 2019/20
HELLA Automotive external sales by region (in EUR millions)

Global                                                        Europe                                                   North & South America                                    Asia & RoW
                                2.841           2.795                                          1,758                                                                      672                                    481            484
             2.623                                                             1,629                           1,639                                                                              462
                                                               1,560                                                                                      602
 2.406                                  -1.6%                                                                                                                                     404                                   +0.5%
                                                                                       +8.0%           -6.8%                              533                                                            +4.2%
                        +8.3%                                          +4.4%                                                                                     +11.7%
         +9.0%                                                                                                             442                                                           +14.3%
                                                                                                                                                 +13.0%
                                                                                                                                 +20.4%
                 537                                    646

H1 16/17    H1 17/18       H1 18/19        H1 19/20           H1 16/17    H1 17/18        H1 18/19         H1 19/20     H1 16/17     H1 17/18        H1 18/19        H1 19/20   H1 16/17     H1 17/18       H1 18/19       H1 19/20

Light vehicle production (in million units)
Global                                                        Europe                                                   North & South America                                    Asia & RoW
                 47.9                                                          11.1                                       10.6                                                                    26.6
  47.1
                                46.7                                                                                                                      10.4                    25.9                           25.7
                                                                10.7                           10.7                                       10.2
         +1.6%
                        -2.5%                                                                                                                                                            +3.0%           -3.5%
                                                                       +2.9%           -3.4%                                     -3.1%           +1.2%
                                                43.9                                                           10.2                                                       9.9                                                   23.8
                                        -6.1%                                                          -4.2%                                                     -4.8%                                                  -7.3%

H1 16/17    H1 17/18       H1 18/19        H1 19/20           H1 16/17     H1 17/18        H1 18/19        H1 19/20     H1 16/17     H1 17/18        H1 18/19        H1 19/20   H1 16/17     H1 17/18       H1 18/19       H1 19/20

HELLA Automotive growth vs. market (Light vehicle production growth):

         +7.4%           +10.8%          +4.4%                         +1.5%       +11.3%          -2.6%                         +23.4%           +11.7% +16.5%                          +11.3%          +7.7%          +7.9%

 Source: HELLA; IHS (as of December 2019)

   5                                                                                                      HELLA Investor Update H1 FY 2019/20, Conference Call on January 14, 2020
Information Classification: Internal

HELLA Investor Update H1 FY 2019/20
Outline

■ HELLA Financial Highlights H1 FY 2019/20

■ HELLA Financial Results H1 FY 2019/20

■ Outlook

■ Q&A

 6                                HELLA Investor Update H1 FY 2019/20, Conference Call on January 14, 2020
Information Classification: Internal

HELLA top line with expected decline in H1 FY 19/20
Financial Results H1 FY 2019/20

HELLA Group sales (in EUR millions)                                                     Comment

                                                                                         ■ Currency (+0.9pp) and portfolio adjusted
       3,550
                                                                                           (-4.4pp) decrease of HELLA Group at 3.2%
        158                                                                                to 3.283 mill. EUR
                                                                                -6.7%
                                                                                         ■ Reported sales of HELLA Group
                            -109      -3.2%                           3,313                declined by 6.7% (decreased by 237 mill.
                                                   30                                      EUR to 3.313 mill. EUR)
                                                                                             − Automotive -1.6% to 2.817 mill. EUR. Strong
       3,392                                                          3,283                    underlying demand especially for Electronics,
                                                                                               but fewer and slower ramp-ups with lower call-
                                                                                               off rates
                                                                                             − Aftermarket -3.8% to 323 mill. EUR, lower
    H1 18/19            adj. growth           FX effect             H1 19/20                   demand in South-West Europe and Middle
                                                                                               East as well as for Workshop products
                                                                                             − Special Applications -10.2% to 183 mill. EUR
         Wholesale sales
                                                                                               due to weaker demand in Agriculture,
         Currency and portfolio adjusted sales
                                                                                               Construction as well as Bus and Trailer
Note: Reported sales without consideration of currency and portfolio effects

   7                                                                       HELLA Investor Update H1 FY 2019/20, Conference Call on January 14, 2020
Information Classification: Internal

Adj. GPM decreased despite material and personnel cost savings
due to lower growth dynamics and volatility in call offs
Financial results H1 FY 2019/20
Adj. Gross Profit                                                                       Highlights
EUR millions                                                                              ■ Adj. Gross Profit decreased by 58
                                              915
       855                  842                                  857                        mill. EUR (-6.4%) to 857 mill. EUR
                  -13                  +73              -58                                   − Automotive -6.9% to 666 mill. EUR
                                                                                              − Aftermarket +1.8% to 121 mill. EUR
                                                                                              − Special Applications -12.4% to
                                                                                                69 mill. EUR

 H1 FY 16/17*           H1 FY 17/18       H1 FY 18/19         H1 FY 19/20

Adj. Gross Profit margin                                                                Highlights
% sales                                                                                  ■ Adj. Gross Profit margin decreased
                                              27.0                                         by 1.1%-points to 25.9%
       26.7                26.6
                                                                                             − Decreased GPM Automotive (-1.3pp):
                 -0.1                  +0.4                     25.9
                                                                                               missing economies of scale due to lower
                                                     -1.1                                      volumes and high volatilities
                                                                                             − increased GPM in Aftermarket (+2.1pp) due
                                                                                               to positive mix effects and cost optimization
 H1 FY 16/17*          H1 FY 17/18        H1 FY 18/19     H1 FY 19/20                        − lower GPM in SA (-1.0pp) due to negative
                                                                                               sales and mix effects despite material &
 *Not restated for Wholesale effects
                                                                                               personal cost efficiencies
   8                                                                HELLA Investor Update H1 FY 2019/20, Conference Call on January 14, 2020
Information Classification: Internal

Continuous high R&D expenses to prepare new customer projects
and develop future technologies
Financial results H1 FY 2019/20
Adj. R&D expenses                                                                    Highlights
EUR millions
                                                                                       ■ Adj. absolute R&D expenses
                                              315          330                           increased by 15 mill. EUR (+4.7%
                           285
      261              3.4%                         +15                                  YoY) to 330 mill. EUR; main
                                       +31                                               drivers:
                +24
                                                                                        − Preparation of new customer
                                                                                          projects
                                                                                        − Development of new future
                                                                                          technologies in accelerating
H1 FY 16/17*          H1 FY 17/18         H1 FY 18/19   H1 FY 19/20                       industry change
Adj. R&D expenses ratio                                                             Highlights
% sales
                                              9.3
                                                           10.0                       ■ H1 19/20 ratio +0.7pp to 10.0%
                           9.0
      8.1                                                                               due to over-proportional increase
                                       +0.3         +0.7
                +0.9                                                                    in absolute R&D expenses
                      7.8%

H1 FY 16/17*          H1 FY 17/18         H1 FY 18/19   H1 FY 19/20
*Not restated for Wholesale effects.

  9                                                           HELLA Investor Update H1 FY 2019/20, Conference Call on January 14, 2020
Information Classification: Internal

SG&A costs declining due to continuous cost savings
Financial results H1 FY 2019/20

Adj. SG&A expenses                                                                     Highlights
EUR millions                                                                           ■ Adj. SG&A costs decreased (-35
       359                                                                               mill. EUR, -10.5%) to 295 mill. EUR
                                             329
                       3.4%
                           300                               295                        − Decrease in logistic costs (-26 mill.
                 -58                   +29             -35                                EUR) with realized savings
                                                                                          potentials
                                                                                        − Lower admin expenses (-6 mill.
                                                                                          EUR) with stringent saving programs
                                                                                        − Increased other adjusted income
 H1 FY 16/17*         H1 FY 17/18         H1 FY 18/19     H1 FY 19/20                     (+3 mill. EUR)
Adj. SG&A expenses ratio                                                                Highlights
% sales
     11.2
                                                                                          ■ Adj. SG&A ratio decreased
                          9.5                9.7                                            (-0.8pp) to 8.9%
       8.1%                                                  8.9
               -1.7                +0.2            -0.8                                   ■ Over-proportional decrease in
                       7.8%
                                                                                            absolute SG&A with savings
                                                                                            programs and lower logistic costs

H1 FY 16/17*         H1 FY 17/18         H1 FY 18/19     H1 FY 19/20
*Not restated for Wholesale effects.

  10                                                               HELLA Investor Update H1 FY 2019/20, Conference Call on January 14, 2020
Information Classification: Internal

Continuous focus on structural cost measures, declining
headcount development
Financial Highlights H1 FY 2019/20
Headcount per functional Area                                                            Highlights
                                    -4.2%                                                     ■ Overall headcount decreased by
                39,498
                2,356
                                                   37,847                                       4.2%:
                                                                                              − Headcount in production
                                                   2,010
                4,052                              3,928
                7,706                                 7,828              Sales                   (-5.1%), sales and marketing (-
                                                                         Admin                   14.7%) and administration
                                                                         R&D                     (-3.1%) areas declining
                25,384                             24,081
                                                                         Production
                                                                                              − Investments in R&D headcount
                                                                                                 with increase of 1.6%
                                                                                              ■ Continuous implementation of
            H1 FY 18/19*                        H1 FY 19/20*
                                                                                                necessary measures
Headcount per Region                                                                     Highlights

                          6,558                               6,048
                                                                                              ■ Headcount reduction across all
           15,205                              14,211
                                                                                                regions apart from NSA (+0.4%)
                            9,912                                9,731
                                                                                              − Germany (-1.8%), Rest of
                 7,823                                7,857                                     Europe (-6.5%) and Asia,
                                                                                                Pacific, ROW (-7.8%) declining
             H1 FY 18/19*                         H1 FY 19/20*
        Asia, Pacific, ROW           North, Central and South America
        Germany                      Rest of Europe
 * As per November 30th

  11                                                             HELLA Investor Update H1 FY 2019/20, Conference Call on January 14, 2020
Information Classification: Internal

Adjusted EBIT below prior-year’s level despite improved cost
efficiency. Margin pressure from high R&D and lower GPM
Financial results H1 FY 2019/20
Adjusted EBIT                                                                             Highlights
EUR millions
                           280
                                              296                                         ■ Adjusted EBIT decreased by 39
       268                                                       257                        mill. EUR (-13.1%) to 257 mill. EUR:
                +12                    +16
                                                        -39                                 − decrease in adj. Gross Profit by 58
                                                                                              mill. EUR (-6.4%)
                                                                                            − higher R&D (+15 mill. EUR, +4.7%)
                                                                                            − decrease in adj. SG&A (lower
                                                                                              distribution and admin) by 35 mill.
H1 FY 16/17*          H1 FY 17/18         H1 FY 18/19         H1 FY 19/20                     EUR (-10.5%)

Adjusted EBIT margin                                                                      Highlights
% sales
                            8.9
                                                                                           ■ Adj. EBIT margin decreased by
       8.4                                    8.7
                                                                 7.8                         1.0%-points to 7.8%:
                                       -0.1
                +0.5
                                                    -1.0                                     − decrease of adj. GPM by 1.1pp
                                                                                             − higher R&D expenses ratio
                                                                                               (+0.7%-points)
                                                                                             − lower SG&A ratio (-0.8%-points)
H1 FY 16/17*          H1 FY 17/18         H1 FY 18/19         H1 FY 19/20

*Not restated for Wholesale effects.

  12                                                                HELLA Investor Update H1 FY 2019/20, Conference Call on January 14, 2020
Information Classification: Internal

P&L including reconciliation
Financial results H1 FY 2019/20

FY comparison                                                                                                               Comments

HELLA GROUP                                                                                                                   ■ Reported EBIT H1 19/20
                                                                H1 FY 18/19                    H1 FY 19/20
in EUR mill.                                                                                                                    decreased by 306.4 mill.
 Gross Profit                              reported                 972.2                            832.4                      EUR mainly due to
                                            Adjustments                        56.9                           24.7
                                            adjusted                 915.3                            857.2
                                                                                                                                wholesale profit in FY
                                                                                                                                18/19. FY 19/20 lower
 Other income and expenses                   reported                257.1                             9.7
                                            Adjustments                       249.5                            1.0              Gross Profit and
                                            adjusted                    7.6                           10.7                      increased R&D despite
 Distribution                              reported                 -276.3                           -190.0                     cost savings
                                            Adjustments                        60.6                            0.1
                                            adjusted                -215.7                           -189.9
                                                                                                                              ■ Tax ratio at normalized
 Admin                                    reported                  -126.5                           -116.1
                                            Adjustments                          5.3                           0.6
                                                                                                                                level of 25.4%
                                           adjusted                 -121.2                           -115.5

 EBIT                                        reported                536.8                            230.4
                                                                                                                              ■ Earnings for the period
                                            Adjustments                       -240.5                          27.1              decrease driven by
                                            adjusted                 296.3                            257.4                     lower operating result
 Net financial result                                                -25.0                            -12.8
 Taxes                                                               -68.2                            -55.3                   ■ EPS decreased by 2.54
 Earnings for the period                                             443.6                            162.3
                                                                                                                                EUR (-63.6%) to 1.45
 Earnings per share (EUR)                                             3.99                            1.45
                                                                                                                                EUR
 Note: adjustments include restatements for the sale of the wholesale distribution business & restructuring. For details see financial report.
   13                                                                         HELLA Investor Update H1 FY 2019/20, Conference Call on January 14, 2020
Information Classification: Internal

Q2 FY 19/20 Automotive business with lower growth dynamics and
margin pressure
Financial results H1 FY 2019/20
Quarterly comparison                                                                     Comments
                                                                                           ■ Automotive sales nearly on same level as
                Q2 FY 18/19                           Q2 FY 19/20                            Q2 FY 18/19. Lower sales in Europe
                                                                                             were compensated by higher sales in
                                                                                             NSA and Asia & RoW
                   5.3%
                          2.1%                                                             ■ Aftermarket overall with modest sales
 Segment                                                   1.7%
                                                   0.2%                                      increase due to IAM growth especially in
 Total Sales                                                                                 Eastern Europe. Workshop with lower
 growth (YoY)                                                                                sales compared to Q2 FY 18/19 due to
                                                                   -3.1%                     strong comparable quarter with significant
                                                                                             sales of emission exhaust gas testers
                                 -7.7%
                                                                                           ■ Special Applications negative due to
                 Automotive        Aftermarket     Special Applications                      weak markets in Construction, Trailer and
                                                                                             Bus despite increase in workshop
                                                                                             equipment reimbursements. PY decline
                                                                                             affected also by closure Australia plant
                                 13.8%                                                     ■ Q2 Automotive margin affected (despite
                                                                                             cost efficiencies) by increasing R&D, raw
                  9.3%                                     9.5% 9.9%                         material and personnel expenses not
                                                   8.1%
                          6.7%                                                               compensated by almost flat sales growth
 Adj. EBIT                                                                                 ■ Aftermarket margin increased due to
 Margin                                                                                      increased sales, successful cost structure
                                                                                             optimization and better product mix in
                   Automotive        Aftermarket      Special Applications                   workshop business
                                                                                           ■ Q2 FY 19/20 margin SA decreased with
                                                                                             missing sales and investments in
                                                                                             products despite optimized costs

  14                                               HELLA Investor Update H1 FY 2019/20, Conference Call on January 14, 2020
Information Classification: Internal

Improvement of Adj. Free Cash Flow with strong increase in Cash
Conversion ratio to 50.6%
Financial results H1 FY 2019/20
Adj.1 FCF from operating activities                                                             Highlights
EUR millions
                                                       +17.5%
                                                                                                 ■ Adj. Free Cash Flow from
              +45.4%                +2.9%
                                                                   130
                                                                                                   operating activities increased by
                           108                 111                                                 19 mill. EUR to 130 mill. EUR,
                                                                                                   mainly driven by other non-cash
        74
                                                                                                   income and provision changes
                                                                                                 ■ Cash Conversion3 ratio increased
                                                                                                   by 13.9%-points to 50.6%
  H1 FY 16/17          H1 FY 17/18         H1 FY 18/19        H1 FY 19/20

Adj. Net CAPEX2                                                                                 Highlights
 EUR millions
                                               243                 251                           ■ Continuous investments in
        207                212
                                                         +8
                                                                                                   customer-specific equipment
                  +5                 +30

  H1 FY 16/17          H1 FY 17/18       H1 FY 18/19          H1 FY 19/20
1) Adjustments of FCF include restructuring expenses, factoring, and payments received/made in in connection with the sale of the Wholesale business
2) In accordance with IFRS 15 reimbursements are not deducted from CAPEX since FY 18/19, prior years have not been adjusted.
3) Adj. Free Cash Flow from operating activities / adj. EBIT

   15                                                                    HELLA Investor Update H1 FY 2019/20, Conference Call on January 14, 2020
Information Classification: Internal

Automotive segment with sales decline, profitability under
pressure
Financial results H1 FY 2019/20
            +9.1%
                             +8.1%           -1.6%                                                 Automotive Sales
                                     2,864            2,817           ■ Decline of 1.6% with lower production ramp-ups,
                     2,650
   2,430
                             +8.6% 1,247
                                             +2.9%                      expected EOPs and high comparable basis
            +7.3% 1,148                               1,283
   1,070                                                                  − Demand for electronics products especially
                                                                            energy management and sensor product
                             +8.1%           -5.5%
                                                                            portfolio beyond market growth
                     1,475           1,595            1,507
   1,336
            +10.4%                                                        − Fewer launches of lighting products
      23              27              23               27                 − Overall demand driven by NSA and Asia &
H1 FY 16/17     H1 FY 17/18     H1 FY 18/19      H1 FY 19/20
                                                                                 RoW
   External Sales Electronics           Intersegment Sales
   External Sales Lighting

            +4.5%            +2.7%
                                             -12.7%                                         Automotive Profitability
      227            238             244                              ■ Decrease of adj. EBIT by -12.7% to 213 mill.
                                                      213
                                                                        EUR, margin -1.0%-points, mainly:
                                                                          − Decrease in Gross Profit (-6.9%), due to high
      9.4            9.0             8.5
                                                      7.6
                                                                            volatility and lower volumes that weight
                                                                            negatively on Gross Profit, GPM decreased by
                                                                            1.3%-points to 23.7%
                                                                          − Increase in R&D (+4.0%) with preparation of
H1 FY 16/17    H1 FY 17/18      H1 FY 18/19     H1 FY 19/20
                                                                            new customer projects (booked business) and
   Adj. EBIT         EBIT Margin (% of total sales)                         development of new technologies
 16                                                            HELLA Investor Update H1 FY 2019/20, Conference Call on January 14, 2020
Information Classification: Internal

Non Automotive segments with negative sales development,
profitability supported by savings program and mix effects
Financial results H1 FY 2019/20
         -3.8%                                                                                Aftermarket
   336                              +14.2%
                  323                                    ■ Total sales decline of 3.8%: negative workshop
                                             29.0
                             25.4                          business due to still high comparable basis; IAM
                                             9.0           demand still dampened by weakness in South-
                              7.6
                                                           West Europe and Middle East
                                                         ■ Increase in adj. EBIT with adj. EBIT margin at
H1 FY 18/19 H1 FY 19/20   H1 FY 18/19 H1 FY 19/20          (9.0%):
                                                         −     Growth in GPM by 2.1%-points due to better product
                             EBIT
                                                               mix in workshop business and strict cost savings
                             EBIT Margin
         -10.2%
                                                         −     Cost optimization in distribution and admin
   204
                                    -34.7%                                          Special Applications
                  183
                             27.1                         ■ Negative top-line development (-10.2%):
                                             17.7         −     Weak Agriculture, Construction, and Trailer sales
                             13.3
                                                                due to weak end markets
                                             9.7          ■ Adj. EBIT down by 34.7%, margin -3.6%-points
                                                            to 9.7%:
H1 FY 18/19 H1 FY 19/20   H1 FY 18/19 H1 FY 19/20
                                                          − Gross Profit -12.4% due to mix effects
                                                          − Investments in new products and distribution of
   Total Sales                  Adj. EBIT                   core (VS* & E/E**) products increased R&D expenses
                                EBIT Margin
                                                            (+12.6%) and distribution cost ratio (+1.3%-points)
                                                     * Vehicle Specific Lighting, Electric/Electronic
  17                                                HELLA Investor Update H1 FY 2019/20, Conference Call on January 14, 2020
Information Classification: Internal

HELLA Investor Update H1 FY 2019/20
Outline

■ HELLA Financial Highlights H1 FY 2019/20

■ HELLA Financial Results H1 FY 2019/20

■ Outlook

■ Q&A

 18                               HELLA Investor Update H1 FY 2019/20, Conference Call on January 14, 2020
Information Classification: Internal

Market outlook characterized by uncertainties and a continuous
downward trend in predictions, further revisions possible
Market Outlook
Unstable market environment                                                                  IHS AS OF TODAY:
Global Light Vehicle Production                                                              Development of Global Light Vehicle Production
Comparison of IHS LVP estimates                                                              FY 2019/20, in mill. units
Forecast for Fiscal Year 2019/20
                                                                                                               -4.9%
2.2% 2.1% 2.0%
               1.8%
                      0.3%                                                                              91.7            87.2
                                                                                                                                       Decrease by 4.9%
                             -0.7%
                                     -1.8%                                                                                              to 87.2 mill. units
                                             -2.7%                                                                                      expected
                                                     -4.0%
                                                             -4.6% -4.6% -4.9%                                                         Decline in production
                                                                                                                                        especially in Europe
                                                                                                                                        and Asia/Pacific
                                                                                                   FY 2018/19 FY 2019/20

Jan Feb Mar Apr May Jun Jul Aug Sep Oct Nov Dec Possible further
                                                downgrades

   H1 LVP at -6.1% according HELLA expectations
   Global demand decline especially in China
    confirmed by latest IHS forecasts
   Still high uncertainties in economic and market
    environment due to e.g. unclear execution of the
    Brexit and trade conflicts
   Forecasting ability for H2 FY 19/20 is still limited
  19                                                                       HELLA Investor Update H1 FY 2019/20, Conference Call on January 14, 2020
Information Classification: Internal

Despite declining industry trend and further high uncertainties,
HELLA still expects to outperform the market
Company Guidance
Against the backdrop of declining sector-specific framework and high insecurities
HELLA is currently expecting the following for FY 2019/20:

 Currency and portfolio
                                ■ In the range from 6.5 billion to 7.0 billion EUR
     adjusted sales

  Adjusted EBIT margin
 excluding restructuring
   and portfolio effects        ■ In the range from 6.5% to 7.5%

 20                               HELLA Investor Update H1 FY 2019/20, Conference Call on January 14, 2020
Information Classification: Internal

HELLA Investor Update H1 FY 2019/20
Outline

■ HELLA Financial Highlights H1 FY 2019/20

■ HELLA Financial Results H1 FY 2019/20

■ Outlook

■ Q&A

 21                               HELLA Investor Update H1 FY 2019/20, Conference Call on January 14, 2020
Thanks for your attention

Dr. Kerstin Dodel, CFA
Head of Investor Relations

Office phone    +49 2941 38 - 1349
Facsimile       +49 2941 38 - 471349
Mobile phone    +49 174 3343454
E-Mail          kerstin.dodel@hella.com
Internet        www.hella.com
You can also read