Rightmove House Price Index - The largest monthly sample of residential property prices
←
→
Page content transcription
If your browser does not render page correctly, please read the page content below
Rightmove
House Price Index
The largest monthly sample of
residential property prices

    May 2019
  National edition

   Copyright © 2019, Rightmove plc. Released 20th May. For media enquiries and interviews please contact the
   Rightmove press office: T | 020 7087 0605 M | 07894 255295 or E | amy.murphy@rightmove.co.uk
Under embargo for 00.01 hours, Monday 20 th May 2019

                             Regional price records defy Brexit uncertainty
 • Price of newly-marketed property increases by an average of 0.9% (+£2,841) this month, buoyed by
   the spring market and consistent with the previous two-year average of 1.0%
 • Four out of eleven regions are bucking any Brexit blues and have set new asking price records for
   newly-marketed property:
     • Prospective buyers in Wales, the West and East Midlands, and the North West are being
        confronted with all-time highs for the average price of property coming to market
     • Upwards price pressure and positive sentiment in these regions overcoming hesitancy to
        come to market, with average number of new sellers in the year to date steady at -0.3%
        compared with same period in 2018
     • In contrast the same comparison sees new listing numbers in the remaining seven regions
        down by an average of 6.5%

                                                   National average asking prices
           Month                      Avg. asking price   Monthly change       Annual change                                 Index
         May 2019          £308,290              0.9%                 0.1%              238.3
         April 2019        £305,449              1.1%                -0.1%              236.1
               National average asking prices by market sector (excluding Inner London)
        Sector             May 2019            April 2019       Monthly change      Annual change
  First-time buyers        £191,067            £190,920               0.1%              0.3%
  Second-steppers          £277,229            £275,573               0.6%              0.9%
  Top of the ladder        £553,243            £539,130               2.6%              0.5%

      Monthly asking price trend

      £320,000

      £315,000

      £310,000

      £305,000

      £300,000

      £295,000

      £290,000

      £285,000

        Rightmove measured 133,690 asking prices this month, circa 90% of the UK market. The properties were put on sale
        by estate agents from 7th April 2019 to 11th May 2019 and advertised on Rightmove.co.uk.

  2
                 Copyright © 2019, Rightmove plc. Released 20th May. For media enquiries and interviews please contact the
                 Rightmove press office: T | 020 7087 0605 M | 07894 255295 or E | amy.murphy@rightmove.co.uk
Overview
The price of newly-marketed property increases by an average of 0.9% (+£2,841) this
month, buoyed as usual by the higher buyer demand associated with the more active
spring market. What is surprising against the backdrop of Brexit uncertainty is that four out
of eleven regions are showing few signs of any Brexit blues and have set new record highs
for average asking prices.
Miles Shipside, Rightmove director and housing market analyst comments: “Price
increases are the norm at this time of year, with only one fall in the last ten years, as new-
to-the-market sellers’ price aspirations are under-pinned by the higher buyer demand that
is a feature of the spring market. Indeed the 0.9% monthly rise is consistent with the
previous two years’ average rise of 1.0% over the same period. What will seem inconsistent
to some, given the ongoing uncertainty of the Brexit outcome, is that four out of eleven
regions have hit record highs for new seller asking prices.”
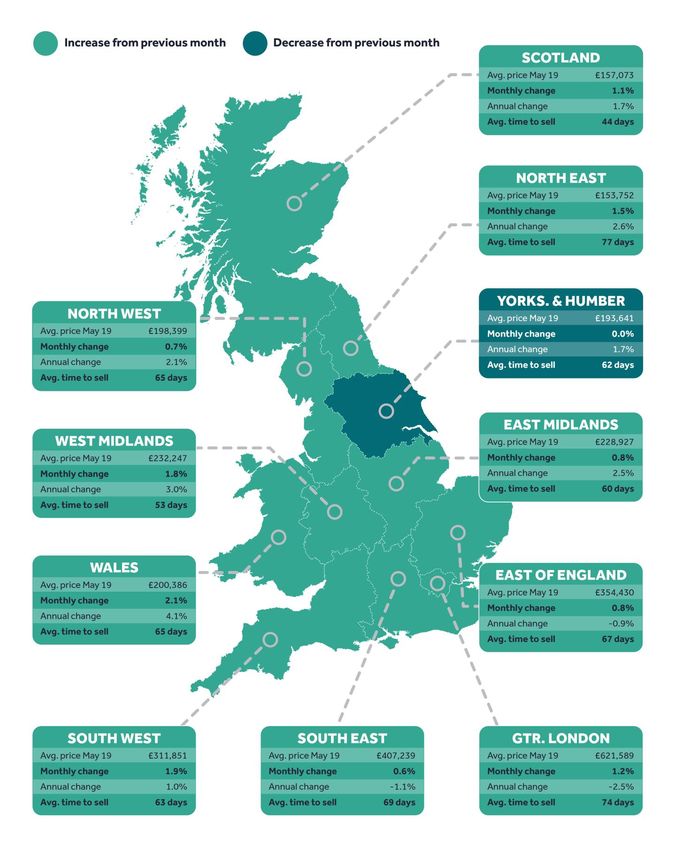
Prospective buyers in Wales, the West and East Midlands, and the North West are being
confronted with average prices of property coming to market at all-time highs. While the
national rate of increase is virtually flat at +0.1% compared to a year ago, these regions
have considerably higher prices than at this time last year, with Wales breaking through the
£200,000 barrier for the first time. By contrast, London and its commuter belt (the South
East and East of England regions) have seen year-on-year falls.
Shipside adds: “Buyers looking in Wales are faced with newly-marketed property prices
that are 4.1% higher than 12 months ago, with the West Midlands at 3.0%, the East
Midlands at 2.5%, and the North West at 2.1%. These increases are the result of a
combination of strong demand, buyers’ affordability headroom, and a continuing shortage
of suitable properties. Agents in these areas say that Brexit concerns are not really on the
agenda of home-movers; they are more concerned with satisfying their housing needs.”
Compared to the rest of the UK, property owners in the regions which have reached new
record prices seem to be overcoming hesitancy to come to market. Their average number
of new sellers so far in 2019 is holding steady compared with last year, at just 0.3% down. In
contrast the remaining seven regions are seeing new listing numbers for the year to date
down by an average of 6.5% compared with the same period in 2018.
Shipside observes:”Activity breeds activity and a greater choice of fresh properties in
these record-setting regions helps to spur buyers into action, especially if they have a
property to sell. This in turn adds another new listing that might then tempt another buyer,
in a virtuous circle. And in much of the rest of the country, despite the ongoing political
uncertainty, agents are reporting that the lure of the right property at the right price still
attracts good interest. In spite of some of the challenges in the market, interest in property
remains very high. People’s ongoing desire to satisfy their pent-up housing needs means
that on average someone contacts an agent on Rightmove every second.”
Miles Shipside, Rightmove director and housing market analyst says:”These increases are the
result of a combination of strong demand, buyers’ affordability headroom, and a continuing
shortage of suitable properties. Agents in these areas say that Brexit concerns are not really on
the agenda of home-movers; they are more concerned with satisfying their housing needs.”
3
Copyright © 2019, Rightmove plc. Released 20th May. For media enquiries and interviews please contact the
Rightmove press office: T | 020 7087 0605 M | 07894 255295 or E | amy.murphy@rightmove.co.ukAgents’ views
Ian Marriott, director at FHP Living in West Bridgford in Nottinghamshire, said: “It’s a
strong market in the East Midlands at the moment, things are looking up. There are less
buyers out there at the moment, but the people who are in the market are doers rather
than people who will mess you around. Sellers shouldn’t be disheartened if viewing
figures are down because the quality of people who are interested in buying is better
than before. I think people are just really bored of the whole Brexit debate. It feels like
there is some kind of election every week and so the fear factor is perhaps subsiding, and
people are just getting on with their lives. There may be 30% less people in our market,
but the good news is that 70% of people still want to get on and move. We’re possibly
less affected than the London and southern regions because, being further removed
from the city, we have a slightly more stable market. Things don’t react as quickly here to
the economy.”
Dafydd Spear, sales manager at Belvoir Swansea, added: “It’s great that Wales has
broken that £200,000 barrier and I think it’s because there’s not so much Brexit doom
and gloom here. In terms of what’s happening in Swansea, we’re seeing lots of
investment in the city centre which is really driving things and boosting the whole area,
and of course we’re all still waiting to see whether the Tidal Lagoon eventually gets the
green light. But we’re a very buoyant market. People still need to buy, and people still
need to sell and over the last 12 months it’s been all system go really. We’ve been seeing
a few cheeky offers, but by and large we’re getting houses sold at very close to their
asking prices, and in some cases, exceeding them.”
4
Copyright © 2019, Rightmove plc. Released 20th May. For media enquiries and interviews please contact the
Rightmove press office: T | 020 7087 0605 M | 07894 255295 or E | amy.murphy@rightmove.co.ukAsking price trends
Five year asking price trend
£320,000
£310,000
£300,000
£290,000
£280,000
£270,000
£260,000
£250,000
£240,000
£230,000
£220,000
May-14 Nov-14 May-15 Nov-15 May-16 Nov-16 May-17 Nov-17 May-18 Nov-18 May-19
% monthly change in average asking prices
1.5%
1.0% 1.1%
1.0% 0.8% 0.9%
0.7% 0.7%
0.5%
0.4% 0.4% 0.4%
0.0%
-0.1%
-0.5%
-1.0%
-1.5%
-1.5%
-2.0% -1.7%
-2.5% -2.3%
May-18 Jun-18 Jul-18 Aug-18 Sep-18 Oct-18 Nov-18 Dec-18 Jan-19 Feb-19 Mar-19 Apr-19 May-19
5
Copyright © 2019, Rightmove plc. Released 20th May. For media enquiries and interviews please contact the
Rightmove press office: T | 020 7087 0605 M | 07894 255295 or E | amy.murphy@rightmove.co.ukAverage time to sell and stock
Average 'time to sell' (no. of days) - National
85
80 77
75
71
70
70 67
65
64
65
61 61
60
59
60 57
56 56
55
50
45
40
Apr-18 May-18 Jun-18 Jul-18 Aug-18 Sep-18 Oct-18 Nov-18 Dec-18 Jan-19 Feb-19 Mar-19 Apr-19
Average stock per agent (including Under Offer/Sold STC)
60
52 53 52 52 52
50 50 50
50 47 48
46 45 46
40
30
20
10
0
Apr-18 May-18 Jun-18 Jul-18 Aug-18 Sep-18 Oct-18 Nov-18 Dec-18 Jan-19 Feb-19 Mar-19 Apr-19
6
Copyright © 2019, Rightmove plc. Released 20th May. For media enquiries and interviews please contact the
Rightmove press office: T | 020 7087 0605 M | 07894 255295 or E | amy.murphy@rightmove.co.ukRegional trends
7
Copyright © 2019, Rightmove plc. Released 20th May. For media enquiries and interviews please contact the
Rightmove press office: T | 020 7087 0605 M | 07894 255295 or E | amy.murphy@rightmove.co.ukLondon trends
Average 'time to sell' (no. of days) - London
100
95
89
90
85 82 82
80 78
76
74
75 72 72 71
70
70 67 67 67
65
60
55
50
Apr-18 May-18 Jun-18 Jul-18 Aug-18 Sep-18 Oct-18 Nov-18 Dec-18 Jan-19 Feb-19 Mar-19 Apr-19
8
Copyright © 2019, Rightmove plc. Released 20th May. For media enquiries and interviews please contact the
Rightmove press office: T | 020 7087 0605 M | 07894 255295 or E | amy.murphy@rightmove.co.ukLondon trends
Borough data is based on a three-month rolling average and can be used as an indicator of overall
price trends in each borough over time. It is not directly comparable with the overall London
monthly figures.
Avg. price
Borough Monthly change Annual change
May 2019
Barking and Dagenham £316,839 1.0% 0.9%
Bexley £408,233 1.2% 0.6%
Hammersmith and Fulham £931,171 0.9% -0.2%
Sutton £470,697 2.5% -0.3%
Southwark £634,232 -1.8% -0.5%
Islington £770,123 1.1% -0.8%
Hillingdon £492,585 1.7% -0.9%
Bromley £530,492 0.5% -0.9%
Waltham Forest £481,926 0.8% -1.0%
Enfield £457,398 0.8% -1.2%
Ealing £555,611 0.8% -1.4%
Havering £406,075 -1.2% -1.5%
Brent £577,818 1.5% -1.5%
Camden £980,210 1.2% -1.5%
Newham £407,868 -0.3% -1.8%
Merton £645,116 2.7% -2.0%
Hounslow £540,484 -0.9% -2.0%
Croydon £437,195 1.2% -2.2%
Kingston upon Thames £610,076 0.4% -2.3%
Harrow £549,634 0.4% -2.3%
Redbridge £451,503 -0.4% -3.2%
Richmond upon Thames £832,012 2.7% -3.3%
Wandsworth £793,014 -2.4% -3.5%
Lewisham £464,200 1.3% -3.5%
Barnet £639,192 0.7% -3.5%
Greenwich £441,287 -0.1% -3.5%
Haringey £602,170 -0.1% -3.7%
Kensington and Chelsea £1,590,380 4.8% -3.9%
Lambeth £632,590 0.8% -4.7%
Hackney £626,095 0.1% -4.9%
Tower Hamlets £559,475 -0.5% -6.1%
Westminster £1,400,270 -1.7% -6.3%
9
Copyright © 2019, Rightmove plc. Released 20th May. For media enquiries and interviews please contact the
Rightmove press office: T | 020 7087 0605 M | 07894 255295 or E | amy.murphy@rightmove.co.ukEditor’s notes
About the Index:
The Rightmove House Price Index methodology was updated in January 2018. The report now includes data for
Scotland and a number of measures have been refined. The stock per agent figure now calculates the average based
on the number of properties an agent has on Rightmove each day across the month, rather than the average of the
total number of properties each agent advertised in the month. London asking prices are now broken down into travel
zones. For the purpose of historical comparisons, the historical figures have been restated based on the new
methodology.
The Index includes asking price breakdowns in the housing market to offer trends at three different sectors of the
market: first-time buyer, second-stepper and top of the ladder. Inner London prices have been excluded from this
categorisation as the normal housing ladder is not really applicable.
Advertising property for over 90% of all UK estate agents, Rightmove is in a unique position to identify any immediate
changes in the market. Rightmove’s House Price Index is compiled from the asking prices of properties coming onto
the market via over 13,000 estate agency branches listing on Rightmove.co.uk. Rather than being a survey of opinions
as with some other indices, it is produced from factual data of actual asking prices of properties currently on the
market. The sample includes up to 200,000 homes each month – representing circa 90% of the market, the largest and
most up-to-date monthly sample of any house price indicator in the UK. The Index differs from other house price
indicators in that it reflects asking prices when properties first come onto the market, rather than those recorded by
lenders during the mortgage application process or final sales prices reported to the Land Registry. In essence,
Rightmove’s Index measures prices at the very beginning of the home buying and selling process while other indices
measure prices at points later in the process. Having a large sample size and being very up-to-date, the Rightmove
Index has established itself as a reliable indicator of current and future trends in the housing market.
Rightmove measured 133,690 asking prices this month, circa 90% of the UK market. The properties were put on sale
by estate agents from 7th April 2019 to 11th May 2019 and advertised on Rightmove.co.uk.
Market sectors explained:
First-time buyer: This figure represents the typical property a first-time buyer would purchase, covering all two bed
properties and smaller that come to market (houses and flats).
Second-stepper: This figure represents the typical property of a person moving from their first home, covering all
three and four bed properties that come to market (houses and flats) excluding four bed detached houses.
Top of the ladder: This figure represents asking prices at the top end of the market, covering all five bed properties
and above (houses and flats), as well as four bed detached houses.
About Rightmove.co.uk:
Rightmove.co.uk is the UK’s leading property website, displaying details of homes for sale or rent to the largest online
audience. It is consistently ranked the number one property website in the UK (source: Experian Hitwise). It has circa
90% of all properties for sale and at any time displays a stock of over one million properties to buy or rent. The
Rightmove.co.uk site attracts over 130 million visits from home movers each month with time on site averaging over
one billion minutes per month (Rightmove data, July 2017).
10
Copyright © 2019, Rightmove plc. Released 20th May. For media enquiries and interviews please contact the
Rightmove press office: T | 020 7087 0605 M | 07894 255295 or E | amy.murphy@rightmove.co.ukYou can also read