Rightmove House Price Index - The largest monthly sample of residential property prices
←
→
Page content transcription
If your browser does not render page correctly, please read the page content below
Rightmove
House Price Index
The largest monthly sample of
residential property prices

  December 2018
  National edition

   Copyright © 2018, Rightmove plc. Released 17th December. For media enquiries and interviews please
   contact the Rightmove press office: T | 020 7087 0605 M | 07894 255295 or E | amy.funston@rightmove.co.uk

Under embargo for 00.01 hours, Monday 17 th December 2018

3.2% price fall over last two months tempts bargain-hunting buyers
• The price of property coming to market drops by 1.5% (-£4,496) this month with new seller asking
  prices now on average nearly £10,000 lower than in October
• This is the biggest fall over two consecutive months since 2012, as sellers try to attract buyers
  despite a combination of the usual Christmas slowdown, stretched affordability and political
  uncertainty
• Some signs of cheaper prices tempting buyers in search of a bargain, as number of sales agreed is
  only down by 2.1% compared to same period a year ago in spite of market headwinds
• With Rightmove traffic usually tripling between Christmas Day and the New Year, would-be sellers
  will maximise their exposure if they come to market as soon as possible

                                         National average asking prices
           Month          Avg. asking price      Monthly change        Annual change            Index
          Dec 2018            £297,527                -1.5%                +0.7%                230.0
          Nov 2018            £302,023                -1.7%                 -0.2%               233.5
                    National average asking prices by market sector (excluding Inner London)
           Sector             Dec 2018              Nov 2018           Monthly change        Annual change
     First-time buyers        £188,381              £188,571                -0.1%               +1.3%
     Second-steppers          £267,862              £272,017                -1.5%               +1.0%
     Top of the ladder        £514,829              £531,775                -3.2%               -0.2%

      Monthly asking price trend

      £320,000

      £315,000

      £310,000

      £305,000

      £300,000

      £295,000

      £290,000

      £285,000

      £280,000

         Rightmove measured 75,965 asking prices nationally this month, circa 90% of the UK market. The properties were
         put on sale by estate agents from 11th November 2018 to 8th December 2018 and advertised on Rightmove.co.uk.

     2
                 Copyright © 2018, Rightmove plc. Released 17th December. For media enquiries and interviews please
                 contact the Rightmove press office: T | 020 7087 0605 M | 07894 255295 or E | amy.funston@rightmove.co.uk
Overview
The price of property coming to market drops by 1.5% (-£4,496) this month. This second
consecutive monthly fall has resulted in average new seller asking prices now being 3.2% (-£9,719)
lower than two months ago, a decrease of nearly £10,000, as sellers try to tempt prospective
buyers. This is the biggest fall over two consecutive months since 2012, when asking prices
dropped by £11,836 over the same period. There are some signs that these cheaper prices are
tempting buyers back into the market, with the number of sales agreed proving surprisingly
resilient.
Miles Shipside, Rightmove director and housing market analyst comments: “It’s usual for new-to-
the-market sellers to price lower in the run-up to Christmas to tempt distracted buyers, so we
should not read too much into the mere fact of two consecutive monthly falls. However, these falls
have been larger than usual, making this the largest fall over two months for six years, showing that
there are more than just seasonal forces at play. With stretched affordability limiting some people's
ability to buy for the first time or trade up, a modest lowering of property prices combined with an
increase in wage growth could help more of them to move and thus increase transaction numbers.”
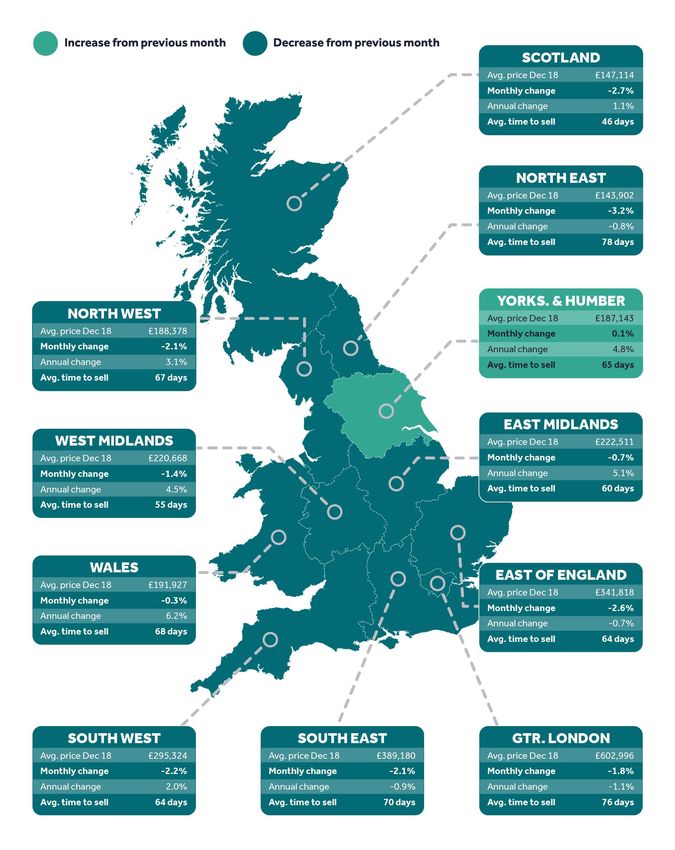
As well as the usual Christmas slowdown, would-be sellers are also faced with downwards price
pressure from stretched buyer affordability and political uncertainty. The three regions where
property prices went up most since 2012 are now seeing year-on-year price falls. London (-1.1%),
the South East (-0.9%) and the East of England (-0.7%) are all seeing cheaper new seller asking
prices than a year ago. The drag of London and its commuter-belt regions keeps the national
average annual rate of increase at +0.7% as 2018 comes to an end, despite some significant
increases in northern regions.
Shipside observes: “Rightmove’s forecast for 2018 was that prices would rise by a subdued 1% as
lacklustre wage growth and tighter lending criteria could no longer support rising prices in some
regions. However, the northern regions are keeping the national figure in positive territory as 2018
draws to a close. Wales leads the UK’s annual growth with +6.2%, while the East Midlands, West
Midlands and Yorkshire & the Humber are all between +4% and +5%. We forecast that 2019 will see
a similar pattern with the north still broadly out-performing the south, though our prediction for
the year ahead is slightly more muted with the overall national average flat at 0%.”
There are however some signs of cheaper prices tempting buyers searching for a bargain, as the
number of sales agreed by estate agents is only down by a relatively marginal 2.1% compared to
the same period a year ago despite the market headwinds. There are still buyers in the market for
the right property at the right price.
Shipside says:“The run-up to Christmas can be one of the best times for buyers to negotiate a
better deal, as they are fewer in number so sellers who are keen to sell have to talk turkey on
accepting a lower price. The window of maximum buyer negotiating opportunity starts to close
from Boxing Day onwards, as more buyers become active in the market. From the low point on
Christmas Day, the number of pages of property viewed on Rightmove last year more than tripled
(+228%) by the first working day of the New Year. Home owners who are thinking of coming to the
market early in 2019 should seriously consider doing so as soon as possible to get maximum
exposure to the surge in interest from buyers who make it their resolution to move in the New
Year.”
“It’s usual for new-to-the-market sellers to price lower in the run-up to Christmas to tempt
distracted buyers, so we should not read too much into the mere fact of two consecutive
monthly falls. However, these falls have been larger than usual, making this the largest fall
over two months for six years, showing that there are more than just seasonal forces at
play.” Miles Shipside, Rightmove director and housing market analyst
3
Copyright © 2018, Rightmove plc. Released 17th December. For media enquiries and interviews please
contact the Rightmove press office: T | 020 7087 0605 M | 07894 255295 or E | amy.funston@rightmove.co.ukAgents’ views
Peter Woodthorpe, Director of Readings in Leicester, said: “Overall our sales have been up this
year compared to 2017 and prices have been growing steadily. The lack of stock for sale in our
area has led to some over ambitious pricing which is the reason why some properties might be
sticking, and it’s why pricing correctly from the start is so critical. There’s definitely one or two
bargains to be had as is usual at this time of year. As prices are still relatively affordable for
home-owners and the market is still fundamentally sound in our area, there’s no reason why the
market will not continue to perform well next year.”
Nick Leeming, Chairman of Jackson-Stops, comments: “The 2019 property market is likely to
get off to quite a slow start in the New Year while the UK awaits clarity on Brexit negotiations.
However, despite the market not being as buoyant as it was a few years ago, accurately priced
homes will still sell so it is interesting to see signs of vendors starting to recognise this in
Rightmove’s latest data. Over the last year there has generally been a mismatch between
vendor expectations and the price that buyers are prepared to pay, particularly at the top end of
the market, so properties launching now at a competitive value will stand out and attract buyers’
interest. In my experience the first working day after the New Year break is one of the busiest
days for property portals, so for those looking for their home to be front and centre of the
property parade this is a crucial time for marketing.”
4
Copyright © 2018, Rightmove plc. Released 17th December. For media enquiries and interviews please
contact the Rightmove press office: T | 020 7087 0605 M | 07894 255295 or E | amy.funston@rightmove.co.ukAsking price trends
Five year asking price trend
£320,000
£310,000
£300,000
£290,000
£280,000
£270,000
£260,000
£250,000
£240,000
£230,000
£220,000
Dec-13 Jun-14 Dec-14 Jun-15 Dec-15 Jun-16 Dec-16 Jun-17 Dec-17 Jun-18 Dec-18
% monthly change in average asking prices
2.0%
1.5%
1.5%
1.0%
1.0% 0.7% 0.8% 0.8% 0.7%
0.4% 0.4%
0.5%
0.0%
-0.5% -0.1%
-1.0%
-1.5%
-1.5%
-2.0% -1.7%
-2.5%
-2.3% -2.3%
-3.0%
Dec-17 Jan-18 Feb-18 Mar-18 Apr-18 May-18 Jun-18 Jul-18 Aug-18 Sep-18 Oct-18 Nov-18 Dec-18
5
Copyright © 2018, Rightmove plc. Released 17th December. For media enquiries and interviews please
contact the Rightmove press office: T | 020 7087 0605 M | 07894 255295 or E | amy.funston@rightmove.co.ukAverage time to sell and stock
Average 'time to sell' (no. of days) - National
80
75 72
70 67
65 65
65 62
61 61 61
60
59
60 57
56 56
55
50
45
40
Average stock per agent (including Under Offer/Sold STC)
60
52 53 52 52 52
50 50
50 47
45
47
43 42 43
40
30
20
10
0
Nov-17 Dec-17 Jan-18 Feb-18 Mar-18 Apr-18 May-18 Jun-18 Jul-18 Aug-18 Sep-18 Oct-18 Nov-18
6
Copyright © 2018, Rightmove plc. Released 17th December. For media enquiries and interviews please
contact the Rightmove press office: T | 020 7087 0605 M | 07894 255295 or E | amy.funston@rightmove.co.ukRegional trends
7
Copyright © 2018, Rightmove plc. Released 17th December. For media enquiries and interviews please
contact the Rightmove press office: T | 020 7087 0605 M | 07894 255295 or E | amy.funston@rightmove.co.ukLondon trends
Average 'time to sell' (no. of days) - London
90
85 83
80 78
75 76
75 71 72 72 72 71
70
70 67 67 67
65
60
55
50
45
40
8
Copyright © 2018, Rightmove plc. Released 17th December. For media enquiries and interviews please
contact the Rightmove press office: T | 020 7087 0605 M | 07894 255295 or E | amy.funston@rightmove.co.ukLondon trends
Borough data is based on a three month rolling average and can be used as an indicator of overall
price trends in each borough over time. It is not directly comparable with the overall London
monthly figures.
Avg. price
Borough Monthly change Annual change
Dec 2018
Bromley £539,718 0.5% 4.5%
Hillingdon £492,949 0.0% 2.3%
Camden £1,010,407 0.0% 2.0%
Westminster £1,462,052 0.4% 1.9%
Bexley £400,564 -1.1% 1.9%
Kensington and Chelsea £1,596,199 -1.0% 1.3%
Richmond upon Thames £822,898 -0.3% 1.3%
Enfield £456,655 0.1% 1.0%
Southwark £640,828 -1.0% 0.9%
Merton £613,371 -0.2% 0.5%
Havering £405,385 -0.4% 0.5%
Waltham Forest £475,632 -0.4% 0.2%
Ealing £545,305 -0.2% -0.2%
Brent £565,669 -1.9% -0.8%
Islington £737,597 -1.7% -1.0%
Greenwich £434,281 0.0% -1.0%
Haringey £581,552 -2.8% -1.0%
Kingston upon Thames £599,859 -0.4% -1.5%
Redbridge £449,117 -1.6% -1.6%
Barking and Dagenham £311,861 -0.3% -1.7%
Lewisham £456,242 -0.5% -1.8%
Tower Hamlets £581,018 0.2% -1.8%
Newham £412,373 -0.8% -1.9%
Harrow £546,659 -0.7% -2.0%
Sutton £450,077 -1.1% -2.3%
Barnet £611,726 -2.9% -2.9%
Hammersmith and Fulham £913,633 -3.7% -3.1%
Croydon £423,246 -1.6% -4.0%
Wandsworth £764,709 -2.2% -4.1%
Hackney £618,989 -0.2% -4.2%
Lambeth £624,037 0.2% -4.9%
Hounslow £504,979 -2.4% -6.5%
9
Copyright © 2018, Rightmove plc. Released 17th December. For media enquiries and interviews please
contact the Rightmove press office: T | 020 7087 0605 M | 07894 255295 or E | amy.funston@rightmove.co.ukEditor’s notes
About the Index:
The Rightmove House Price Index methodology was updated in January 2018. The report now includes data for
Scotland and a number of measures have been refined. The stock per agent figure now calculates the average based
on the number of properties an agent has on Rightmove each day across the month, rather than the average of the
total number of properties each agent advertised in the month. London asking prices are now broken down into travel
zones. For the purpose of historical comparisons, the historical figures have been restated based on the new
methodology.
The Index includes asking price breakdowns in the housing market to offer trends at three different sectors of the
market: first-time buyer, second-stepper and top of the ladder. Inner London prices have been excluded from this
categorisation as the normal housing ladder is not really applicable.
Advertising property for over 90% of all UK estate agents, Rightmove is in a unique position to identify any immediate
changes in the market. Rightmove’s House Price Index is compiled from the asking prices of properties coming onto
the market via over 13,000 estate agency branches listing on Rightmove.co.uk. Rather than being a survey of opinions
as with some other indices, it is produced from factual data of actual asking prices of properties currently on the
market. The sample includes up to 200,000 homes each month – representing circa 90% of the market, the largest and
most up-to-date monthly sample of any house price indicator in the UK. The Index differs from other house price
indicators in that it reflects asking prices when properties first come onto the market, rather than those recorded by
lenders during the mortgage application process or final sales prices reported to the Land Registry. In essence,
Rightmove’s Index measures prices at the very beginning of the home buying and selling process while other indices
measure prices at points later in the process. Having a large sample size and being very up-to-date, the Rightmove
Index has established itself as a reliable indicator of current and future trends in the housing market.
Rightmove measured 75,965 asking prices nationally this month, circa 90% of the UK market. The properties were put
on sale by estate agents from 11th November 2018 to 8th December 2018 and advertised on Rightmove.co.uk.
Market sectors explained:
First-time buyer: This figure represents the typical property a first-time buyer would purchase, covering all two bed
properties and smaller that come to market (houses and flats).
Second-stepper: This figure represents the typical property of a person moving from their first home, covering all
three and four bed properties that come to market (houses and flats) excluding four bed detached houses.
Top of the ladder: This figure represents asking prices at the top end of the market, covering all five bed properties
and above (houses and flats), as well as four bed detached houses.
About Rightmove.co.uk:
Rightmove.co.uk is the UK’s leading property website, displaying details of homes for sale or rent to the largest online
audience. It is consistently ranked the number one property website in the UK (source: Experian Hitwise). It has circa
90% of all properties for sale and at any time displays a stock of over one million properties to buy or rent. The
Rightmove.co.uk site attracts over 130 million visits from home movers each month with time on site averaging over
one billion minutes per month (Rightmove data, July 2017).
10
Copyright © 2018, Rightmove plc. Released 17th December. For media enquiries and interviews please
contact the Rightmove press office: T | 020 7087 0605 M | 07894 255295 or E | amy.funston@rightmove.co.ukYou can also read