Security Analysis: and a Refresher for Others An Intro for Some - Douglas Kidd Investment Officer 17 March 2021
←
→
Page content transcription
If your browser does not render page correctly, please read the page content below

Security Analysis:
                   An Intro for Some
               and a Refresher for Others

            Douglas Kidd
            Investment Officer
            17 March 2021

3/17/2021                                   1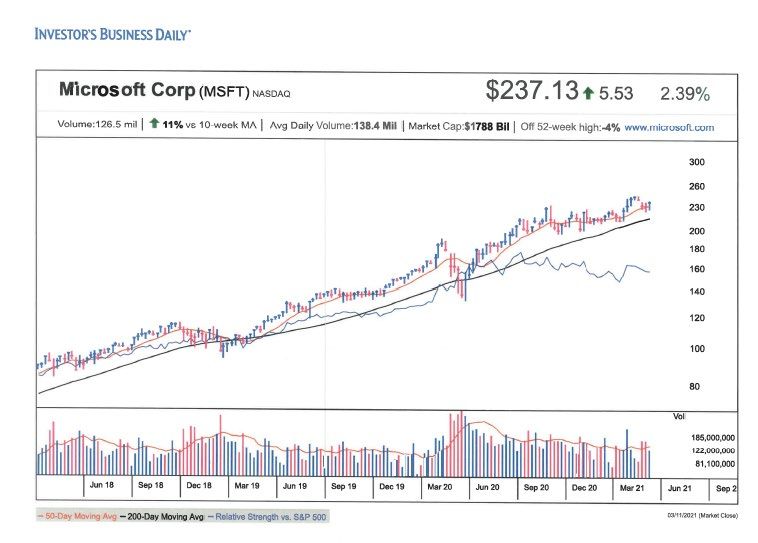
Executive Summary

    •       Equity Securities Analysis is both science AND art
    •       Define Terms: There are many different approaches
    •       The Numbers Game: What is Important?
    •       Examples for various investing style preferences
    •       Discussion of Merits and Demerits by Style
    •       Beware of Bias ! A peak at Behavioral Finance

3/17/2021                                                        2
Each saying reflects some investment wisdom or perhaps style bias

      •     “Investing is like a beauty contest. It’s not who you judge as most beautiful,
            it’s who all the other judges will think most beautiful who wins.”
      •     “In the short term the market is a voting machine, but in the long term it’s a
            weighing machine.”
      •     “The market can stay irrational longer than you can stay solvent.”
      •     “Trees don’t grow to the sky.”
      •     Q: Why did the stock go up? A: More buyers than sellers….
      •     “This company has many hidden assets.”

3/17/2021                                                                                    3
The Equities Portfolio Risk Factor Pyramid

            If FCERA has Not Invested a Passive Fund, the Manager Has
                Built a Process Which Emphasizes One or More Factors

                                                                 Alpha, not just Beta
                                                               Low Correlation to Growth

                                                             -Illiquidity > Private Equity
                                                             -Long/Short > Hedge Funds
                               Factor Tilts, e.g. Alt Beta
                               -Small size, Value
                               -Momentum, Quality, Low Vol
                               -Currencies
                               -Countries

                             Equity Beta, Sensitivity to
                                Economic Growth

3/17/2021                                                                                    4
Defining Terms
                                      Factors or Styles
            Value: Everyone wants a bargain, but Value is usually referring to the
            attractiveness of an investment based upon stock price relative to other metrics
            such as earnings, book value of equity, or replacement cost of assets.
            Growth: Refers to economic growth, but also to revenue growth, or more likely,
            earnings growth. A “growth stock” typically has above average earnings and/or
            revenue growth, big markets, and an attractive business model.
            Momentum: Refers to stock price momentum. A body in motion remains in
            motion, while a body at rest remains at rest. Stocks going up are expected to keep
            going up. Those who follow stock price charts are often momentum investors.
            Quality: Refers to income statement and balance sheet characteristics.
            Consistent growth, high margin, good returns on assets and equity, and perhaps
            low debt ratios, a long track record. “A Good Business.”
            Low Volatility: Stability, without big swings in price, either up or down.
            Consistency is prized.

3/17/2021                                                                                        5
If this stock is attractive, you might be a Growth investor
                                          Guess this stock…..?                                                      Last This
                                                                                                                    Year Year
       In Millions of USD                 FY 2019    Current/LTM   FY 2021 Est       FY 2022 Est   Price to
                                                                                                   Revenue          11.0   10.2
       12 Months Ending                 06/30/2019    12/31/2020    06/30/2021        06/30/2022
                                                                                                   Price to
       Market Capitalization           1,023,856.3   1,728,374.2                                   Earnings (P/E)   33.6   30.8
       + Total Debt                       86,455.0      82,782.0                 Note: $1.7T       P/E to Growth    1.32   1.14
       Enterprise Value                  976,492.3   1,679,188.2                 Valuation !       Price to Cash
                                                                                                   Flow             25.4
       Revenue, Adj                     125,843.0      153,284.0     164,641.5         184,147.0
        Growth %, YoY                        14.0           14.2          15.1              11.8
       Net Income, Adj                   36,318.1       51,471.9      56,049.5          61,426.8
        Margin %                             28.9           33.6          34.0              33.4       Note the Growth
       EPS, Adj                              4.68           6.73          7.40              8.11       in Revenue and
        Growth %, YoY                        27.8           25.5          27.2               9.5
                                                                                                          Earnings !
       In Millions of USD except Per
       Share                             FY 2016        FY 2018      FY 2019            FY 2020
       12 Months Ending                06/30/2016     06/30/2018   06/30/2019         06/30/2020
       Returns
       Return on Common Equity              25.17         19.45         42.41             40.14
       Return on Assets                     10.89          6.51         14.39             15.07
       Return on Capital                    16.81         10.08         23.20             23.87
       Return on Invested Capital           15.75          8.81         21.47             22.99            Tremendous
                                                                                                           Profitability !
       Margins
       Gross Margin                         64.04         65.25         65.90             67.78
       Net Income Margin                    22.53         15.02         31.18             30.96
3/17/2021                                                                                                             6
Up more than 100% since pre-
            pandemic as Growth did not waver

3/17/2021                                      7
Growth
            • A Growth Stock is one with higher revenue and
              earnings growth (than the average stock).
            • Long and consistent growth is preferred to erratic or
              one time growth.
            • Growth is often related to a theme, such as Internet
              Subscribers, Cell Phone penetration, Electric
              Vehicle adoption, Genetic Engineering.
            • This approach works if the growth rate or the
              growth period lasts longer than expected.
            • “You have no idea how big this will become.”
            • Downside? Poor execution, competition, smaller
              than expected market, technological obsolescence.
3/17/2021                                                             8
If this stock looks attractive, you might be a Value investor
                                           Guess this stock…..?
            In Millions of USD            FY 2018      FY 2019 Current/LTM FY 2021 Est FY 2022 Est

            12 Months Ending            12/31/2018   12/31/2019   12/31/2020      12/31/2021   12/31/2022
            Stock Price                                           $     110.00

            Market Capitalization        207,009.7    226,820.1       213,519.6
                                                                                                          Price to Cash Flow
            Enterprise Value             233,161.7    252,924.1       257,151.6                           (2018)                7.0X
                                                                                                          Price to Revenue     2.74X   All metrics
            Revenue, Adj                 159,037.0    139,574.0        93,972.0    135,846.2    140,817.0 Price to Book        1.37X   indicate Value
             Growth %, YoY                    24.6        -12.2           -32.9         43.8          3.7 Debt/Equity          16.1%
            EPS, Adj                          8.34         6.00           -2.87         4.47         5.83
             Growth %, YoY                   137.6        -28.1                                      30.3

            Cash from Operations          30,618.0     27,314.0        10,577.0

            In Millions of USD except
            Per Share                     FY 2015      FY 2016         FY 2018      FY 2019      FY 2020

            12 Months Ending            12/31/2015   12/31/2016   12/31/2018      12/31/2019   12/31/2020
            Total Equity                 153,886.0    146,722.0    155,642.0       145,208.0    132,726.0
            Net Debt to Equity               17.69        26.67        16.10           17.29        32.09
            Tangible Common Equity
            Ratio                           56.98        55.18           60.17        59.99         54.08
            Current Ratio                    1.35         0.93            1.25         1.07          1.18

            Cash Conversion Cycle           13.86        19.71           12.57        14.85         15.26
3/17/2021                                                                                                                                   9
Yes, fossil fuels are going away and yes oil demand
      plummeted during COVID, but this is overdone!

3/17/2021                                                   10
Value
• Value is often related to balance sheet items:
assets, equity, debt, inventories, plant and
equipment, deferred tax assets
• Price to Earnings (Low)
• Price to Cash Flow (Low)
• Price to Book (Equity) Value (Low)
• Asset Value to Replacement Cost (Low)
• This approach works when: business recovers,
assets are monetized, or value is “unlocked.”
• “It’s not as bad as it looks.”
• Downside? “Value Trap” or “Cheap for a Reason”
3/17/2021 11If this stock is attractive to you, you might be a Quality Investor
Guess this Stock…..?
In Millions of USD FY 2019 FY 2020 Current/LTM FY 2021 Est FY 2022 Est
12 Months Ending 06/30/2019 06/30/2020 12/31/2020 06/30/2021 06/30/2022
Market Capitalization 274,645.9 296,503.2 313,571.7
- Cash & Equivalents 10,287.0 16,181.0 11,941.0 P/E 21.6
+ Preferred & Other 1,313.0 1,254.0 1,244.0
+ Total Debt 30,092.0 35,611.0 31,100.0 Price/Rev 4.5
Enterprise Value 295,763.9 317,187.2 333,974.7
Revenue, Adj 67,684.0 70,950.0 73,975.0 75,467.1 78,163.2 ROE 27.78
Growth %, YoY 1.3 4.8 6.3 6.4 3.6
Gross Profit, Adj 33,342.0 36,219.0 38,347.0 39,144.0 40,635.5 Net Mgn 17.99
Margin % 49.3 51.0 51.8 51.9 52.0
EBITDA, Adj 15,989.2 19,511.0 21,208.0 21,293.8 22,399.3
Margin % 23.6 27.5 28.7 28.2 28.7
• Profitable
Net Income, Adj 11,099.4 13,182.5 14,519.5 14,831.0 15,584.5
Margin % 16.4 18.6 19.6 19.7 19.9 • Consistent
EPS, Adj 4.27 5.12 5.62 5.70 6.06 • Steady Growth
Growth %, YoY 2.4 19.9 19.3 11.2 6.4
Cash from Operations 15,242.0 17,403.0 19,033.0
Capital Expenditures -3,347.0 -3,073.0 -2,806.0 -3,193.8 -3,505.7
Free Cash Flow 11,895.0 14,330.0 16,227.0 14,745.9 15,522.1
3/17/2021 12A No Drama Stock 3/17/2021 13
Quality

            •    Consistency of Revenue and Earnings
            •    Steady, if unspectacular growth
            •    Often an established household name:
            •       McDonalds, P&G, Allstate
            •    Good profitability: Net Margin, ROE*
            •    Reasonable valuation: Price/Earnings, Price/Revenue
            •    Downside? All is well-known and there is no catalyst,
                 aka it is a boring stock.
            * Return on Equity

3/17/2021                                                                14
McDonald’s Quality has
made it a Quality Stock
3/17/2021 15Steady and Reliable
You’re in Good Hands
3/17/2021 16If you like the looks of this chart, you might just be
a momentum investor
3/17/2021 17Gene Therapy will change everything!
If this stock is attractive to you, you just
might be a momentum investor
3/17/2021 18If this was attractive to you in 2020, you might be a
momentum investor
With less than 1% global
market share, this company is
valued more highly than the
rest of the industry combined
3/17/2021 19Momentum
• A New Technology or Market may be underappreciated
• As a stock is “discovered,” more people flock to it
• The Stock can become detached from the underlying fundamentals
• Often built upon a “story”
• Internet subscribers: Netflix, Google
• Cell Phone adoption: Nokia, Blackberry, Motorola
• Social Media “network effect”: Face Book
• Introduction of the TV, or Radio
• Railroads
• Sharing or “Gig” Economy: UBER, Door Dash
• Enthusiasm is usually chart based. Hedge funds and options can
amplify the up and downward volatility
• “This thing is going to the Moon!”
• Downside? Gravity, i.e. Momentum can falter, stories can unravel and
the big money is ruthless. There is no true (stock) love!!!
3/17/2021 20After the (stock) love is gone…..
Formerly known as JDS Uniphase,
this became one of the most
powerful Momentum stocks in
history, prior to 2020
3/17/2021 21Is One Investing Approach Better than Another?
• Any stock can outperform the “market” for a day, a week, a month
• The Key is the baseline for EXPECTATIONS, built into the stock today
• Since the pandemic downturn, this has been a Momentum Market
• Styles or Factors can “work” or “not work” for extended periods
• Good Managers develop a thorough and consistent process
• Bad managers often chase what appears to be working now
• “Style Drift” means being inconsistent, modifying the investment
process. (When does “adaptable and flexible” become “style drift?”)
• Factor Tilts: Growth? Value? Quality? Size? Low Vol?
3/17/2021 22Beware of Behavioral Bias!
• Investing: not always coldly rational and, at times, hotly irrational
• Hence, our biases influence our investing behavior
• Risk is Subjective: i.e. each of us views risk differently
• No two investors interpret Facts and Fundamentals the same
• Decision makers are inherently inconsistent even within themselves
• Investors make cognitive errors
Self-Deception: “I am an expert now in epidemiology”
Emotion: “I am such a genius” or “I am such an idiot!”
Social Influence: FOMO*, stock tips from the UBER driver
Heuristic simplification: (bad rules of thumb)
* Fear of Missing Out.
3/17/2021 23Common Biases
(For Future Study)
• Overconfidence and illusion of control
• Self-Attribution Bias
• Hindsight Bias
• Confirmation Bias
• The Narrative Fallacy
• Representative Bias
• Framing Bias
• Anchoring Bias
• Loss Aversion
• Herd Mentality
3/17/2021 24Summary
• Equity Investing is part art, part science
• Stocks reflect the sum of the beliefs of all market participants
• Some say it is not a stock market, but a market of stocks
• If it were easy or predictable, all profits would be quickly arbitraged
away: i.e. everything instantly would get to where it should be
• There are many different factors/styles, and no factor/style works
always or in every investing environment
• Consistency and flexibility are both important, but hard to reconcile
• Every investor has certain investing preferences
• Every investor also has behavioral biases
• It is hard to win, harder to win consistently, and even harder to
predict who will win consistently
3/17/2021 25Appendix: Investing Glossary
P/E: Price/earnings ratio, and shorthand measure of stock valuation. Low is preferred to High.
“Market Cap”: Short for market capitalization. Shares outstanding X share price = market cap. Amazon
and Apple have a high or large market caps, while TG Therapeutics is fairly small
Net Margin: Net income divided by revenue. High is preferred to low, but good stocks can have low
margins too. Improving margin is preferred to deteriorating.
eps: Earnings per share, or net income/shares outstanding
P/E to Growth: Price/earnings ratio per unit of growth, either backward or more likely forward looking.
High values mean “expensive” and low values mean “cheap.” One does must ask about the quality and
sustainability of the growth measure. Is it due to unusual items, recovery from some disaster, etc.
Market Cap to Rev: Often contrasted or compared with net mgn. Stocks with High Mkt Cap/Rev often
also have very high net mgn, and vice versa. High Market Cap to Revenue might mean “expensive.”
Debt/Equity: Total debt outstanding divided by book equity value. This indicates the degree of leverage.
High borrowing usually has high interest expense and can indicate vulnerability to any downturn. Low
debt is preferred, but not necessarily no debt. Prudent borrowing can augment returns.
Interest Coverage: Cash flow to interest expense. More cash flow provides a cushion for making interest
payments. Bond analysts like this number, as do lenders.
Size; e.g. Large Cap, Small Cap: Refers to market capitalization, but can also be measured by revenue
or assets. They do not always go together.
3/17/2021 26You can also read