DYNAMIC GROWTH AND RECORD MARGINS IN FIRST HALF OF 2016 - SIKA INVESTOR PRESENTATION SEPTEMBER, 2016 - Sika Investor ...
←
→
Page content transcription
If your browser does not render page correctly, please read the page content below

DYNAMIC GROWTH AND RECORD MARGINS IN
FIRST HALF OF 2016

SIKA INVESTOR PRESENTATION
SEPTEMBER, 2016

1. HIGHLIGHTS AND RESULTS FIRST HALF-YEAR 2016

DYNAMIC GROWTH AND RECORD MARGINS IN FIRST HALF OF 2016 Sales growth of 7.6% (6.9% in CHF) to CHF 2,806 million Growth in all regions: Double-digit in the USA, Canada, Argentina, Chile, UK, Africa, Southeast Asia, the Pacific area, and Automotive High growth in profitability: EBIT +22.6%, net profit +24.8% leading to record margins: EBIT margin 12.6%, net profit margin 8.8% 6 new production plants in Greece, Myanmar, Cambodia, Canada, Thailand and Ecuador New national subsidiaries in Kuwait and Nicaragua Acquisition of L.M. Scofield in the USA Confirmation of annual targets of 6–8% sales growth and disproportionately higher growth in profitability 3
KEY FIGURES HALF-YEAR 2016
ABOVE-AVERAGE INCREASE IN PROFIT

    in CHF mn                           2015      2016      Δ%
    Net sales                         2,625.2   2,806.2     6.9%
    Gross results as % of net sales     54.4      55.6
    EBITDA                             370.2     439.7    +18.8%
    EBIT                               288.6     353.7    +22.6%
    Net profit                         197.3     246.3    +24.8%

    Operating free cash flow            43.0     106.0
    ROCE in %                           22.8      25.5

4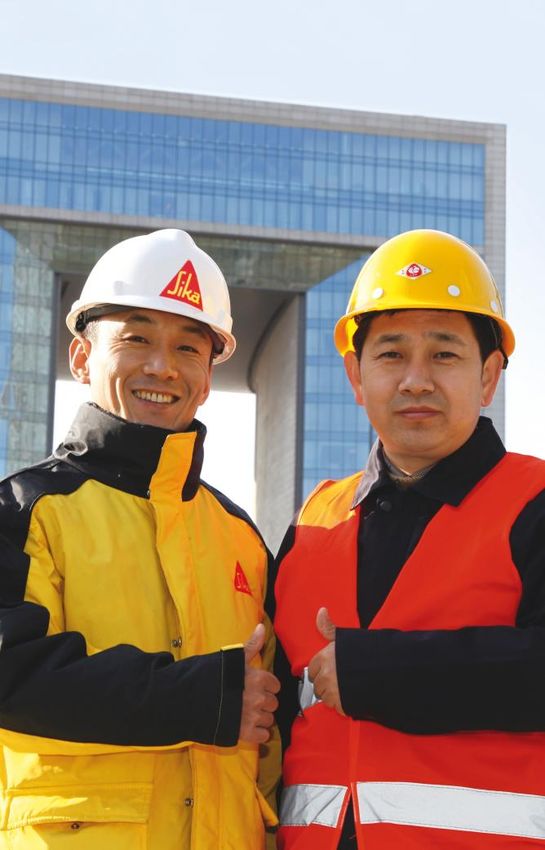
SALES GROWTH BY QUARTER
 STRONG ORGANIC GROWTH WITH 6.5%
                      12%

                      10%

                                                           8.3%      8.3%
                                                                              7.0%
                      8%

                                        6.0%               2.5%      2.9%     0.5%
                      6%

                             5.1%                5.3%
in LC                        1.1%       2.6%
        acquisition
                      4%
                                                  2.2%
        organic
                      2%

                             4.0%       3.4%      3.1%     5.8%      5.4%     6.5%

                      0%

                             Q1 PY     Q2 PY     Q3 PY     Q4 PY     Q1 CY    Q2 CY

in CHF mn                    Q1 15    Q2 15     Q3 15     Q4 15     Q1 16     Q2 16
Quarterly
                            1,195.3   1,429.9   1,469.8   1,394.2   1,274.4   1,531.8
sales

 5
SALES HALF-YEAR 2016
GROWTH IN ALL REGIONS
    + 7.5 %     +15.9 %       - 9.8 %       + 5.3 %        Growth in CHF
    + 6.6 %     +12.7 %       + 5.9 %       + 4.6 %        Growth in LC
    + 0.9 %     + 3.2 %       - 15.7 %       + 0.7 %       FX impact
    + 2.4 %     + 1.7 %       + 0.0 %        + 1.1 %       Acquisition

                                                                       22%
                                                                          78%

                                                                       Construction
                                                                       Industry

     1,335        441           274            510
                                                           in CHF mn
     EMEA     North America Latin America   Asia/Pacific
6
GROWTH MOMENTUM CONTINUES HALF-YEAR 2016
 7.6% SALES GROWTH (6.9% IN CHF)

            + 12.7%                            + 6.6%

                                                              + 4.6%
        381 441
      North America

                                                             484 510
                                 + 5.9%
                                                            Asia/Pacific

                                              1,242 1,335
                                304 274          EMEA
                              Latin America

 HY 1 / 2015    HY 1 / 2016
(in CHF million, growth in LC)

 7
FIVE-YEAR OVERVIEW – HALF-YEAR FIGURES
CONTINUOUSLY IMPROVING MARGINS
                                                            275                                                  9.0 %

     EBIT IN CHF
    400

                                           12.6%                  NET PROFIT IN CHF                    8.8%

                                                                                                        +24.8%
                                                   12. 0%

    375

                                  11.0%   +22.6%
                                                            250

                                                                                                                 8.0 %

                                                                                                7.5%      246
    350

          In % of sales   10.0%            354                           In % of sales
                                                            225
                                                   10. 0%

    325

                   9.2%                                                                  6.7%                    7.0 %

          8.6%
    300

                                                            200

                                                   8.0 %                    5.9%
    275
                                   289                                                          197              6.0 %

                                                                  5.4%
                          266
                                                            175

    250

                                                                                         178
                                                   6.0 %

                                                                                                                 5.0 %

    225

                                                            150

                    220
    200

                                                   4.0 %
                                                                            141                                  4.0 %

          198                                               125

    175

                                                                   125
    150                                            2.0 %
                                                            100                                                  3.0 %

          2012     2013   2014    2015    2016                    2012     2013      2014       2015     2016

8
ACCELERATED BUILD-UP OF GROWTH MARKETS
INVESTMENTS IN FIRST HALF YEAR 2016
Opening of Sika plants:
2nd plant in Greece (Kryoneri (Athens), January 2016)
1st plant in Myanmar (Yangon, February 2016)
1st plant in Cambodia (Phnom Penh, February 2016)
4th plant in Canada (Vancouver, March 2016)
2nd plant in Thailand (Saraburi, June 2016)
2nd plant in Ecuador (Guayaquil, June 2016)
New national subsidiaries:
Kuwait (March 2016)
Nicaragua (June 2016)
New Sika plant, Thailand
9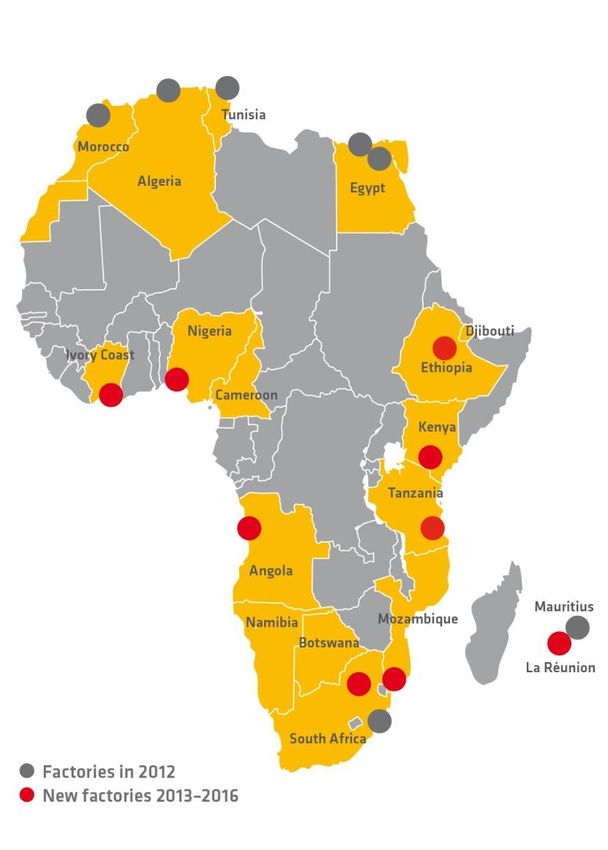
ACCELERATED BUILD-UP OF GROWTH MARKETS ACQUISITION IN FIRST HALF YEAR 2016 L.M. Scofield, USA US‐based market leader for concrete color additives (ready‐mixed concrete) and decorative treatments for refurbishment Buying new technology and spreading it out to Sika’s existing customer base Continued strong execution of Sika’s growth strategy in North America 10
GOOD START IN Q3 2016
KEY INITIATIVES CONTINUE
Acquisition of fiber producer FRC Industries in
Tuscaloosa, Alabama, USA (September 2016)
New plant in Perth, Australia (July, 2016)
New national subsidiaries in Cameroon
and Djibouti (August 2016)
– now 97 countries with own Sika operations
Sika plant in Perth, Australia
11OUTLOOK CONFIRMATION OF 2016 ANNUAL TARGETS 6-8% sales growth Disproportionately higher rise in margins Opening of 8 to 10 new factories 3 to 4 new national subsidiaries Unknown outcome of Saint-Gobain’s hostile takeover attempt 12
2. SUCCESSFUL STRATEGY 2018 EXECUTION
FIVE-YEAR OVERVIEW - NET SALES AND EBIT
CONTINUATION OF PROFITABLE GROWTH STRATEGY

14
STRATEGY 2018
SIKA’S GROWTH MODEL WILL DELIVER

       MARKET PENETRATION
                                   6 - 8% GROWTH PER YEAR

                                    6 - 8 NEW PLANTS PER
       INNOVATION                           YEAR

                                       100 NATIONAL
                                    SUBSIDIARIES BY 2018
       EMERGING MARKETS
                                     12 - 14% OPERATING
                                      PROFIT PER YEAR

       ACQUISITIONS                 > 8% OPERATING FREE
                                    CASH FLOW PER YEAR

                                   25% RETURN ON CAPITAL
                                     EMPLOYED BY 2018
       VALUES

15 |
STRATEGY 2018 – ACHIEVEMENTS SINCE 2012
A PROVEN TRACK RECORD OF DELIVERY
PILLARS OF THE GROWTH MODEL ACHIEVEMENTS
• Successful Target Market concept
MARKET PENETRATION • Megatrends driving growth
• 333 new patents filed
INNOVATION • 20 Global Technology Centers
• 51 new plants opened
EMERGING MARKETS • 20 new national subsidiaries
• 19 Acquisitions in all regions
ACQUISITIONS • CHF 587 million sales added
• Strong corporate culture
VALUES • High employee loyalty
16MARKET PENETRATION FOCUS ON ATTRACTIVE MARKETS: CROSS-SELLING, LIFE-CYCLE MANAGEMENT, A STRONG BRAND Concrete Waterproofing Roofing Flooring & Coating Sealing & Bonding Refurbishment Industry 17
MEGATRENDS DRIVE OUR GROWTH:
URBANIZATION, NEW VEHICLE DESIGN & SUSTAINABILITY

                                         Increasing world
                                         population with
          Higher demand for              urbanization and           Increased safety, fire,
          infrastructure and                megacities              water, earthquake and
            refurbishment                                           quality requirements
               solutions

       Sustainability:                                                        Rising demand for
     Increasing demand                                                        high performance
     for safe-to-use and                                                       concrete, sealing
        low-emission                                                          and waterproofing
           products

                                                          New modular
                           New vehicle design                 vehicle
                           with material mix              manufacturing
                            requires bonding            concepts need fast,
                               solutions                   high strength
                                                         bonding systems

18
WE ARE INNOVATION
STRONG TRACK RECORD
333 880 377 20
Patents were Employees are Invention Technology
filed since dedicated to disclosures Centers
2012 Research and since 2012 world-wide
Development
19EMERGING MARKETS BUILD-UP SINCE 2012 GROWTH POTENTIAL IN NEW MARKETS 51 12.5% 20 37% New Average sales New of turnover plants growth national in Emerging opened subsidiaries Markets 20
ACQUISITIONS SINCE 2012
GROWTH PLATFORMS FOR THE FUTURE

                                  In all    In all

     19 587 7                               4
     Acquisitions   million CHF   Target    Regions
                    turnover      Markets

21
SIKA’S VALUES AND PRINCIPLES STRONG CORPORATE CULTURE Customer first Courage for innovation Sustainability & Integrity Empowerment and Respect Manage for results 22
3. TWO EXAMPLES OF STRATEGY EXECUTION
IN THE REGIONS
STRONG STRATEGY EXECUTION IN AFRICA
+22% 9
sales growth in H1 2016 new plants
since 2012
18 subsidiaries
688
10 added
employees
since 2012
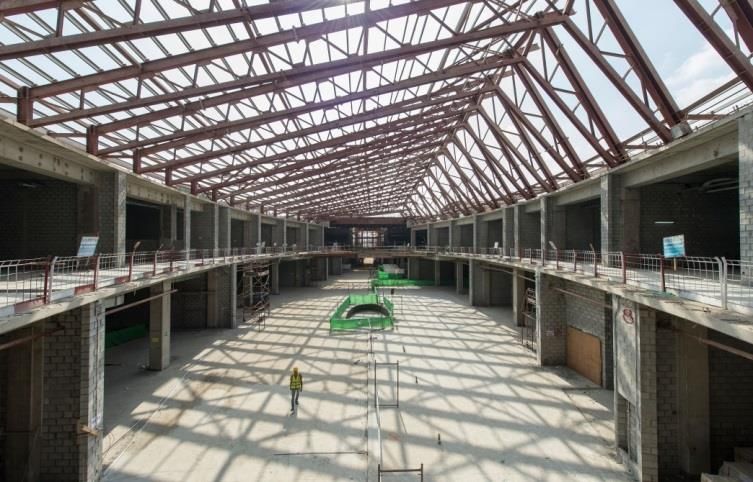
24MAJOR CONSTRUCTION PROJECTS WITH SIKA PRODUCTS Bridge over Maputo Bay, Mozambique Dangote fertilizer plant Lagos, Nigeria Luanda International Airport, Angola Mall of Egypt, Cairo, Egypt 25
ACCELERATED BUILD UP OF PRESENCE IN USA

                                  22    plants in USA and
                                  Canada

                                  10    new plants added
                                  since 2012

                                  Presence in residential

Investment focus   13%            market through Home Depot

on fast growing    sales growth   (2,000 stores) and
metro areas        in H1 2016     Lowes (1,800 stores)

26
HUDSON YARDS PROJECT NYC SIKA IS HELPING TO BUILD A NEW CITY IN A CITY 27
4. SAINT-GOBAIN’S HOSTILE TAKEOVER ATTEMPT
FUNDAMENTAL REASONS TO OPPOSE HOSTILE TAKEOVER
ATTEMPT BY SAINT-GOBAIN
1.   Lack of industrial logic

2.   Saint-Gobain will execute control with only 16% of the capital

3.   No adequate representation of public shareholders on the Board

4.   Saint-Gobain is a direct competitor of Sika

5.   Sika loses A- credit rating

6.   Sika’s Growth Model at risk

29
SIKA ARTICLES OF ASSOCIATION ARTICLE 4
RESTRICTION OF TRANSFERABILITY, THE 5% THRESHOLD

“The Board of Directors reserves the right to refuse an acquirer of registered shares as
shareholder, if the number of registered shares held by him exceeds 5% of the total number
of registered shares entered in the commercial register.
[…¨]natural persons or legal entities or, which act in concert in view of a circumvention of
registration limitations, are regarded under these provisions as a single buyer.”

Many other Swiss companies have a similar restriction of transferability with a threshold
(Vinkulierung) such as: Nestlé, Novartis, Swatch, Swisscom, Guivaudan, Sonova, Schindler,
Lindt & Sprüngli.

30
FORWARD-LOOKING STATEMENTS
This presentation contains certain forward-looking statements. These forward-looking statements may be identified by words
such as ‘expects’, ‘believes’, ‘estimates’, ‘anticipates’, ‘projects’, ‘intends’, ‘should’, ‘seeks’, ‘future’ or similar expressions or by
discussion of, among other things, strategy, goals, plans or intentions. Various factors may cause actual results to differ
materially in the future from those reflected in forward-looking statements contained in this presentation, among others:
Fluctuations in currency exchange rates and general financial market conditions
Interruptions in production
Legislative and regulatory developments and economic conditions
Delay or inability in obtaining regulatory approvals or bringing products to market
Pricing and product initiatives of competitors
Uncertainties in the discovery, development or marketing of new products or new uses of existing products, including
without limitation negative results of research projects, unexpected side-effects of pipeline or marketed products
Increased government pricing pressures
Loss of inability to obtain adequate protection for intellectual property rights
Litigation
Loss of key executives or other employees
Adverse publicity and news coverage.
Any statements regarding earnings per share growth is not a profit forecast and should not be interpreted to mean that Sika’s
earnings or earnings per share for this year or any subsequent period will necessarily match or exceed the historical published
earnings or earnings per share of Sika.
For marketed products discussed in this presentation, please see information on our website: www.sika.com
All mentioned trademarks are legally protected.
31THANK YOU FOR YOUR ATTENTION
You can also read