Q1 2021 TALLINK GRUPP AS - Two-Factor Authentication

Page created by Vernon Mendoza
 
CONTINUE READING
Q1 2021 TALLINK GRUPP AS - Two-Factor Authentication
Q1 2021
TALLINK GRUPP AS
Q1 2021 TALLINK GRUPP AS - Two-Factor Authentication
TALLINK GRUPP

 The leading European provider of leisure and business travel
 and sea transportation services in the Baltic Sea region.

 OPERATIONS
 •     Fleet of 15 vessels
 •     Seven ferry routes (3 suspended)
 •     Operating four hotels (3 closed until 2021 high season)

 KEY FACTS                                                         STRONG BRANDS
 •     Revenue of EUR 443 million in 2020
 •     Served 3.7 million passengers in 2020
 •     Transported 360 thousand cargo units
 •     Operating EUR 1.5 billion asset base
 •     3 953 employees (end of Q1 2021)
 •     2.8 million loyalty program members

                                LISTED ON NASDAQ TALLINN (TAL1T) AND NASDAQ HELSINKI (TALLINK)
                                                                                                 2
TALLINK
GRUPP
Q1 2021 TALLINK GRUPP AS - Two-Factor Authentication
STRATEGIC PLAN
                     CURRENTLY THE STRATEGIC FOCUS IS ON MANAGING COSTS AND CASH FLOWS TO ENSURE
                          SUSTAINABILITY AND TO BRING TALLINK GRUPP THROUGH THE GLOBAL CRISIS

 TALLINK’S VISION
                                   To be the market pioneer in Europe by offering excellence
                                 in leisure and business travel and sea transportation services

 LONG TERM OBJECTIVES TOWARD INCREASING THE                           CURRENT STRATEGIC CORNERSTONES
 COMPANY VALUE AND PROFITABILITY                                        AND COMPETITIVE ADVANTAGES
          •   Strive for the highest level of customer satisfaction
          •   Increase volumes and strengthen the leading position    MOST MODERN          STRONG MARKET SHARE
              on our home markets                                                           & BRAND AWARENESS
                                                                         FLEET
          •   Develop a wide range of quality services directed at
              different customers and pursue new growth
              opportunities
          •   Ensure cost efficient operations                                              HIGH SAFETY LEVEL &
                                                                      WIDE ROUTE
          •   Manage the optimal debt level that will allow                                   ENVIRONMENTAL
                                                                       NETWORK
              sustainable dividends                                                             STANDARDS
                                                                                                                  3
TALLINK
GRUPP
Q1 2021 TALLINK GRUPP AS - Two-Factor Authentication
STEPS TAKEN TO KEEP PROVIDING SAFE TRAVELLING
FOCUS ON FLEXIBILITY, COSTS AND LIQUIDITY

 •    Strict hygiene and disinfecting procedures and requirements
 •    Temporary suspension of ship and hotel operations
 •    Activities to ensure liquidity

 •    Scaled down on non-critical costs and investments
 •    Cost savings from previously implemented measures
 •    Applying for various support measures

 •    No dividends proposed by Management
 •    Postponement of investments, taxes
 •    Negotiations with financial institutions to amend and
      prolong the waivers of financial covenants and to postpone
      principal payments under existing loan agreements
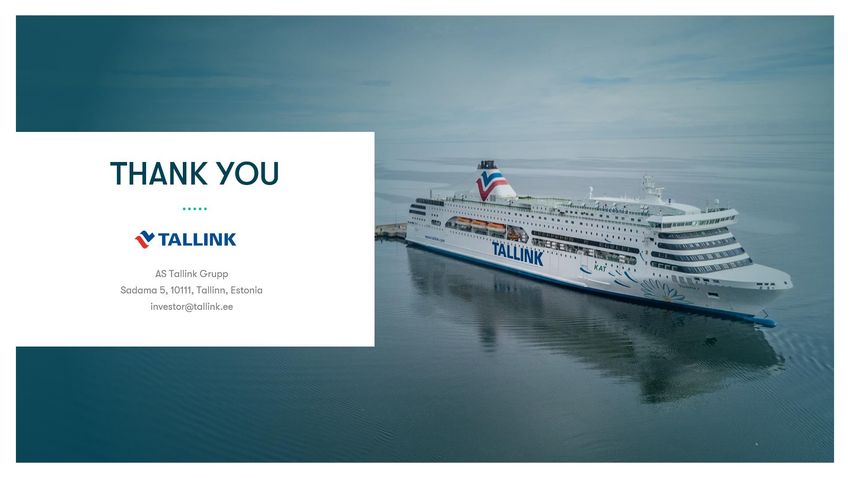
                                                                    Silja Serenade in Riga

                                   STRATEGIC FOCUS ON MANAGING COSTS AND CASH FLOWS
                                                                                             4
TALLINK
GRUPP
Q1 2021 TALLINK GRUPP AS - Two-Factor Authentication
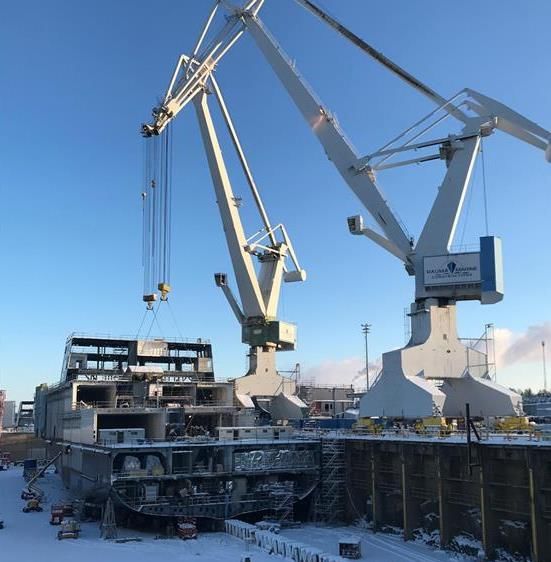
Q1 2021 OVERVIEW – COVID-19 & TRAVEL RESTRICTIONS
 Q1 Selected Key Figures
                                   2021        2020     Change
 (financials in million euros)
 Number of passengers            267 224    1 566 730    -82.9%   •   Revenue EUR 53.7m (EUR -101.2m or -65.3% vs LY)
 Number of cargo units            85 156       99 617    -14.5%       —   Extensive impact from Covid-19 related travel restrictions
 Number of passenger cars         75 815     190 292     -60.2%       —   More limited impact on cargo operations
                                                                      —   16% less departures compared to Q1 2020
 Revenue                            53.7       154.9     -65.3%
 Gross profit / loss               -20.0         -0.2      -
 EBITDA                              -6.3        -1.3   -400.6%   •   Cost reduction & support
 EBIT                              -30.0       -26.0     -15.2%       —   Cost of sales reduced by 52% or EUR 81m
 Net result for the period         -34.4       -30.2     -14.0%       —   Administrative & marketing cost reduced by 45% or EUR 12m
                                                                      —   Direct financial support of EUR 5.0m in Q1 2021
 Capital expenditures                4.2         27.1    -84.5%

 As at:                          31.03.21    31.12.20   Change
                                                                  •   EBITDA of EUR -6.3m (EUR -5.1m vs LY)
 Total assets                     1 492.5     1 516.2     -1.6%
 Total equity                      680.1        714.3     -4.8%
                                                                  •   Net loss of EUR 34.4m (EUR -4.2m vs LY)
 Interest-bearing liabilities      728.3        705.1      3.3%
 Net debt                           713.5      677.3      5.4%
2021 unaudited

                                                                                                                                       5
TALLINK
GRUPP
Q1 2021 TALLINK GRUPP AS - Two-Factor Authentication
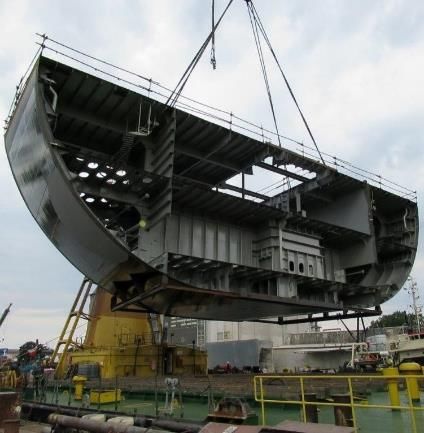
Q1 2021 SALES & RESULTS BY GEOGRAPHICAL SEGMENTS
                  Key Figures
  Route                                                                 2021            2020    Change     All routes affected by Covid-19, travel restrictions & suspension of operations
                  (financial in EUR million)
  Estonia-        Passengers (thousands)                                   201           848     -76.2%
  Finland
                  Cargo units (thousands)                                   58            65      -11.0%    The results reflect the operations of the Estonia-Finland two shuttle
                  Revenue                                                24.8            59.2    -58.1%     and one cargo vessel, operations of Silja Europa were suspended
                  Segment result                                          -4.9            3.3   -251.5%
  Finland-        Passengers (thousands)                                    56           470     -88.1%
  Sweden
                  Cargo units (thousands)                                    17            21     -17.6%
                                                                                                            The results reflect the operations of two cruise ferries on Turku-
                                                                                                            Stockholm route and two suspended Helsinki-Stockholm route cruise
                  Revenue                                                 14.8           57.2    -74.1%
                                                                                                            ferries
                  Segment result                                         -13.3           -8.2    -63.5%
  Estonia-        Passengers (thousands)                                     10           141    -93.1%
  Sweden
                  Cargo units (thousands)                                    11            11     -4.2%     The results reflect the operations of two cargo vessels on Paldiski-
                  Revenue                                                  4.9           17.2     -71.2%    Kapellskär route and two suspended cruise ferries
                  Segment result                                          -3.2           -4.7     32.0%
  Latvia-         Passengers (thousands)                                      0          109    -100.0%
  Sweden
                  Cargo units (thousands)                                     0            3    -100.0%     The Latvia-Sweden route result reflects expenses of two suspended
                  Revenue                                                  0.0           10.1   -100.0%     cruise ferries
                  Segment result                                          -3.5           -5.3     34.4%
  Other           Revenue                                                  9.2           12.5    -26.0%
                                                                                                            Effectively only one hotel operated; positive impact from online shop
                  Segment result                                          -0.1            0.8    -108.1%
                                                                                                            sales, Burger King restaurants and from mooring services
                  Intersegment revenue                                     0.0           -1.3     99.2%
                                                                                                                                                                                             6
TALLINK
 Segment result is the result before administrative expenses, finance costs and taxes
GRUPP
2021 unaudited
Q1 2021 TALLINK GRUPP AS - Two-Factor Authentication
Q1 2021 SALES & RESULTS BY OPERATIONAL SEGMENTS

    Revenue (EUR million)                            2021    2020    Change    REVENUE STRUCTURE IN Q1 2021
    Restaurant and shop sales on-board and onshore   20.2     86.9    -76.8%
    Ticket sales                                      7.6     31.6    -76.0%
    Sales of cargo transportation                     22.1    28.1    -21.6%
    Accommodation sales                                0.1     2.1    -95.3%
    Income from charter of vessels                    2.3      2.5     -8.1%
    Other sales                                        1.5     3.7    -59.1%                                 Cargo
                                                                                                              41%
    Total revenue                                    53.7    154.9    -65.3%

                                                                               Restaurant &
•       Restaurant and shop sales on-board and onshore and ticket               shops sales
                                                                                   38%
        sales decline driven by decline in passengers
•       Lower cargo sales due to absence of operation of six vessels
        on long routes (i.e. from Stockholm to Helsinki, Tallinn and                                                        Accommodation
        Riga), weak market and tight price competition                                        Ticket sales               Leases 0%
                                                                                                  14%                      4%
                                                                                                                     Other
•       Effectively only one hotel operated in Q1 2021                                                                3%

•       Adjustment in charter agreement effective from Q4 2020
 2021 unaudited
                                                                                                                                            7
TALLINK
GRUPP
Q1 2021 TALLINK GRUPP AS - Two-Factor Authentication
RESULTS
QUARTERLY SEASONALITY BREAKDOWN

                                    PASSENGERS (MILLIONS)                                 CARGO (TH. UNITS)

                 10          9.8        9.8                                        385
                                                                             400            380        360
                             2.2        2.3
                  8                                                                98        94         82
                                                                             300                                           Q4
                  6          2.9        3.0                                        95        93         92                 Q3
                                                  3.7                        200
                  4                                                                                                        Q2
                             2.6        2.7              0.5                       101       100        87
                                                  1.3                        100
                  2                                      0.4                                                               Q1
                             1.9        1.9       1.6                               91       93        100       85
                                                               0.3
                  0                                                           0
                             2018      2019      2020          2021                2018     2019       2020      2021

                                    REVENUE (EUR MILLION)                                 EBITDA (EUR MILLION)
                              950       949                                                  171
              1000                                                           170
                                                                                   143       33
                800           227       226                                  140
                                                                                   24                                      Q4
                600           284       288                                  110
                                                  443                                        83                            Q3
                                                                              80    71
                400                                79                                                                      Q2
                              255       256       144                         50
                200                                65                                        51                            Q1
                              184        179                                  20    44                  8
                                                  155            54
                   0                                                                4        4                    -6 (1)
                                                                       (1)   -10
                             2018       2019      2020          2021               2018     2019       2020      2021
                                                                                                                                8
TALLINK   Notes:
GRUPP     (1)    Unaudited
Q1 2021 TALLINK GRUPP AS - Two-Factor Authentication
THE DYNAMICS OF HIGH SEASONALITY ON THE PROFIT LEVEL
NET PROFIT BY QUARTERS (EUR MILLION)

                                                                                                                                 (1)
                        2018 net profit 40              2019 net profit 50      2020 net loss -108      2021 Q1 net result -34
          60

          50

          40

          30
                                                                    55
                                          46
          20

          10
                                   15                          15
           0
                                                                         5
                                               -2
          -10            -20                                                                -24
                                                         -25                          -27
                                                                                -30                       -34
          -20                                                                                     -27

          -30

          -40

                                        MOST OF THE PROFITS ARE TYPICALLY EARNED IN THE SUMMER, THE HIGH SEASON

                                                                                                                                       9
TALLINK         Notes:
GRUPP           (1)    Unaudited
Q1 2021 TALLINK GRUPP AS - Two-Factor Authentication
2021 Q1 HIGHLIGHTS AND KEY FACTS

  ENVIRONMENT AND ADJUSTMENTS
     •    Extensive impact of Covid-19 and suspension of cruise
          ferries operations
     •    Stricter restrictions imposed by the governments

  ACTIVITIES TOWARD LONG-TERM SUSTAINABILITY
     •    Continuous cost control to ensure efficiency and savings
          from previously implemented measures
     •    Opening of second Burger King restaurant in Latvia
     •    Legal action against Port of Tallinn filed
          –   EUR 15.4 million damage compensation claim for abusing
              the dominant position on the market for provision of port
              services in Old City Harbour                                Image courtesy of RMC

                                                                                                  10
TALLINK
GRUPP
EVENTS AFTER THE REPORTING PERIOD & OUTLOOK

                                               •   In June 2021, two new Burger King restaurants are planned to be
                                                   opened in Latvia. Ongoing preparations for opening 5 more
                                                   Burger King restaurants in 2021

                                               •   Completion of renovation and planned reopening of Tallink City
                                                   Hotel in June 2021

                                               •   Progress regarding vaccinations in Group’s main markets in
   Rendering of renovated Tallink City hotel
                                                   Estonia and Finland provides a positive outlook for traffic
                                                   recovery between countries

   Due to the ongoing Covid-19 situation the earnings outlook is uncertain and continues to be largely subject to
   external factors such as the progress of vaccinations, states’ decisions regarding the timing of lifting of the
   travel restrictions, allowing passenger traffic as well as the duration of the recovery period.
   Management expects the passenger traffic between Estonia and Finland to recover rapidly after the
   restrictions have been lifted.

                                                                                                                 11
TALLINK
GRUPP
CONSOLIDATED INCOME STATEMENT

                                                                                                                                                     (3)
                                                                            2019                                        2020     Q1 2020   Q1 2021
 (EUR million)

 Sales                                                                       949                                         443       155       54

  Cost of sales (1)                                                         (752)                                       (486)     (155)     (74)

  Marketing & administrative cost (1)                                        (125)                                       (86)     (27)      (15)

  Other operating items, net (2)                                                2                                          37       2        5

 EBITDA                                                                       171                                          8       (1)       (6)

  Margin (%)                                                                18.0%                                        1.8%    (0.8%)    (11.7%)

 Net Result                                                                   50                                        (108)      (30)     (34)

 EPS                                                                        0.074                                      (0.162)   (0.045)   (0.051)

            Totals may not sum due to rounding

                                                                                                                                                           12
TALLINK     (1)     Includes depreciation and amortization
GRUPP       (2)     Q1 2021 includes EUR 5.0m direct financial support; 2020 includes EUR 36.6m net direct financial support
            (3)     Unaudited
CONSOLIDATED CASH FLOW STATEMENT

                                                                                                              (1)
   (EUR million)                                  2019                2020                Q1 2020   Q1 2021

   Operating cash flow                            175                  (7)                   1        (22)

     Capital expenditure                          (61)                (100)                 (27)      (4)

     Asset disposal                                0                    0                    0         0

   Free cash flow                                 114                 (107)                 (26)      (26)

     Debt financing (net effect)                  (52)                 112                   9        19

     Interests & other financial items            (17)                 (16)                 (5)       (5)

     Dividends & reduction of share capital       (80)                  0                    0         0

     Income tax on dividends paid                 (8)                   0                    0         0

   Change in cash                                 (43)                 (11)                 (22)      (13)
  Totals may not sum due to rounding
  (1)     Unaudited

                                                                                                                    13
TALLINK
GRUPP
                                              CASH FLOW GENERATION AFFECTED BY COVID-19
CONSOLIDATED STATEMENT OF FINANCIAL POSITION

    (EUR million)                                                31.12.2019   31.03.2020   31.12.2020   31.03.2021 (2)   1500      Cash
                                                                                                                                Intangibles       Other
                                                                                                                                                liabilities

    Total assets                                                   1 533        1 518        1 516         1 493                 Other
                                                                                                                                 assets
      Non-current assets                                           1 412         1 419       1 427         1 410
       Current assets                                               121           99          89            83                                    Share-
                                                                                                                                                 holders
                                                                                                                                                 ’ equity
       - of which cash                                              39            16          28            15           1000

    Total liabilities                                               710          725          802          812
      Interest bearing liabilities                                  578          591          705          728
      Other liabilities                                             132          134          97            84
                                                                                                                                  Ships
    Shareholders’ equity                                            823          793          714          680           500

                                                                                                                                                 Loans
    Net debt/EBITDA                                                 3.1x         3.5x        84.2x        238.7x
    Net debt                                                        539          575          677           714
    Equity/assets ratio                                            54%           52%          47%          46%
                                                                                                                           0
    BVPS (1) (in EUR)                                               1.23         1.18         1.07         1.02
                                                                                                                                Assets        Liabilities &
   Totals may not sum due to rounding                                                                                                            Equity
   (1)     Shareholders’ equity / number of shares outstanding
   (2)     Unaudited

                                                                                                                                                              14
TALLINK
GRUPP
                                       AT THE END OF THE QUARTER TOTAL LIQUIDITY EUR 96.4 MILLION (EUR 79.2 MILLION IN 2020 Q1)
DEBT STRUCTURE

   LONG TERM BANK LOANS                                                      Total EUR 728 million interest bearing liabilities as at 31.03.2021
          — EUR 572 million as at 31.03.2021                                 800                                                                       5.0
          — 7 loan agreements outstanding: syndicated loans,

                                                               EUR million
                                                                             700
            amortizing project and working capital loans                                                                                               4.0
          — Maturities 1-8 years                                             600
          — EUR denominated, fixed and EURIBOR floating                                                                                                3.0
                                                                             500

                                                                             400                                                                       2.0
   OVERDRAFTS (as at 31.03.2021)
          — EUR 53 million used                                              300                                                587          572
                                                                                                     510                                               1.0
          — EUR 82 million unused                                                      469                         476
                                                                             200
                                                                                                                                                       -
                                                                             100
   SIGNED, NOT YET DRAWN
          — EUR 198 million from KfW IPEX-Bank GmbH (MyStar)                   0                                                                       (1.0)
                                                                                    31.12.2017    31.12.2018    31.12.2019   31.12.2020   31.03.2021
          — EUR 90 million undrawn of EUR 100 million                                            Long term debt                    Bond
            working capital loan from Nordic Investment Bank

   2021 unaudited

                        ONGOING NEGOTIATIONS TO POSTPONE PRINCIPAL PAYMENTS UNDER EXISTING LOAN AGREEMENTS
                                                                                                                                                       15
TALLINK
GRUPP
CORPORATE GOVERNANCE

                   Paavo Nõgene – Chairman of the Management Board                                                     Enn Pant - Chairman of the Supervisory Board
                           Born in 1980, with the company since 2018
                                                                                                                                  Born in 1965, with the company since 1996
                           CEO since May, 2018
                                                                                                                                  Chairman of the Supervisory Board since 2015
                           Previously:
                           – Secretary-General at Ministry of Culture of the Republic of Estonia                                  CEO of AS Tallink Grupp in 1996-2015
                           – General Manager at Vanemuine Theatre
MANAGEMENT BOARD

                                                                                                   SUPERVISORY BOARD
                                                                                                                          Toivo Ninnas                             Kalev Järvelill
                      Lembit Kitter                               Kadri Land
                                                                                                                            Born in 1940,                                Born in 1965,
                                                                         Born in 1964,                                      with the Supervisory                         with the Supervisory
                           Born in 1953,                                 with the company                                   Board since 1997                             Board since 2007
                           with the company                              since 2005.
                           and Member of
                           Management Board                              Member of
                                                                         Management Board                                  Eve Pant                               Ain Hanschmidt
                           since 2006
                                                                         since February, 2019
                                                                                                                            Born in 1968,                                Born in 1961,
                                                                                                                            with the Supervisory                         with the Supervisory
                                                                                                                            Board since 1997                             Board since 2005
                    Harri Hanschmidt                         Piret Mürk-Dubout
                           Born in 1982,
                           with the company                              Born in 1970,                                    Raino Paron                          Colin Douglas Clark
                           since 2009.                                   with the company
                                                                         and Member of                                      Born in 1965,                                Born in 1974,
                           Member of                                     Management Board                                                                                with the Supervisory
                                                                                                                            with the Supervisory
                           Management Board                              since April, 2019                                                                               Board since 2013
                                                                                                                            Board since 2019
                           since February, 2019

                                                                                                                                                                                                16
TALLINK
GRUPP
SHAREHOLDERS AND SHARE PERFORMANCE

      SHAREHOLDERS OF AS TALLINK GRUPP                         TEN LARGEST SHAREHOLDERS AS OF 31.03.2021
                                                        Infortar AS                                                                 39%
                                                        Baltic Cruises Holding, L.P.                                                16%
                                                        ING Luxembourg S.A. AIF Account                                              7%
                                                        Baltic Cruises Investment L.P.                                               6%
                                                        Nordea Bank Abp / Clients FDR                                                2%
                                                        Citigroup Venture Capital International G.P                                  2%
                               Infortar                 Nordea Bank Abp / Finnish Clients                                            2%
                                 39%
                                                        Clearstream Banking AG                                                       1%
                                                        State Street Bank And Trust Omnibus Account A Fund No OM01                   1%
                                                        LHV Pensionifond L                                                           1%

                                                   1.20
                                                    1.10
                                                   1.00
                                                   0.90
                                                   0.80
                                                   0.70
                 Top 10 shareholders
                                                   0.60
                 Institutional investors           0.50
                 Retail investors                       04.19 06.19 08.19 10.19   12.19 02.20 04.20 06.20 08.20 10.20 12.20 02.21
                                                                             Share Price in EUR    FDR Price in EUR

                       MORE THAN 19,900 SHAREHOLDERS AND 5,700 FDR-HOLDERS AT THE END OF THE QUARTER
                                                                                                                                          17
TALLINK
GRUPP
THANK YOU

        AS Tallink Grupp
Sadama 5, 10111, Tallinn, Estonia
      investor@tallink.ee
You can also read