Reach the people you need to know - Citizen Surveys
←
→
Page content transcription
If your browser does not render page correctly, please read the page content below
Reach the people you need to know.
SOUTH AFRICAN CITIZENS SURVEY
  ABRIDGED CORE REPORT – QUARTER 4 2018
HOW WAS THE DATA COLLECTED - SCIENTIFICALLY
HOW MANY PEOPLE PARTICIPATE IN THE SURVEY EACH QUARTER
THE SURVEY THE SAMPLE AND NUMBER OF PARTICIPANTS
Citizen Surveys has been carrying out the South African Citizens Survey The sample is based on Census EA sample frame – which means that
(SACS) since July 2015. Since its inception just over 55,000 South Africans every person in the population has a known chance of being included in
have been interviewed. the survey.
Every month we conduct face-to-face interviews on computer tablets with Sampling sites are chosen at random across all provinces and metro,
a nationally-representative sample of 3,900 South African adults (i.e. 18 urban and rural areas, with probability proportionate to population size,
years of age and older) per quarter. based on the latest Stats SA Census estimates of the population aged 18+.
Interviews are conducted in the main official languages - English, Zulu, Results are reported quarterly on a total of 3,900 respondents, which
Xhosa, Afrikaans, Sotho, Sepedi, and Setswana. produces results with a margin of error margin of error of ±1.5
percentage points at the 95% confidence level.
Weights are applied to ensure the sample represents the most recent
national population with respect to province, race, gender, age, and area.
3,900 INTERVIEWS PER QUARTER 1,300 INTERVIEWS PER MONTH
Original data and written content:
© 2018 Citizen Surveys. All rights reserved. 3
WHERE WERE THE INTERVIEWS CONDUCTED ?
ALL PROVINCES ARE COVERED
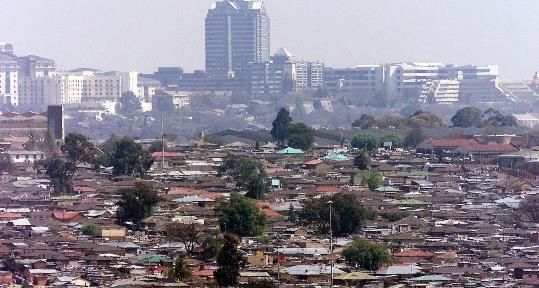
The South African Citizens Survey covers the
whole of South Africa from the cities to the
remotest villages of South Africa – giving a
voice to all South Africans.
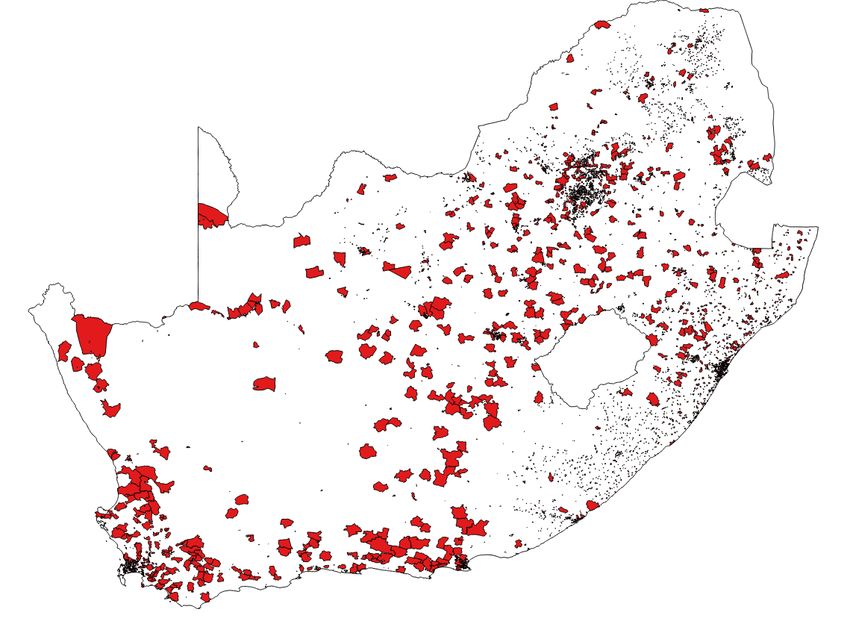
Alongside is a map of all the Enumerator
Areas where, during the course of the past 3
years, just over 55,000 interviews were
conducted.
This coverage, combined with our scientific
sampling and rigourous quality controls,
means that the data used for this report
represents all South Africans, and can be
relied upon for crucial and strategic
decisions.
Original data and written content:
© 2018 Citizen Surveys. All rights reserved. 4
2019 GENERAL ELECTIONS
 RESEARCH RESULTS AND ANALYSIS
PUBLIC TRUST IN THE IEC
In Quarter 4 of 2018, trust in the IEC grew noticeably to 59% from its all-
TRUST IN: ELECTORAL COMMISSION (IEC)
time low of 48% in the previous quarter. HOW MUCH TRUST, IF ANY, DO YOU HAVE IN… ?
As the IEC engages with the public in the leadup to the general election,
67%
more adult citizens of South Africa have begun to trust the IEC.
62% 62%
59%
The degree of trust in the Electoral Commission has also changed over 57%
54% 54%
time: the proportion with “Some trust” has steadily declined over time, 49% 48%
and has been overtaken by those with “A lot of trust”.
39%
Those South Africans who said that they have a lot of trust in the IEC 37%
has dropped since the beginning of 2018, however, from 31% to 25% in 32% 32% 32% 31% 31%
Q2 of 2018 and Q3 0f 2018. 25% 25%
30% 29%
Those with some trust in the IEC declined from 37% in Q1 0f 2017 to 28%
25% 25% 25%
22% in Q4 of 2017, and have largely remained at this level until this 22% 23% 23%
quarter.
In this quarter, both degrees of trust saw growth.
Q4 2016 Q1 2017 Q2 2017 Q3 2017 Q4 2017 Q1 2018 Q2 2018 Q3 2018 Q4 2018
SOME TRUST / A LOT OF TRUST A LOT OF TRUST SOME TRUST
Original data and written content:
© 2018 Citizen Surveys. All rights reserved. 6
SPECIFIC QUESTION POSED AROUND THE ELECTIONS
VOTER REGISTRATION STATUS AMONGST SOUTH AFRICANS AGED 18+ ( Q4 2018 )
Being registered to vote is a precondition for being able to vote.
We asked citizens whether they are registered, and if not whether they
intend to register.
37-million
SOUTH AFRICANS AGED 18+
Of the adult population of 37-million South Africans (18+ years), roughly
60% or 22.2-million potential voters said they were definitely registered to
vote.
:|
:|
:|
:)
:(
Some 6% (2.4-million) potential voters believed that they are registered,
but were uncertain. 22.2m 2.4m 6.7m 1.1m 4.5m
Another 18% (6.7-million) potential voters said they intended to
60% 6% 18% 3% 12%
DEFINITELY POSSIBLY INTEND TO UNCERTAIN / DON’T INTEND
register. REGISTERED REGISTERED + REGISTER DON’T KNOW TO REGISTER
UNSURE OF
About 3% (1.1-million) adults however said they uncertain about STAMPED ID
whether they were going to register.
However, a substantial number of eligible voters 12%, or 4.5-million
10.2-million 28%
said they don’t intend to register to vote.
POTENTIAL VOTERS TO OF SOUTH
AFRICAN
BE REGISTERED ADULTS
Original data and written content:
© 2018 Citizen Surveys. All rights reserved. 7
DEMOGRAPHIC PROFILE: Q4 2018
SOUTH AFRICAN ADULTS ( 18+ ) WHO DON’T INTEND TO REGISTER

POPULATION GROUP                               LIVING STANDARDS MEASURE      TOTAL SOUTH AFRICANS

             BLACK
                                                10   229,000 (5%)            4.53-million                       GT
                                                                                                                                             LM

                                                                             12%
             3,590,000 (79%)                                                                                                                 414,000 (9%)
                                                                                                                1,350,000 (30%)
             COLOURED                           09   376,000 (8%)
             438,000 (10%)
                                                08   454,000 (10%)                                                                                 MP
             INDIAN                                                                                                NW                              441,000 (10%)
             110,000 (2%)                       07   622,000 (14%)                                                 395,000 (9%)

             WHITE                              06   1,600,000 (35%)
             387,000 (9%)                                                                                                   FS                       KZ
                                                05   548,000 (12%)                            NC                            218,000 (5%)             661,000 (15%)
                                                                                              87,000 (2%)
AGE GROUP                                       04   471,000 (10%)

  18-24          1,543,000 (34%)                03   109,000 (2%)
                                                                                                                         EC
                                                02   117,000 (3%)
                                                                                                                         304,000 (7%)
  25-34          1,430,000 (32%)
                                                                                         WC                                                                  GEOTYPE
                                                01   ,000 (0%)
                                                                                         655,000 (14%)
                                                                                                                                       METRO
  35-44          746,000 (16%)
                                                                                                                                       2,162,000 (48%)
                                               GENDER                     PARTISANSHIP

                                                        FEMALE             ANC 435,000 (100%)                                          URBAN
  45-54          312,000 (7%)
                                                        2,039,000 (45%)                                                                670,000 (15%)
                                                                           DA     173,000 (100%)
                                                        MALE                                                                           RURAL
  55+            494,000 (11%)
                                                        2,486,000 (55%)    EFF    311,000 (100%)                                       1,693,000 (37%)
Original data and written content:
© 2018 Citizen Surveys. All rights reserved.                                 NOTE: Percentages represent the proportion across each demographic category (i.e. Column %).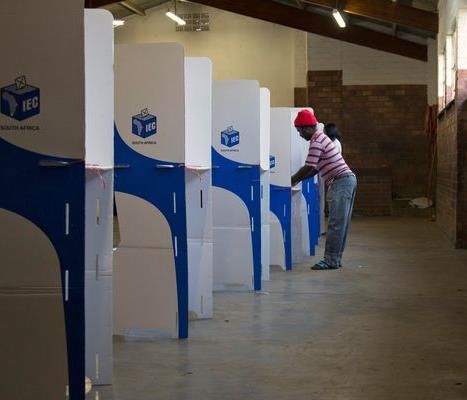
THE MAIN REASON YOUNG SOUTH AFRICANS NOT REGISTERING TO VOTE
ANALYSIS
1. South Africans 18 to 34 years old constitute about two-third of those who 4. One of the questions the youth who don’t intend to register are asking
either said they were uncertain about whether they were going to register or themselves is “does voting make a difference?”
did not intend to register to vote.
5. Some people may say that the youth are apathetic. While they may not
About half of them are “born frees” (i.e. they were born after the Apartheid decide to engage in voting, the youth have other mechanisms of making
era). their voices heard, as seen in the #FeesMustFall and #DataMustFall
Those in the 25-34 year age category spent their formative period within campaigns (which were largely driven by the youth).
the new democracy.
2. One of the main reasons is political alienation.
In the overall adult population, about 50% “feel close to” a political party.
This is a measure of political partisanship.
However, amongst those who do not intend to register to vote, 80% do not
feel close to any political party.
3. As we know, the unemployment rate in the country continues to escalate,
and it is highest amongst the Youth. In the absence of employment, it is
difficult to advance in life.
In 2018, the South African economy went into recession. The youth are thus
facing downward social mobility with few prospects and opportunities.
Original data and written content:
© 2018 Citizen Surveys. All rights reserved. 9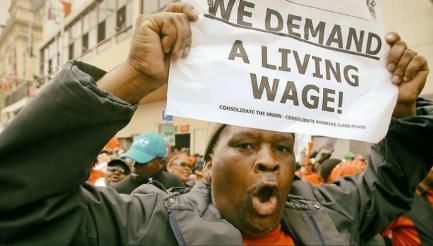
SPECIFIC QUESTION POSED AROUND THE ELECTIONS
VOTER REGISTRATION CHALLENGES - COMMON ANSWER FROM THE PARTICIPANTS
POTENTIAL VOTERS TO BE REGISTERED
We asked of the 28% (10.2-million) potential
voters to be registered about the challenges 5.7m 4.6m
they may face in voter registration: 56% 44%
FACE NO CHALLENGES FACE CHALLENGES
How likely are you to take time off to register
to vote?
REGISTRATION CHALLENGES
How likely are you to pay for transport or
HOW LIKELY ARE YOU TO HOW LIKELY ARE YOU TO PAY FOR HOW LIKELY ARE YOU TO
walk in order to register ? TAKE TIME OFF TO TRANSPORT OR WALK IN ORDER GIVE YOUR RESIDENTIAL
REGISTER ? TO REGISTER? ADDRESS TO THE IEC ?
How likely are you to give your residential
address to the IEC? 5% 7%
8%
9%
8%
About 79% (7.8-million) will be able to take 26%
14% 33%
35% 8%
time off to register. 10%
About 68% (6.7-million) will pay for transport 9%
or walk to register.
About 75% (7.4-million) would provide the IEC
44% 42% 42%
with their proof of address.
NEITHER LIKELY
VERY LIKELY LIKELY UNLIKELY VERY UNLIKELY
NOR UNLIKELY
Original data and written content:
© 2018 Citizen Surveys. All rights reserved. 10SPECIFIC QUESTION POSED AROUND THE ELECTIONS
VOTING DAY CHALLENGES - COMMON ANSWER FROM THE PARTICIPANTS
SOUTH AFRICAN ADULTS ( 18+ )
Whether they are registered or not, voters may
also face voting day challenges. 23.3m 13.8m
63% 37%
We ask two questions in order to establish whether FACE NO CHALLENGES FACE CHALLENGES
potential voters believe that they may encounter
voting day challenges: EASE OF VOTING VOTER PATIENCE
HOW EASY IS IT FOR YOU TO GET TO A HOW LIKELY ARE YOU TO WAIT TO PLACE
How easy is it for you to get to a local polling LOCAL POLLING STATION? YOUR VOTE, EVEN IF THERE IS A LONG QUEUE?
station? and
26.2m 12.7m
How likely is it that you would wait to place your Very easy Very Likely
71% 34%
vote, even if there is a long queue at the voting
station? 5.9m 12.7m
Fairly easy Likely
16% 34%
The respondent would be deemed able to
overcome voting day challenges if they answered in 1.7m 2.3m Neither Likely
Fairly difficult
5% 6% nor Unlikely
the affirmative to both questions.
Using these criteria, 63% or 23.3-million citizens 1.4m 3.8m
Very difficult Unlikely
would be able to overcome voting day challenges, 4% 10%
while 37% may face challenges at the polls.
1.8m 4.3m
Don't Know Very Unlikely
5% 12%
Original data and written content:
© 2018 Citizen Surveys. All rights reserved. 11SPECIFIC QUESTION POSED AROUND THE ELECTIONS
VOTER MOTIVATION - COMMON ANSWER FROM THE PARTICIPANTS
In order to gauge the motivation to vote amongst South
African adults, we asked: “Thinking about the 2019 national
VOTER MOTIVATION
elections, how much do you want to vote in next year’s THINKING ABOUT THE 2019 NATIONAL ELECTIONS, HOW MUCH DO
YOU WANT TO VOTE IN NEXT YEAR’S ELECTIONS?
elections?”
Overall, 72% or 26.6-million South African adults are
motivated to vote, while the remaining 28% or 10.5-million
citizens have little or no motivation to vote.
3%
12% 37-million
SOUTH AFRICANS AGED 18+
We also observe that 10.5-million (28%) are not motivated 13%
26.6-million (72%)
to vote.
54%
In the absence of motivation, the chances of the person MOTIVATED TO VOTE
going to vote, irrespective of whether they have the means 18%
or access, are low. 10.5-million (28%)
NOT MOTIVATED TO VOTE
DON’T KNOW /
A GREAT DEAL QUITE A LOT NOT VERY MUCH NOT AT ALL
REFUSED
Original data and written content:
© 2018 Citizen Surveys. All rights reserved. 12VOTER READINESS SEGMENTATION MODEL - ANALYSIS
OVERVIEW
VOTER READINESS MODEL VOTER READINESS MODEL
We set about modelling the impact of voter registration, voting-day
READY VOTERS
challenges and the motivation to vote in order to establish the impact
Those citizens who are registered to vote, motivated to vote and are capable
these factors may have on voter turnout.
of overcoming all voting day challenges.
In total thirteen scenarios were considered, various combinations of voter
motivation, registration challenges and voting day challenges. These LIKELY VOTERS
thirteen scenarios were distilled into four prototype voter readiness Those citizens who are motivated to vote, are uncertain whether they are
segments. registered to vote, however they are capable of overcoming registration
challenges as well as capable of overcoming all voting-day challenges.
CHALLENGED VOTERS
Those while they are motivated to vote are likely to encounter registration
and / or voting day challenges.
UNMOTIVATED VOTERS
They are not yet motivated to vote regardless of whether they will face
registration and / or voting day challenges.
Original data and written content:
© 2018 Citizen Surveys. All rights reserved. 13VOTER READINESS SEGMENTATION MODEL - ANALYSIS
FOUR VOTER SEGMENTS
In order to estimate voter turnout, we take into account all preceding When we apply these segments to the overall adult population, we
preconditions: motivation to vote, registration status, registration observe four segments emerging. Collectively this enables the
challenges, and voting-day challenges. Collectively this allows us to divide construction of voter turnout scenarios.
1
South African adults into four segments:
2
37-million
SOUTH AFRICANS AGED 18+
VOTERS WHO ARE MOTIVATED, VOTERS WHO ARE MOTIVATED,
REGISTERED, AND CAN OVERCOME UNCERTAIN OF THEIR REGISTRATION,
CHALLENGES AND CAN OVERCOME CHALLENGES
14.5m (39%)
READY VOTERS LIKELY VOTERS
1 17.6m
4 3
READY VOTERS
MOST LIKELY TO
3.2m (9%)
2
TURN OUT AT
UNMOTIVATED VOTERS CHALLENGED VOTERS THE POLLS
VOTERS WHO ARE NOT YET MOTIVATED VOTERS WHO ARE MOTIVATED, LIKELY VOTERS
TO VOTE, REGARDLESS OF REGISTRATION UNREGISTERED, AND LIKELY TO
9.0m (24%)
3
OR VOTING CHALLENGES FACE CHALLENGES
CHALLENGED VOTERS
4 10.5m (28%)
14
UNMOTIVATED VOTERS
Original data and written content:
© 2018 Citizen Surveys. All rights reserved.HOW CAN POLITICAL PARTIES CONVINCE PEOPLE TO VOTE FOR THEM?
MANIFESTOS MUST SPEAK TO THE MOST IMPORTANT PROBLEMS FACING SOUTH AFRICANS
The number one problem facing South Africa is MOST IMPORTANT PROBLEMS
Unemployment – as expressed by almost three-in-four IN YOUR OPINION, WHAT ARE THE THREE MOST IMPORTANT PROBLEMS FACING SOUTH AFRICA ?
South African adults (72%).
Unemployment 72% 26.3m
This is followed closely by Crime - as indicated by four-in- Crime 41% 15.0m
ten (41%) South Africans and Corruption Corruption 25% 9.1m
While “Crime” grew from the previous quarter, Poverty / Destitution 23% 8.3m
“Corruption” grew even more. This is most likely owing to Housing 17% 6.3m
the continuing revelations of corruption, from State Water Supply 15% 5.6m
Capture to Steinhoff and now Bosasa.
Education 11% 3.9m
Poverty and Destitution was ranked at fourth place. Roads 10% 3.6m
Electricity Supply 8% 2.8m
Economic / Income Inequality 7% 2.7m
Basic Health 6% 2.2m
NOTE
Management of the Economy 5% 2.0m In the above graph, 72% is the
Immigrants / Xenophobia 5% 2.0m proportion of the 3,000 respondents
who mentioned “Unemployment” as
Discrimination / Racism 4% 1.4m their first-, second-, or third-most
Wages / Income 3% 1.3m important problem.
Original data and written content:
© 2018 Citizen Surveys. All rights reserved. 15THE MOST IMPORTANT PROBLEMS FACING SOUTH AFRICA
PERCEPTIONS OF CORRUPTION
President Ramaphosa has emphasised that rooting out government
PERCEPTIONS OF CORRUPTION
corruption would be a national priority. This resonates with South IN YOUR OPINION, IS THE LEVEL OF CORRUPTION IN SOUTH AFRICA INCREASING,
STAYING THE SAME, OR DECREASING?
Africans, of whom 9.1-million (25%) said that corruption was one of the
most important problems facing South Africa.
80% 81% 81%
Since April 2018, in the process of tackling corruption within government 77%
72% 74%
(for example, the Nugent and Zondo Commissions), South Africans have 67%
become increasingly aware of the extent of State Capture and general 59%
corruption and mismanagement, and their adverse impact on the country
and its economy.
In April, 59% of South Africans believed that corruption in South Africa is
growing. In May, just over two-thirds (67%) believed this, and this measure 41%
has continued to grow. November and December 2018 have seen the 33%
28% 26%
highest levels, at 81%. 23%
20% 19% 19%
Corruption is unlikely to be getting worse; instead, corruption is being
brought out into the open. In order to restore trust, however, corrupt Apr 2018 May 2018 Jun 2018 Jul 2018 Aug 2018 Sep 2018 Oct 2018 Nov 2018 Dec 2018
officials who broke the law must face serious consequences.
INCREASING NOT INCREASING
Original data and written content:
© 2018 Citizen Surveys. All rights reserved. 16THANK YOU.
You can also read