Sysdig and Red Hat Empowering OpenShift and Prometheus - Dmitriy Sandler Senior Sales Engineer @dmitriy_sandler - Red Hat People

Page created by Dustin Long
 
CONTINUE READING
Sysdig and Red Hat Empowering OpenShift and Prometheus - Dmitriy Sandler Senior Sales Engineer @dmitriy_sandler - Red Hat People
Sysdig and Red Hat
    Empowering OpenShift and
          Prometheus

Dmitriy Sandler
Senior Sales Engineer
@dmitriy_sandler
Sysdig and Red Hat Empowering OpenShift and Prometheus - Dmitriy Sandler Senior Sales Engineer @dmitriy_sandler - Red Hat People
Sysdig snapshot
 MISSION: Enable enterprises to operate reliable and secure containerized cloud-native applications

  Company Snapshot                       Illustrative Customers              Strong Momentum

 • Founded in 2013                                                          • ARR growing
 • HQ in San Francisco;                                                       exponentially
   global presence                                                          • Customers have a
 • $120M+ in capital from                                                     pattern of expanding
   top-tier VCs                                                               scope and use cases
 • Built on an open core with                                               • Strong eco-system
   millions of downloads and                                                  alliances
   a strong community

  PROM ETH    SYSDIG        FA   ANCHO
    EUS      INSPECT        LC     RE
                            O

                  KUBERNE
                    TES
Sysdig and Red Hat Empowering OpenShift and Prometheus - Dmitriy Sandler Senior Sales Engineer @dmitriy_sandler - Red Hat People
Buying Catalyst: Containers in Production / Scale

“I cannot be in production with no ability to troubleshoot issues”
                                                                                        Bank Of New York

“Our internal audit has decided that OpenShift is now large enough and it is within the purview of their
audit. They found a host of issues that we need to address immediately”
                                                                                                  Barclays

“Moving to a more modern platform using Openshift - Data needs to be more resilient and highly
available because when sabre has issues., it makes the news”
                                                                                                    Sabre

“We are moving all our applications to the cloud…we need to know what happened, not just that it
happened”
                                                                                                     DnB
Sysdig and Red Hat Empowering OpenShift and Prometheus - Dmitriy Sandler Senior Sales Engineer @dmitriy_sandler - Red Hat People
The challenge with cloud-native applications
                                                                Polling every 60 seconds is not enough
                                                                “

We need to be able to drill down from
“
                                                                when containers can come and go in
high level views all the way to
mounted file systems within                                     seconds”
containers”                                                                  Top 5 Global Investement Bank
                     Fasthosts Internet

                                        BUILD             RUN

“How do we ensure PCI compliance for                                “We have Newrelic but need operational
                                                RESPOND
our Kubernetes environment in AWS                                   monitoring…things are going to go wrong and
and GCP?”                                                           we need to know within 5 minutes”
                            Nordstrom                                                      Premiere Global Services
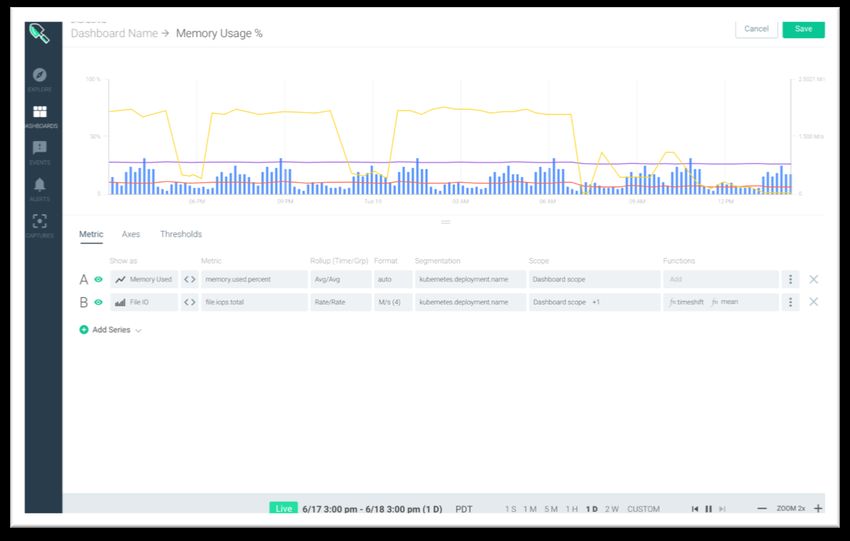
Sysdig and Red Hat Empowering OpenShift and Prometheus - Dmitriy Sandler Senior Sales Engineer @dmitriy_sandler - Red Hat People
Sysdig Architecture

                  CONTAINER

                                         CONTAINER

                                                                 CONTAINER

                                                                  PROCESS
                              CUSTOM
                                                     NGINX                   SYSDIG

                                                                     -
                                APP

                        NT
                    A RE           SYSTEM CALLS
                  SP ION
              R AN TAT
           E T EN
       I QU RUM
     UN NST
         I

                                              HOST / OS KERNEL

Kernel instrumentation sees all app, container, host, and network system calls.
Monitor, detect, protect, and troubleshoot from a single instrumentation point.
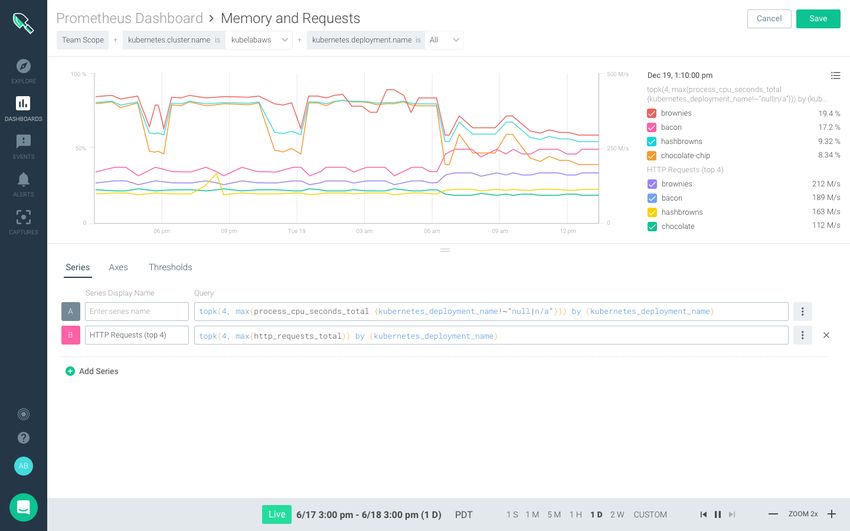
Sysdig and Red Hat Empowering OpenShift and Prometheus - Dmitriy Sandler Senior Sales Engineer @dmitriy_sandler - Red Hat People
Our Approach
                    Our Mission: Enable enterprises to operate reliable and
                    secure containerized cloud-native applications

                                            Cloud-native
       Data                                                                         Insights
                                        Intelligence Platform

  Comprehensive,              Core principles:                                Automated monitoring,
scalable and context-                                                             detection and
                              1. No instrumentation
  rich record of all                                                                forensics/
       activity               2. No pre-meditation = always on                   troubleshooting
                              3. Container-native
                              4. Applications and infrastructure
                              5. Deeper data
Sysdig and Red Hat Empowering OpenShift and Prometheus - Dmitriy Sandler Senior Sales Engineer @dmitriy_sandler - Red Hat People
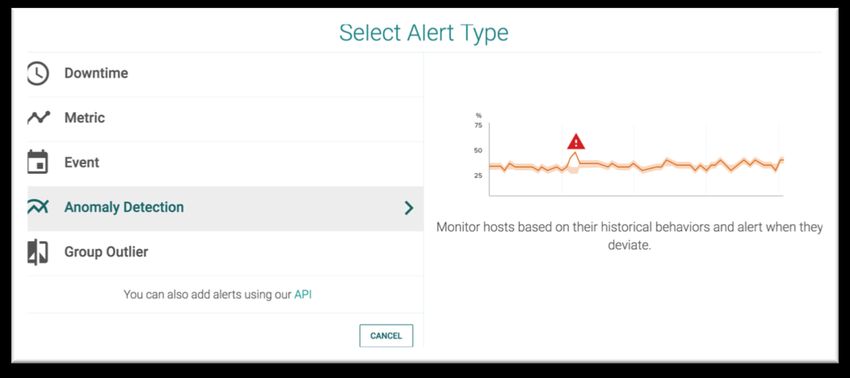
Cloud-native operations is fundamentally a data challenge

                                   How can we scan & block vulnerable images and enforce
                                   best practices pre-production?
                          BUILD

                                   How can we block threats, enforce compliance and
BUILD   DevOps     RUN             monitor application and service performance?
                          RUN

                                   How can we proactively alert on incidents, reduce MTTR
         RESPOND                   with forensics, and capture detailed audit records?
                         RESPOND
Sysdig and Red Hat Empowering OpenShift and Prometheus - Dmitriy Sandler Senior Sales Engineer @dmitriy_sandler - Red Hat People
SYSDIG

Solution Portfolio.

         Robust commercial software offerings…
         Built on the most popular cloud-native open source solutions.
Sysdig and Red Hat Empowering OpenShift and Prometheus - Dmitriy Sandler Senior Sales Engineer @dmitriy_sandler - Red Hat People
Stronger Together:

  End-to-end           Deep troubleshooting and                   Enterprise-grade
  Security             observability across the stack             Prometheus

   Scanning                 Applications                           Scalable
   Compliance               Middleware                             Simple
   Runtime Detection        Infrastructure (hosts & containers)    Secure
   Incident Response        Orchestrators                          Supported
   Forensics                Cloud Platforms                        Service Topology and
                            Network connections                    workflows
                            Process and syscall activity
                            Custom metrics
                            Events
Sysdig and Red Hat Empowering OpenShift and Prometheus - Dmitriy Sandler Senior Sales Engineer @dmitriy_sandler - Red Hat People
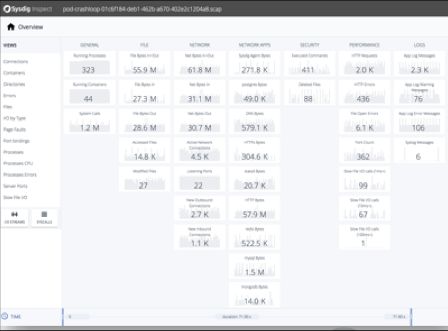
Telemetry across the stack, across clusters, across clouds
                     Applications

                                                                                   ● MTTR: Reduce time and resources of sifting through
                                                                                    multiple tools to identify root cause and resolution
        LOB          Micro-Services      Custom Metrics (JMX, StatsD, Promehteus
                                                                                    exponentially faster.
                                                            etc)
                                           Golden Signals (HTTP, response time,
                                                     throughput etc)               ● Reliability: Gain confidence and reliability of
                                                                                    OpenShift accelerating more workloads through the
   Service Owner      Cloud-Native                                                  SDLC pipeline into production.
                     Application Stack

                                          Application Metrics

   Application Ops
                                                                                         Sysdig
                                                                                       Dashboards
                         Modern                                                          Alerts
                      Infrastructure                                                    Analytics
                                         Infrastructure Metrics                         Captures
     Platform Ops

                                                                                                                      Alerting Systems
                                                                                                                       (e.g., PagerDuty)

                         Network
     Network Ops                            Network Metrics
Dynamic Service Monitoring & Troubleshooting
                        •   Dynamic discovery of micro services
                        •   Deep Kubernetes insights (native monitoring of kube components, kube-state metrics, Istio monitoring, out of the box dashboards & alerts)
                        •   Service level topology, dashboards and alerts
                        •   In depth troubleshooting from service level down to infrastructure level to system call level
                        •   Multi-tenant, service based teams and roles

                                                                                            Service Topology
End-to-end visibility

                                                                                                                              Service , application & infrastructure Dashboards

                                                                                            Cluster Topology
Massive scale.
100s of Millions of metrics per 10 sec
             10K+ hosts
      100K+ metrics per host /min
     200+ containers per host

      Multi-dimensional querying
        Live stream Kafka tap
   Query language for metric analytics
      Correlated events + metrics
Prometheus Customer journey: adopt, expand,
        scale
Stage #1: dev-led, single app,                                                      Step #2: scale out, multi-cluster, multi-cloud
DIY
                                                                                    Sysdig’s Enterprise Prometheus (Turn key)
                                 How do I…?

                                       +
                                 …scale metrics per host per sec (1,000 à 15,000)

                                 …view multi-cluster / multi-cloud?

                                 …run a global query across clusters?

                                 …view data older than 2 weeks

                                 …view service-to-service performance?

             +
                                 …integrate with enterprise workflow?

                                 .. What is my troubleshooting workflow?
                                                                                    Scale out w/ Thanos / Cortex / M3 (DIY)

                                       +
Enterprise Prometheus from Sysdig
   Auto-discovery,
   Auto-discovery, collection
                     collection and
                                and tagging: Ingest and visualize Prometheus metrics automatically
   with
   with no
        no developer
           developer changes.
                      changes.

   Scalability,
    Scalability, reliability
                 reliability and long-term data: Industry-leading, horizontally scalable metric store,
   long-term
    long-term data retention,
              data   retention, full
                                full HA
                                     HA and
                                        and highly
                                            highly performant
                                                   performant querying
                                                              querying at
                                                                       at 100s
                                                                          100s of
                                                                               of millions
                                                                                  millions of
                                                                                           of metrics/sec.
                                                                                              metrics/sec.

   Multi-cluster, multi-cloud visibility: Aggregate, query, and visualize metrics and events across
                                                                                             across
   data centers, clusters, and clouds.

   Service-oriented workflow and topology maps: Tooling and workflows designed for
   microservices without code instrumentation or pre-meditation

   Deep troubleshooting out-of-the-box: Full-stack telemetry from services, applications
   and infrastructure down to the container process with network level data with event
   correlation. No hooks, plugins or additional configurations to collect data at any layer.

   Lower total cost of ownership with an enterprise-ready solution: Role-based access control,
   Teams, encryption, audit and compliance, support and more.
How does it work?                                                                   Grafana                   Sysdig Monitor
  Comparing standalone Prometheus and                                                 Dashboards               Cross-cluster Dashboards,
                                                                                                                 Alert, Correlation and
  Sysdig with Prometheus                                                                                                Analytics

                                  Prometheus Server
                                   Prometheus Server
                                        Alert Manager
                                    Prometheus   Server
                                        Alert Manager
                                     Prometheus   Server
                                         AlertGrafana
                                               Manager
                                               Grafana

                                        !
                                          Alert Grafana
                                                Manager
              Prometheus Server                 Grafana Prometheus Server
             Prometheus   Server
                   Alert Manager                         Prometheus   Server
                                                                Alert Manager
                Prometheus    Server
                  Alert Manager
                          Grafana                      Prometheus   Server
                                                              Alert Manager
                                                                      Grafana                                             Sysdi
                   Prometheus
                     Alert      Server
                           Manager
                        Grafana                       Prometheus   Server
                                                            Alert Manager
                                                                    Grafana                                               g API
                         Alert Manager
                            Grafana                        Alert Manager
                                                                   Grafana
                               Grafana                           Grafana               Sysdig agents          Prom

                                                                                    automatically scrape
                                                                                                               QL     Sysdig
  100s of                                                                           Prometheus metrics               backend
standalone
  servers!
                                                                                                              All system metrics +
                                                                                                               network metrics +
                                                                                                              Kubernetes metrics +
                                                                                                                custom metrics:
                                                                                                           Prometheus + StatsD + JMX

                                                        Prometheus instrumented apps
                                                         and infrastructure + exporters
Dashboarding and Alerting
• Rich and flexible dashboarding
• Real time alerting and anomaly detection
• Best practices based out-of-the-box dashboards and alerts
Building charts with Prom Query Language
End-to-End Security for Microservices
 BUILD                            RUN                         RESPOND                       COMPLY

VULNERABILITY                   RUNTIME                       FULL STACK                     AUDIT
MANAGEMENT                      DETECTION                     FORENSICS                      & COMPLIANCE
CI/CD, static image                                           Drill down from policy         Schedule compliance
                                Identify and block
scanning, runtime               threats in real time,         violations into 100%           scans, log user
vulnerability                                                 granularity captures           actions, and
                                prevent lateral
management.                                                   of pre- and post-              command-line
                                movements based on
Openshift provides with                                       attack activity.               arguments.
                                behavioral
OpenSCAP.                       intelligence

                                       SERVICE ORIENTED SECURITY
  Protect distributed, dynamic, and ephemeral services with a single service policy and no manual configuration.
Red Hat and Sysdig – Stronger Together
Pillar 1: Security- Openshift provides Image Scanning and integration with CI/CD process via OpenSCAP. Better together with system call
level security and behavioral analysis along with deep forensics to better understand the internal or external actors motives and address
accordingly.
     ●   Run time security: stop zero day and internal threats, prevent lateral movements based on behavioural intelligence
     ●   Enforcement & Forensic Captures: Create detailed system captures for any policy violation or incident enabling ability to take actions against malicious activity.
     ●   Service Oriented Incident Response: View of your security policy violations based on orchestrated services.

Pillar 2: Troubleshooting/ Reliability - Sysdig’s unique instrumentation point allows Openshift users to take advantage of troubleshooting
capabilities to provide your nodes, pods, services, and deployments an additional highly potent reliability tool… even after your pods or
services are no longer there… providing better Root Cause and Mean Time to Repair
     ●   MTTR: Reduce time and resources of sifting through logs to identify root cause and resolution exponentially faster.
     ●   Reliability: Gain confidence and reliability of OpenShift accelerating more workloads through the SLDC pipeline into production.

Pillar 3: Enterprise Grade Prometheus- what does that mean on top of all the goodness you receive with OpenShift’s exciting
Prometheus OOTB support: The 5 S’s will help your OpenShift Platform be your platform of choice for your container workloads.
     ●   Scale: Provides a horizontally scalable distributed Collector that handles tens of millions of metrics per second with cross-cluster aggregation to keep pace with
         large, complex environments.
     ●   Scope: Collects, analyzes, and correlates Prometheus metrics with granular metrics and events for system processes, applications, cloud platforms, networks,
         orchestrators, and customer metrics like StatsD and Java TM Management Extensions (JMX), with advanced visualizations like topology maps.
     ●   Simplicity: Reduces complexity with a turn-key solution that eliminates the headaches of managing multiple isolated monitoring systems and services.
     ●   Security: Integration with Openshift’s Industry leading RBAC and Secrets Management
     ●   Support: Extends technical support and services to enterprise Prometheus users to resolve issues more rapidly

                                           All this with one platform…...OpenShift+Sysdig
You can also read