CAPITALAND INVESTORS' DAY PRESENTATION BY WEN KHAI MENG CEO, CAPITALAND SINGAPORE - 6 JUNE 2013 - FINANZNACHRICHTEN
←
→
Page content transcription
If your browser does not render page correctly, please read the page content below

CapitaLand Investors’ Day
    Presentation by Wen Khai Meng
      CEO, CapitaLand Singapore

                6 June 2013
0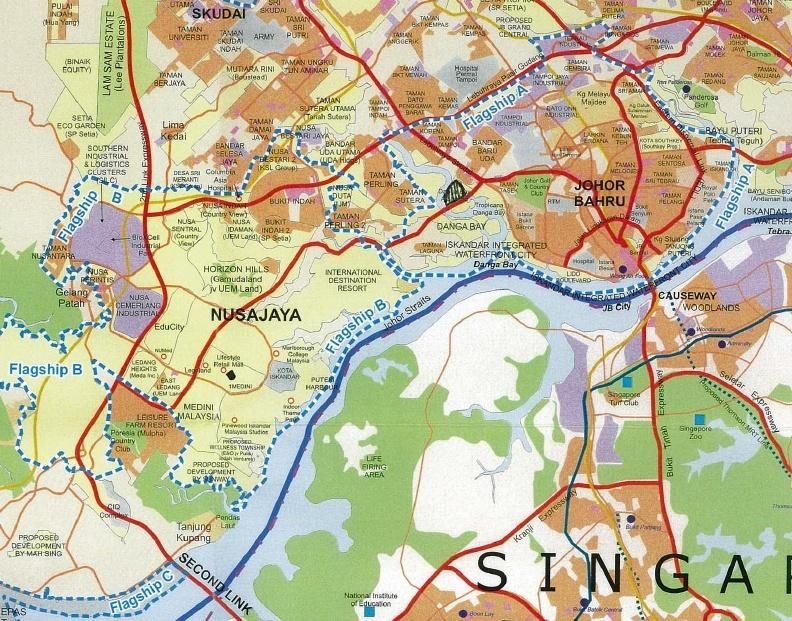
Content
    • Overview
    • Our Key Businesses
    • Business Update
    • Singapore Residential Market
    • Singapore Commercial Market
    • Malaysia Iskandar Region
    • CapitaLand Singapore’s Strategy

1                       CapitaLand Presentation *June 2013*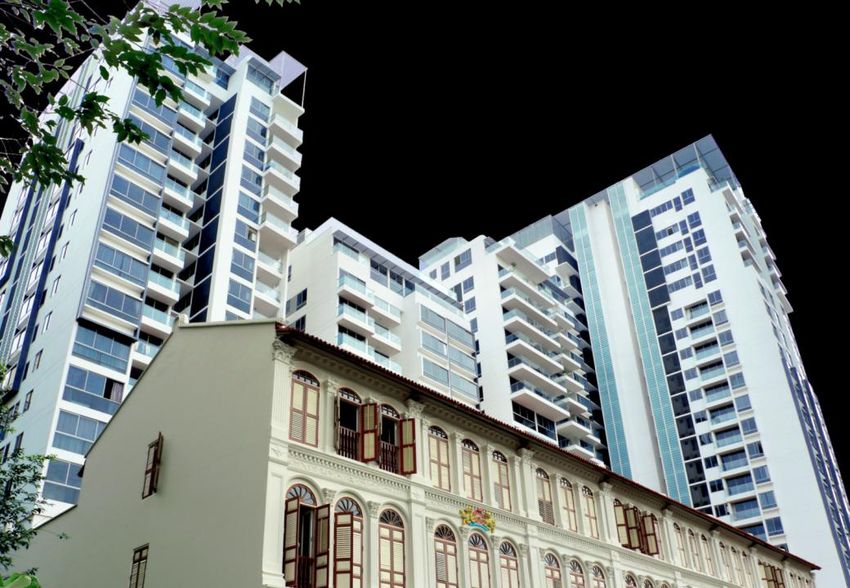
CapitaLand Singapore Organisation

                               CapitaLand
                               Singapore

          Residential          Commercial                     Malaysia

                                    CapitaCommercial
                                      Trust (CCT)
                                       (32% owned)

                                     Quill Capita Trust
                                   (30% owned by CCT)

2                       CapitaLand Presentation *June 2013*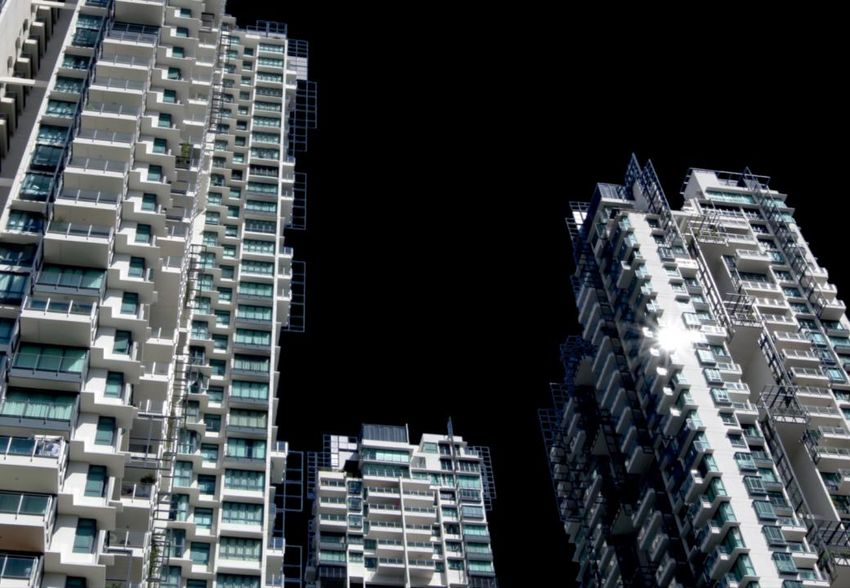
CLS contributed 29% of CapitaLand’s EBIT (1)

    Total Assets as at 31 March 2013                               EBIT as at 31 March 2013
           CL Group = $35.4b                                         CL Group = $386.1m
              CLS = $6.2b                                               CLS = $110.8m

                                    CLS ,
                                 $6.2b, 18%

                                                                                            CLS ,
                                                                                        $110.8m, 29%

                  Rest of CL                                                   Rest of CL
                   Group,                                                        Group ,
                 $29.2b, 82%                                                  $275.3m, 71%

       Note:
       (1) EBIT – Earnings before interest and tax
3                                          CapitaLand Presentation * June 2013*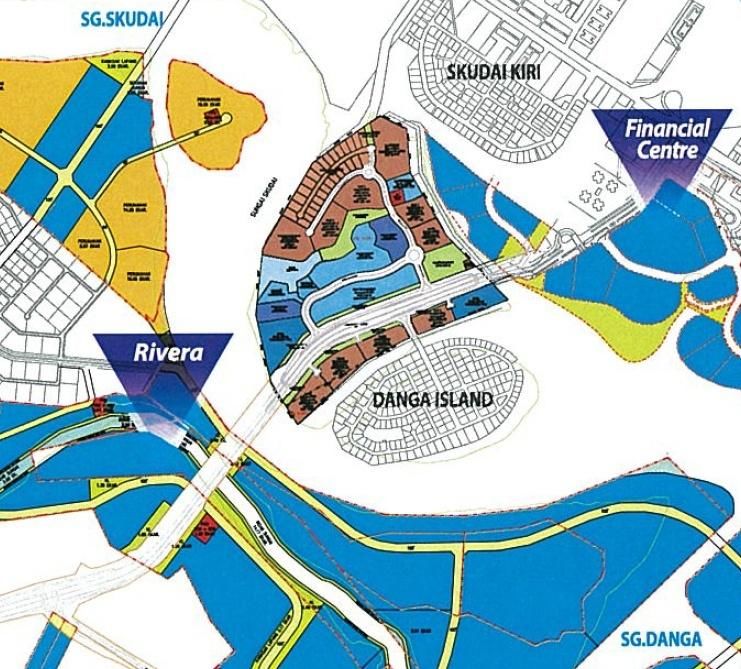
Our Key Businesses

    The Wharf Residence, Singapore
4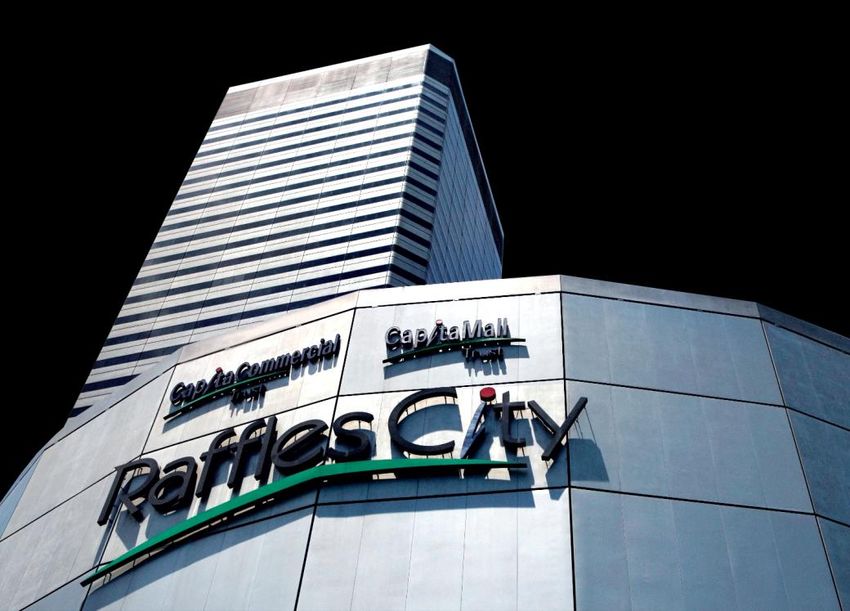
CapitaLand Singapore

                                                                Homes
                                                                Leading developer of distinctive and quality
                                                                homes

                                                                Completed > 7,000 homes since 2000
                                      Sky Habitat,              Pipeline of 2,200 homes or 3.3 mil sq ft GFA (1)
      d’Leedon, Singapore
                                       Singapore

                                                           Commercial & Mixed Developments
                                                                One of Singapore's largest office landlords and
                                                                managers

                                                                Owns/manages 13 offices and mixed-use
                                                                developments or > 5 million sq ft of NLA
         CapitaGreen,           One George Street,
                                                                Sponsor of CCT(2) (32% owned)
          Singapore                 Singapore
    Notes:
    (1) Information as at 19 May 2013
    (2) CCT = CapitaCommercial Trust, a Singapore listed REIT

5                                                CapitaLand Presentation *June 2013*
CapitaCommercial Trust (Singapore)
                          First Listed Commercial REIT in Singapore

                                                                                      ~S$4.87b#
                                                                                      Market Capitalisation

        Capital Tower         Six Battery Road     One George Street   Wilkie Edge
                                                                                      10
                                                                                      Properties in CBD

                                                                                      ~S$6.95b*
                                                                                      Asset Size
    Raffles City Singapore
                               HSBC Building
          (60% stake)
                                                                                      ~3m sq ft
                                                                                      NLA
                                                     CapitaGreen       Twenty Anson
                                                     (40% stake)

        Golden Shoe
                                Bugis Village
          Car Park
     # Market Cap Figure as at 30 April 2013
     * Asset Size Figure as at 31 March 2013
6                                              CapitaLand Presentation *June 2013*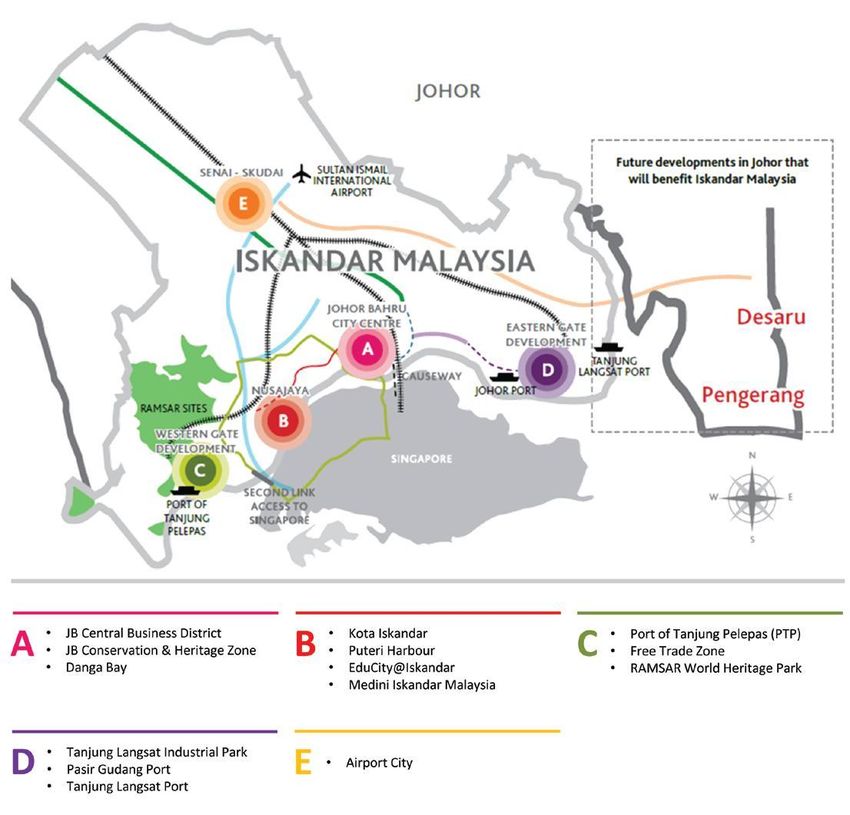
Business Update

            Capital Tower, Singapore
7
Sales Performance of Residential Projects

                   • Achieved S$1.3b sales in 1Q 2013 vs
                     S$1.3b in 2012
                     - 544 units (1Q 2013) vs 57 units (1Q
                       2012)
                                                                             d’Leedon
    No of Units Sold

                                                             d’Leedon

                                                                            The Interlace

8                                                             *June2013*
                                      CapitaLand Presentation *May  2013*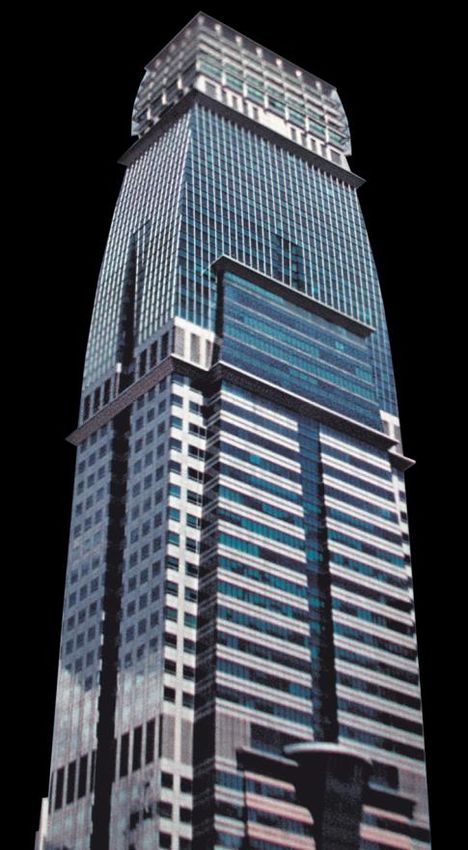
Singapore Residential - Sales and Construction Progress1
                                                                                % Launch Sold % Completed
                                                                         Units
                          PROJECT                        Total Units
                                                                       Launched As at Mar 2013 As at Mar 2013

          Launched in 2007
            The Orchard Residences                             175       175            95%        100%
           Launched in 2008
            The Wharf Residence                                186       186             97%       100%
            Latitude                                           127       127            100%       100%
           Launched in 2009
             The Interlace                                     1040      1040           75%         90%
            Urban Suites                                       165       165            100%        92%
           Launched in 2010
            d'Leedon                                           1715      1500           88%         53%
           Launched in 2011
            Urban Resort                                       64        34             85%        100%
            Bedok Residences                                   583       583            96%         14%
           Launched in 2012
            Sky Habitat                                        509       250            61%         21%
    1   Figures might not correspond with income recognition

9                                                 CapitaLand
                                                  CapitaLand Presentation
                                                             Presentation *June
                                                                          *June 2013*
                                                                                2013*
Residential Outlook
• Healthy pipeline with projects in
sought-after locations Pipeline# includes:
- 2,200 units (~ 3.3m sq ft GFA) The Interlace ~ 250
d’Leedon ~ 400
• Target to launch Marine Point and Sky Habitat ~ 350
Bishan St 14 in 2H 2013 Marine Point (new) ~ 120
Bishan St 14 (new) ~ 700
• Continue to bid for well-located
sites via GLS tenders and private
# Based on total available units as at end Mar 2013
collective sales
10 CapitaLand Presentation *June 2013*Singapore Office Portfolio Performance
• CCT signed new leases and renewals of approx 409,900
sqft for 1Q 2013 (12% new leases) compared to 459,500
sqft for FY2012 (54% new leases)
• CCT’s portfolio occupancy at 95.3% vs market occupancy
rate of 93.2%
$9.00
$8.73
$8.50
$8.64
$8.00 $7.94 $7.84 $7.83
$psf
$7.79 $7.64
$7.66 $7.45 $7.39 $7.53
$7.50
$7.00
$6.50
Sep-10 Dec-10 Mar-11 Jun-11 Sep-11 Dec-11 Mar-12 Jun-12 Sep-12 Dec-12 Mar-13
Upward trend of CCT’s monthly average office portfolio rent
11 CapitaLand Presentation *June 2013*Commercial Projects Update
CapitaGreen
• Target completion – 4Q 2014
• Commenced marketing with opening of
CapitaGreen show suite
CapitaGreen
Westgate
• Target completion – Office: 4Q 2014
• Pre-leased: 52% Westgate Tower (office)
Westgate
12 CapitaLand Presentation * June 2013*CapitaLand’s First Foray Into Iskandar, Malaysia
– Danga Bay A2 Island
• Total GDV: RM8.1 bil (~S$3.2 bil)
• A premier waterfront residential
community comprising high rise
and landed homes with a central A2 Island
waterfront hub with a marina,
Artist’s impression subject to change
shopping mall, F&B outlets,
serviced residences, offices and
recreational facilities
• Freehold net land: RM811 mil
(~S$324 mil)
• Estimated total GFA: 11 mil sq ft
(Land cost RM74 psf ppr)
Master-planning in progress. Expected launch 1H2014
13 CapitaLand
CapitaLandPresentation
Presentation**June
June 2013*Singapore
Residential Market
RiverGate, Singapore
14Private Home Prices Stabilising
URA Price Index increased 0.6% QoQ in 1Q 2013, compared with the
1.8% increase in the previous quarter
220.0 213.2
200.0
181.4 177.5
180.0
160.0
140.4
140.0
133.3
120.0
112.4
100.0
100.0
80.0
60.0
Source: URA
15 CapitaLand Presentation*June 2013*Private Home Sales halved to 1,375 units in April
Apr-13 developer sales and launches (ex. ECs) moderated, down 51% and 76%
MoM, to 1,375 units and 806 units, respectively, after a record high Mar-13
Units
3,000
OCR (mass market) remained the main driver of sales with 53% of total units sold
8 Dec 2011: 6 Oct 2012: 12 Jan 2013: +292%
ABSD Cooling 6th Cooling 7th Cooling
Measure Measures Measures
2,500
2,000
1,500 +43%
2,793
-51%
2,621
2,417 2,497 +30%
2,393
1,000 1,946 1,948 2,028
1,872
1,704
-65%
1,371 1,427 1,410 1,375
500 1,087
632 712
0
Dec-11 Jan-12 Feb-12 Mar-12 Apr-12 May-12 Jun-12 Jul-12 Aug-12 Sep-12 Oct-12 Nov-12 Dec-12 Jan-13 Feb-13 Mar-13 Apr-13
Source: URA
16 CapitaLand Presentation*June 2013*Sales Breakdown By Market Segment
OCR transactions continues to lead new home sales, accounting for 61% of total YTD sales of 6,787 units, compared
to 73% registered for the whole 2012 total new homes sales
As a percentage of total new home sales, OCR transactions for the 4-year period 2009 to 2012 was 58% per quarter
Units 14,688 16,292 15,904 22,197 6,787
7,000
6,526
6,000 5,916
5,578 5,412
5,402
5,000 4,654
4,444 4,353
4,380 4,241 4,262
2,525 4,033 5,275
4,000 1,375
3,638 3,603 4,367 3,383
1,728 3,595 3,737
1,624 2,239 2,732
3,000 2,596 2,756
1,766 1,916 3,108
1,826 1,860 725 2,618
2,000 1,867
1,637 1,375
523 1,710 1,008
1,356 1,350
473 1,098 1,134 1,221 846 987 727
1,000 1,927
716 1,453 1,186 918 791 1,113
864 699 994 703 679 470
516 581 578 444 610
0 243 236 194 138 178
1Q 2Q 3Q 4Q 1Q 2Q 3Q 4Q 1Q 2Q 3Q 4Q 1Q 2Q 3Q 4Q 1Q Apr-13
2009 2009 2009 2009 2010 2010 2010 2010 2011 2011 2011 2011 2012 2012 2012 2012 2013
Source: URA CCR RCR OCR Overall
Note: Sales figures based on statistics released by URA every quarter, figures will differ from monthly sales figures due to timing of submissions
by developers
Breakdown by Market Segment
Core Central Rest of Central Outside Central Overall
Region Region Region
Quarterly Average for 2009 – 2012 710 1,112 2,495 4,318
Quarterly Average for 2013 (Jan to Mar) 679 1,350 3,383 5,412
17Observations
• Given low interest rate environment, residential property
still provides a positive carry and a decent yield
• Under provision of HDB flats in last decade created
housing under-supply situation
• High HDB resale prices provide price support for private
housing
• Singapore remains attractive to foreign buyers
18 CapitaLand Presentation*June 2013*Residential Strategy
• To continue to bid for land sales
– sites strategically located near MRT stations or
– sites with attractive attributes such as close proximity to
schools, public amenities, etc
• To broaden product range (from premium to
mass) to tap wider market demand
19 CapitaLand Presentation*June 2013*Singapore
Commercial
Market
One George Street, Singapore
20Singapore’s island-wide office supply
Region Area (sq ft) % of total
stock
CBD Core 27.5 mil 43%
- Grade A office 14.6 mil
stock
Rest of Central Area 10.2 mil 16%
Orchard Road 5.1 mil 8%
Marina Centre 3.8 mil 6%
Decentralised Areas 17.3 mil 27%
Source: Jones Lang LaSalle (4Q 2012)
21 CapitaLand Presentation *June 2013*Focus on sites in CBD and developing new
regional centres
East West Line North South Line North East Line Circle Line Downtown Line 1, 2, 3 Thomson Line 1, 2, 3
(Completion 2013, 2015, 2017) (Completion 2019, 2020, 2021)
Regional Centre
• Woodlands
Westgate Woodlands
Regional Centre
• Tampines
• Changi Business Park
• Punggol
Punggol
Toa
Tampines
Payoh
Jurong East Paya Lebar
Newton
Dhoby Bugis
Sub-Regional Centre
Ghaut Stadium • Paya Lebar
Regional Centre One-North
• Kallang
• Jurong East Raffles Place
• Marine Parade
• Buona Vista / One-North Tanjong Pagar Marina Bay
• Toa Payoh / Bishan
CBD Fringe Core Central Business District (CBD)
• Orchard / Dhoby Ghaut • Raffles Place / Tanjong Pagar
• Novena / Newton • Marina Bay
• Bugis / Beach Road / Middle Road CapitaGreen and
22
other CCT propertiesIsland-wide new office supply not excessive;
CBD new supply back-end loaded
Net supply in CBD Forecast average annual new
3.5
supply (2013 to 2017): 1.3 mil sq ft
3.0 2.9
2.5
2.5
2.0 1.8
sq ft million
1.5
1.5
0.9 0.8
1.0 0.7 0.6
0.5 0.3
0.1
0.0
2007 2008 2009 2010 2011 2012 2013F 2014F 2015F 2016F 2017F
-0.5
-0.4
-1.0 CBD net supply CBD forecast new supply
Central Business District (CBD)
Average annual net supply 1.1 mil sq ft (1993 – 2012)
Average annual net absorption 1.0 mil sq ft (1993 – 2012)
1.6 mil sq ft (2010 – 2012)
Note:
Source: CBRE Decentralized Office Market Report 2013 and CBRE 1Q 2013 Market Report for CBD supply
23 CapitaLand Presentation *June 2013*Island-wide new office supply not excessive;
Decentralized new supply declining
Net supply in Decentralised Area (1)
3.50
3.00
Forecast average annual
new supply (2013 to 2016):
2.50
0.5 mil sq ft
sq ft million
2.00
1.50 1.3
1.00
0.7 0.6
0.4 0.4
0.50 0.2
0.04 0.07 0.09
0.00
2007 2008 2009 2010 2011 2012 2013F 2014F 2015F
Decentralised Area net supply Decentralised Area forecast new supply
Decentralised Area
Average annual net supply 0.3 mil sq ft (2007 – 2012)
Average annual net absorption 0.3 mil sq ft (2007 – 2012)
Note:
(1) Decentralized office market supply projections exclude JEM and strata developments.
Source: CBRE Decentralized Office Market Report 2013
24 CapitaLand Presentation *June 2013*Singapore office market rent stabilising
1Q 12 2Q 12 3Q 12 4Q 12 1Q 13*
Mthly rent 10.60 10.10 9.80 9.58 9.55
$20 (S$ / sq ft ) S$18.80
% change -3.6% -4.7% -3.0% -2.2% -0.3%
$18
Monthly gross rent by per square foot
$16
$14 S$11.06
Prime Grade A
$12 S$9.55
S$8.00
$10
$8 S$7.50
S$4.48
$6
$4 S$4.00
Global Euro-zone
$2 Post-SARs, Dot.com crash financial crisis
crisis
$0
*No historical data for Grade A rents prior to 2002.
Source of data: CB Richard Ellis (Pte) Ltd (figures as at end of each quarter). CBRE no longer tracks prime rents from 3Q 2011.
25 CapitaLand Presentation * June 2013*Commercial Strategy
• To broaden product mix and geographical spread
– Office, SOHO, Business Park, Medical Suites, Mixed-use
developments
• To adapt “Build & Sell” to complement “Build & Hold”
strategy
• To grow CapitaCommercial Trust through acquisitions
from CapitaLand and third parties
26 CapitaLand Presentation *June 2013*Malaysia Iskandar
Region
Raffles City Singapore
27Iskandar Malaysia – 5 Flagship Zones
Senai-Skudai
Johor Bahru City
Centre
Eastern Gate
Nusajaya Development
Western Gate
Development
28 CapitaLand
CapitaLand Presentation
Presentation *June
*June 2013*
2013*Greater Connectivity between Singapore and Johor
• Iskandar Regional Mass Transit Network will commence construction latest by year 2015
• Expected to ease the travelling time and convenience between Singapore and Johor
• Enhance proximity of Singapore and Malaysia
29 CapitaLand
CapitaLand Presentation
Presentation *June
*June 2013*
2013*CapitaLand’s JV development
Location : Danga Bay A2 Island – 8 km West of Singapore-Johor Causeway
Danga Bay
A2 Island
30 CapitaLand
CapitaLand Presentation
Presentation *June
*June 2013*
2013*CapitaLand’s JV in Danga Bay A2 Island
Strategy
1. Supply and Demand
Control and manage timing and supply
10 – 12 years mixed development
2. Value Creation
Enjoy value appreciation of plots in
later development as township precinct
matures
3. Capitalise on Development Danga Bay A2 Island will feature a premier
Capability & Synergy waterfront residential community
comprising high rise and landed homes
Leverage on CapitaLand Group’s with a central waterfront hub with a marina,
development capability of malls & shopping mall, F&B outlets, serviced
serviced residences operation residences, offices and recreational
facilities
management
31 CapitaLand
CapitaLand Presentation
Presentation *June
*June 2013*
2013*Malaysia Strategy
• To focus primarily on Iskandar region
(leveraging on proximity to Singapore)
Penang
Kuala Lumpur
Iskandar
32 CapitaLand Presentation *June 2013*CapitaLand
Singapore’s
Strategy
Six Battery Road, Singapore
33CapitaLand Singapore’s Strategy
• Residential Property
– Actively participating in land sales
– To broaden product range
• Commercial Property
– To broaden product mix and geographical reach
– To adapt “Build & Sell” to complement “Build and Hold” strategy
– To grow CCT through acquisitions
• Malaysia
– To focus on Iskandar region
34Thank You 35
You can also read